Influence of landscape structure on Euglossini composition in open vegetation environments
Eduardo Freitas Moreira1, Rafaela Lorena da Silva Santos1, Maxwell Souza Silveira1, Danilo Boscolo2,
Edinaldo Luz das Neves3 & Blandina Felipe Viana1
1Universidade Federal da Bahia, Instituto de Biologia UFBA Rua Barão de Jeremoabo, Campus Universitário de
Ondina, Salvador, BA, Brazil
2Universidade de São Paulo, Faculdade de Filosofia, Ciências e Letras de Ribeirão Preto, Av. Bandeirantes, 3900,
Monte Alegre, Ribeirão Preto, SP, Brazil
3Centro Universitário Jorge Amado, Comércio Campus, Salvador, BA, Brazil
*Corresponding author: Eduardo Freitas Moreira, e-mail: [email protected]
MOREIRA, E. F., SANTOS, R. L. S., SILVEIRA M. S., BOSCOLO, D., NEVES E. L., VIANA, B. F. Influence of
landscape structure on Euglossini composition in open vegetation environments. Biota Neotropica. 17(1): e20160294.
http://dx.doi.org/10.1590/1676-0611-BN-2016-0294
Abstract: The fauna of Euglossini bees is poorly known in savanna regions, making it difficult to understand how these bees use open vegetation environments. The aim of this study was to evaluate the influence of landscape structure on species abundance and composition of Euglossini bees in naturally heterogeneous savanna landscapes. Nine sites were sampled monthly using six traps with chemical baits. Three aromatic essences (eucalyptol, methyl salicylate and vanillin) were used to attract the Euglossini. Surrounding environmental conditions were measured using three independent variables, calculated in multiple scales: index of local vegetation and two landscape indices (Shannon Diversity and area-weighted shape). We compared the competing hypotheses through model selection based on Second-order Akaike Information Criterion (AICc). The four competing hypothesis were: (1) The local vegetation complexity favors Euglossini bees species richness and/or abundance (local vegetation hypothesis); (2) The proportion of the native vegetation types favors Euglossini bees species richness and/or abundance (habitat amount hypothesis); (3) Higher landscape diversity shall increase species richness of Euglossini bees (landscape heterogeneity hypothesis); (4) More complex landscape configuration shall favor the Euglossini bees richness and/or abundance (landscape heterogeneity hypothesis). We sampled 647 individuals belonging to six species of two distinct genera. Our results support the habitat amount hypothesis since bees’ abundance was strongly related with the proportion of habitat in the surrounding landscape. This may be related to the availability of floral and nesting resources in some types of savanna vegetation.
Keywords: bees, habitat amount hypothesis, landscape heterogeneity, landscape configuration
Influência da estrutura da paisagem na composição de Euglossini em ambientes com
vegetação aberta
Resumo: A fauna das abelhas da tribo Euglossini é pouco conhecida em regiões de savana, tornando difícil a compreensão de como essas abelhas usam ambientes com vegetação aberta. O objetivo desse estudo foi avaliar a influência da estrutura da paisagem na abundância e composição de espécies de abelhas Euglossini em paisagens naturalmente heterogêneas de savana. Nove locais foram amostrados mensalmente utilizando seis armadilhas com iscas químicas. As essências eucaliptol, salicilato de metila e vanilina foram utilizadas para atrair os machos de Euglossini. As condições ambientais foram medidas usando três variáveis, calculadas em múltiplas escalas: índice de vegetação local e dois índices de paisagem (diversidade de Shannon e o índice de forma ponderado pela área). Através da seleção de modelos baseada no critério de informação de Akaike de segunda ordem (AICc) comparamos as hipóteses alternativas: (1) Vegetação local mais complexa favorece as abelhas Euglossini (hipótese da vegetação local); (2) A proporção dos tipos de vegetação nativas favorece as abelhas Euglossini (hipótese da quantidade habitat); (3) A diversidade da paisagem favorece a riqueza de espécies de abelhas Euglossini (hipótese da heterogeneidade da paisagem); (4) Configuração mais complexa da paisagem favorece a riqueza e/ou abundância de abelhas Euglossini (hipótese da heterogeneidade paisagem). Nós amostramos 647 indivíduos pertencentes a seis espécies de dois gêneros distintos. Nossos resultados apoiam a hipótese de quantidade de habitat já que a abundância das abelhas foi fortemente relacionada com a proporção de habitat nas paisagens circundantes. Esses resultados podem estar relacionados com a disponibilidade de recursos florais e substratos para nidificação em alguns tipos de savana.
Introduction
Given the importance of Euglossini bees for wild pollination as well as the practicity of its sampling, many studies adopted them as biological models in order to understand how bees in general use their environment and how they can be affected by habitat loss, fragmentation and homogenization in landscapes (Powell & Powell 1987, Tonhasca et al. 2002b, Viana et al. 2006, Brosi et al. 2007, Mendes et al. 2008, Brosi 2009, Knoll & Penatti 2012, Silveira et al. 2015, Aguiar et al. 2015). However, these studies present mixed results, with most of them poorly delineated and conducted in forested environments. Few studies were specifically designed to evaluate landscape effects on Euglossini bees, such as works by Brosi (2009) and Brosi et al. (2007) that showed evidences of positive relationships between Euglossini bees and the amount of border between forest and non-forest areas in landscapes, what suggests the association of these bees with transition environments. These results suggest that many Euglossini bees depend both on the forests and their surrounding open areas. Others also evidenced that Euglossini bees can cross large distances between forest patches or leave these forests during their resource foraging trips, what may help to explain why they appear to be little affected by fragmentation per se (Tonhasca et al. 2002b, Tonhasca et al. 2003, Milet-Pinheiro & Schlindwein 2005, Ramalho et al. 2009, Brosi et al. 2007, Rosa et al. 2016).
The Euglossini bees have Neotropical distribution and exist throughout South and Central America, especially in tropical forests, with some occurrences in the Southern United States (Michener 2007, Nemésio 2009). Males of these bees have close association with certain orchid species, based on supply and demand for aromatic compounds being therefore known as orchid bees. They are pollinators of many plant species representatives of dozens of botanical families (Dressler 1982, Cameron 2004) and are potentially long-range pollinators that can be important in highly heterogeneous environments such as the neotropical forests (Janzen 1971, Wikelski et al. 2010). Although commonly associated with forested environments, these bees are also present in open vegetation types such as the Brazilian savanna, called “Cerrado” (Knoll & Penatti 2012, Silveira et al. 2015). The Brazilian savanna is one of the world’s biodiversity hotspots and is under great pressure because of agricultural expansion and lack of conservation reserves (Myers et al. 2000, Klink & Machado 2005, Bellard et al. 2014). However, the Euglossini fauna in savanna environments is relatively unknown in contrast with forested environments which are well studied for this group, especially considering the savanna physiognomies with low stratification profiles. Such lack of information about the importance of open vegetation types such as savanna for these bees deeply limits our understanding of the effects of landscape structure on Euglossini communities.
Many factors can be determinant for the maintenance of Euglossini populations and community structures. The amount of floral resources, along with other local vegetation characteristics, can attract foraging bees, increasing their likelihood to pass through certain places (Chittka & Thomson 2001). Alternatively, residence of individuals in the landscape can be determined by the availability of limiting factors such as the amount of floral resources, nesting substrate or material for nest building in a broader area regulating the abundance or preventing the maintenance of bee populations (Potts et al. 2003, 2005). Therefore, the abundance and species richness can be directly proportional to the landscape coverage of the vegetation types that best meets the demands of the studied group, as expected according to the habitat amount hypothesis (Fahrig 2013). A third possibility is that the vegetation types with different floral compositions and physical features can have complementary roles for the bees (Dunning et al. 1992). For example, while some bee species can find nesting substrates in a given environment, the floral resources may be in another place, making necessary the presence of both landscape units for the presence of such species. Additionally, the differences in phenology may cause spatial and
temporal variations in the floral resources availability among vegetation types. In this case, the most heterogeneous landscapes may favor the maintenance of a greater abundance and species richness because of the complementarity of vegetation types as expected according to the landscape heterogeneity hypothesis (Fahrig et al. 2011).
It is, thus, very difficult to evaluate the importance of each of these effects separately. However, the comparison of multiple concurrent hypothesis (e.g. local vegetation, habitat amount and landscape heterogeneity) through model selection approaches based on Akaike Information Criterion (AIC) can help us to find reasonable explanation of observed patterns (Burnham & Anderson 2002). The Savanna domains comprise different vegetation types, ranging from grasslands to forests and typically form wide vegetation mosaics (Klink & Machado 2005, Brasil 1992). This natural heterogeneity is the result of a long and dynamic evolutionary history, forming an ideal environment to establish relationships between composition of biological communities and structural landscape patterns (Fahrig et al. 2011, Fahrig 2013). In this context, the aim of this study was to evaluate the influence of landscape structure on the abundance and species composition of Euglossini community in naturally heterogeneous Savanna landscapes through the comparison among the four alternative hypothesis: (1) The local vegetation complexity favors Euglossini bees species richness and/or abundance (local vegetation hypothesis); (2) The proportion of the native vegetation types favors Euglossini bees species richness and/or abundance (habitat amount hypothesis); (3) Higher landscape diversity shall increase species richness of Euglossini bees (landscape heterogeneity hypothesis); (4) More complex landscape configuration shall favor the Euglossini bees richness and/or abundance (landscape heterogeneity hypothesis).
Methods
1. Study region, selection of sampling units and sampling bees
The study was conducted in Mucugê Municipal Park (12º59’S, 41º20’W), located in Chapada Diamantina, Bahia, Brazil. The study region has an altitude ranging between 900 and 1400 meters and its vegetation is composed of a mosaic of savanna formations in a continuous structural gradient ranging from grass-woody (characterized by graminoid hemicryptophytes, geophytes and spaced rachitic wooded plants) to wooded savanna (characterized by sparse nano-cryptophytes and hemicryptophytes), with predominance of rocky savannas (Juncá et al. 2005) (Figure 1). The climate type is tropical savanna (Aw) according to the classification of Köppen-Geiger, characterized by the average temperature of the coldest month of the year greater than 18 ° C, higher rainfall than the potential evapotranspiration and with two marked dry and wet seasons. Rainfall is concentrated in the summer (Peel et al. 2007). With an average annual rainfall of 1281 mm, this region has a rainy season from November to April, with the average cumulative rainfall for this period being 942 mm and 339 mm in the dry season. Maximum annual average temperature is 29 ° C and the minimum is 19.8 ° C (INMET 2015).chemical bait) were installed in wooden stakes 1.3 m above the ground and at least 25 m distant from each other, forming a square with 50 m side, totaling six traps. The traps were exposed for 10 hours, from 7:00 am to 17:00 h, totaling a sampling effort of 540 hours per sample unit for each of the 13 field campaigns. This campaigns occurred at least 20 days apart between January and December of 2008 and the traps positions were rotated clockwise each time. All collected specimens were identified at the species level by the first author with the aid of specialized bibliographic materials and confirmed by the experts Edinaldo Luz das Neves and André Nemésio (Nemésio 2009). We adopted the taxonomic nomenclature of the Catalogue of bees (Hymenoptera, Apoidea) in the Neotropical Region (Moure et al. 2007). All collected specimens were deposited in the Zoology Museum of UFBA - MZUFBA. More detail is available in the support information Appendix 1.
2. Measuring the surrounding environmental conditions and
data analysis
In order to evaluate surrounding environmental conditions, we used a combination of remote sensing, geographic information systems (GIS) and field survey . The local vegetation structural characteristics was estimated through the 2-band enhanced vegetation index (Jiang et al. 2008), calculated based on data from KOMPSAT satellite images with four meter of spatial resolution, obtained in November 2008. This index is directly proportional to the density of photosynthetic active biomass. For each sampling unity we calculated the mean values of the pixels of the vegetation index layers within buffers with radii varying from 25 to 100 m, in increasing steps of 25 m.
To calculate the proportions of each vegetation type and the landscape indices, a land cover map was created through a supervised classification of the same KOMPSAT satellite images using the maximum likelihood algorithm (Moreira et al. 2016). The map included four vegetation classes as defined by Veloso et al. (1991), with few adaptations: rupestrian wooded savanna, wooded savanna, grass-woody savanna and rupestrian grass-woody savanna, plus exposed soil and water (Figure 1). The landscape heterogeneity indices adopted were the landscape Shannon Diversity and the area-weighted shape index, which represent the compositional and configurational heterogeneity respectively (Fahrig et al. 2011, Turner & Gardner 2015). In addition, the proportion of the landscape covered by each vegetation type was also calculated. All landscape indices were based on buffers raging from 250 m to 1250 m with 250 m increases. The calculation of the EVI2 and land cover classifications were using the vegetation ArcGISTM 9.3 (ESRI 2008) and
4.7 ENVITM 2009 and ITT. Landscape pattern quantification was done using FRAGSTATS 3.3 (McGarigal et al. 2012). More detail is available in the support information Appendix 2.
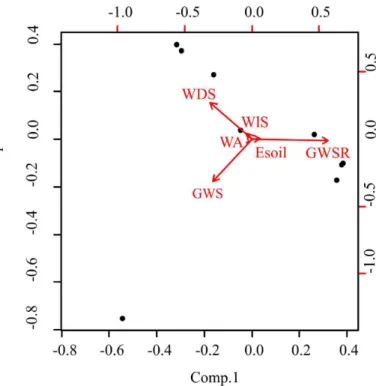
Euglossini standards. The fact is that there is very little information on the actual home range of these bees. Even if the maximum home range of a species is well known the correspondence with the scale of measurement is not direct because multiple levels of influence are present (Moreira et al. 2015). Therefore, no particular scale was assumed in this work. Instead, the scale with the highest coefficient of determination (R2) was selected from a range of scales, from 25 to 100 m for the local vegetation and from 250 to 1250 m for the landscape structure, both are compatible with what was found for other native bees (Steffan-dewenter et al. 2002, Moreira et al. 2015). These coefficients were calculated for each combination of the dependent variables (species richness, total abundance and abundance of each species) and independent (local vegetation structure, landscape diversity, configuration and proportion of each vegetation type). Finally, to assist the interpretation of the results an exploratory principal component analysis (PCA) was performed with the proportions of each vegetation cover. These statistical analyses were performed using the R 2.15.0 program, with the packages stats and vegan version 2.2-1 (R Development Core Team 2009).
To compare the alternative hypotheses for the relationship between the surrounding environmental conditions with Euglossini bees community characteristics, a model selection approach based on Akaike Information Criterion (AIC) was used. The four a priori theoretical hypotheses were confronted for each dependent variable: (1) The local vegetation complexity favors Euglossini bees species richness and/or abundance (local vegetation hypothesis); (2) The proportion of the native vegetation types favors Euglossini bees species richness and/or abundance (habitat amount hypothesis); (3) Higher landscape diversity shall increase species richness of Euglossini bees (landscape heterogeneity hypothesis); (4) More complex landscape configuration shall favor the Euglossini bees richness and/or abundance (landscape heterogeneity hypothesis). A set of mathematical models describing each of these hypotheses were included in the model selection procedure along with a null model represented by a constant. The hypothesis 1, 3 and 4 had one model with the local vegetation index, landscape Shannon Diversity and the Configuration, and only positive relationships were admitted in agreement with the theoretical expectations. Since a vegetation class could not be defined as the most likely habitat a priory, the hypothesis 2 was represented by four models with the proportion of the vegetation classes, what corresponds to eight statistical hypothesis since both positive and negative relationships were considered as equally likely a priory. Only models with one variable were included in the model selection given the restrictive number of degrees of freedom (Burnham & Anderson 2002). The models were compared using the values of the second-order Akaike information criterion (AICc), which is suitable for small samples (n<40) (Burnham & Anderson 2002). The delta AICc (Δi) value for each model, namely, the difference between the AICc value for that model with the lowest AICc in the set, was used to evaluate the plausibility of the candidate models. Models with values of delta AICc (Δi) ≤ 2 were considered equally plausible. We also considered the Akaike weights (Wi) of the models to evaluate the relative amount of evidence for
the best model (Burnham & Anderson 2002). The statistical analyses were performed using the R 2.15.0 program, with the packages stats and ‘bbmle’ version 1.0.16 (R Development Core Team 2009). All data used in this analysis are available in the online supplementary information Appendix 3.
Results
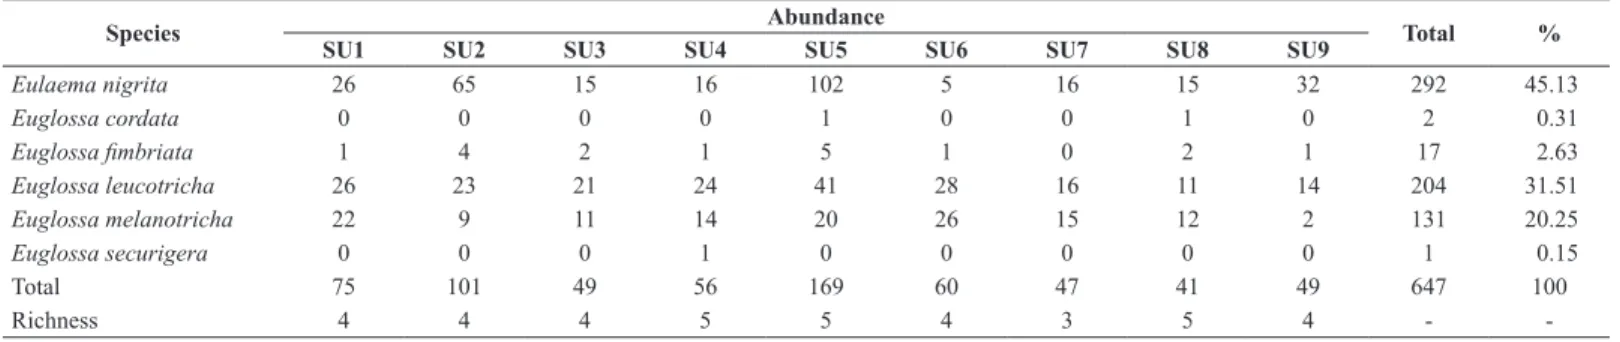
The 647 Euglossini individuals collected were classified into two genera and six species (Table 1). The Euglossini community proved to be dominated by three more abundant species, Eulaema nigrita Lepeletier (1841), Euglossa leucotricha Rebêlo & Moure (1996) and Euglossa melanotricha Moure (1967), which occurred in all sample units and represent approximately 96.9% of the total abundance. Euglossa fimbriata Rebêlo & Moure (1968) accounts for 2.6% and was collected in eight of the nine sampling units. The other species, Euglossa cordata Linnaeus (1758) and Euglossa securigera Dressler (1982) were much less frequent.
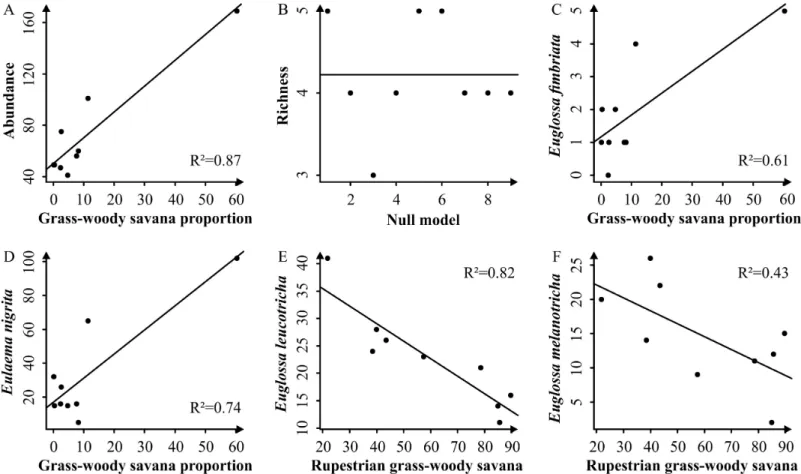
In general, our results support that the amount of surrounding habitat in the landscape has a positive and strong influence on species richness and abundance (Table 2). The total abundance is best explained by a positive relationship with the proportion of grass-woody savanna in the surrounding landscape. This model is well supported and has a good fit with the data (Table 2; Figure 2 A). The model selection for species richness is inconclusive since the null model presented the lowest AICc value (Table 2; Figure 2 B).
Analyzed separately, the four most abundant species show two different trends. The first is for Euglossa fimbriata and Eulaema nigrita that were best explained by a positive relationship with the proportion of grass-woody savanna in the landscape (Table 2; Figure 2 C and D). For Eulaema nigrita the best model was well supported with a good fit to the data.
Euglossa fimbriata also presented a positive tendency with the same factor. However, the model selection for this specie showed inconclusive results considering that the best model has poor support (Wi<0.6) and that the null model can be considered equally plausible (∆i ≤ 2). Even so, there is a clear tendency of positive relation between Euglossa fimbriata and the grass-woody savanna proportion in the landscape (Figure 2 C). The second trend was presented by Euglossa leucotricha and Euglossa melanotricha as negative relationship with the rupestrian grass-woody savanna (Table 2; Figure 2 E and F). The best model for Euglossa leucotricha is well supported and presents a good fit with the data (Figure 2 E). Although the best model for Euglossa melanotricha do not have a high weight of evidence (Wi<0.6), it is substantially more supported (∆i ≥ 2) than the second model in the rank (Table 2; Figure 2 F).
Discussion
All results supported the habitat amount hypothesis proposed by Fahrig (2013), which predicts that species abundance must be primarily driven by the proportion of habitat in the surrounding landscape. However, the observed species did not respond similarly among each other to the amount
Table 1: Abundance and richness distribution of Euglossini bees in all sample units.
Species Abundance Total %
SU1 SU2 SU3 SU4 SU5 SU6 SU7 SU8 SU9
Eulaema nigrita 26 65 15 16 102 5 16 15 32 292 45.13
Euglossa cordata 0 0 0 0 1 0 0 1 0 2 0.31
Euglossa fimbriata 1 4 2 1 5 1 0 2 1 17 2.63
Euglossa leucotricha 26 23 21 24 41 28 16 11 14 204 31.51 Euglossa melanotricha 22 9 11 14 20 26 15 12 2 131 20.25 Euglossa securigera 0 0 0 1 0 0 0 0 0 1 0.15
Total 75 101 49 56 169 60 47 41 49 647 100
Richness 4 4 4 5 5 4 3 5 4 -
Table 2 – Model selection results for the six dependent variables.
Variable Model AICc AICc∆i df AICcWi
Richness y = β0 33.2 0 1 0.364
y = -β1 RGWS (750) + β0 36.3 3.1 2 0.076
Abundance y = +β1 GWS (250) + β0 90 0 2 1
y = -β1 RGWS (250) + β0 121.8 31.8 2 <0.001
Euglossa leucortricha y = -β1 RGWS (250) + β0 54.2 0 2 0.8564
y = +β1 LDI (1250) + β0 58.7 4.5 2 0.0897
Euglossa melanotricha y = -β1 RGWS (250) + β0 66.1 0 2 0.4769
y = +β1 LDI (250) + β0 68.1 2 2 0.1735
Euglossa fimbriata y = +β1 GWS (250) + β0 32.2 0 2 0.285
y = +β1 LCC (500) + β0 32.7 0.6 2 0.214
y = β0 33.7 1.5 1 0.135
y = -β1 RGWS (250) + β0 34.5 2.4 2 0.087
Eulaema nigrita y = +β1 GWS (250) + β0 128.3 0 2 1
y = +β1 LCC (1000) + β0 162.7 34.4 2 <0.001
AICc – Akaike’s Information Criterion corrected for small samples; AICc∆i - AICc differences; df – degree of freedom; AICcWi – Akaike weight; GWS - grass-woody savanna; RGWS - rupestrian grass-woody savanna; LCC - landscape configuration complexity; LDI - Landscape diversity index, between parentheses are the scales of measurement.
Figure 2 – Relationships between the dependent variables with the selected explanatory factors. The solid lines represent fitted models and the dots represent the observed
results for each sample unity.
of habitat. A possible explanation for this result is that this specific variation in responses may be associated with the floral and nesting resources availability in the landscapes. To accept this statement, it is necessary to assume that the abundance of the male bees attracted to the chemical baits is a function of the reproductive success of their mothers and inversely related with the distance between the baits and their original nests. This is a reasonably logic assumption considering that the reproductive success is determmined by the population recruitment, once the original nests are the center of dispersion of the males and that the bait efficiency is reduced
conditions are common in grass-woody savanna and that preferences for more open areas were previously reported, one can propose that this vegetation type is a potential adequate environment to the nesting behavior of the most abundant Euglossini bees in the studied region, although such proposition calls for additional empirical verification (Rebêlo & Garófalo 1997, Silveira et al. 2015, Juncá et al. 2005).
The scarcity or total absence of floral and nesting resources in the landscape can also explain the negative effect of the proportion of rupestrian grass-woody savanna. In this vegetation type, Euglossa leucotricha and Euglossa melanotricha, both with preference for more dense/vegetated or forested areas, the soft ground is practically absent and the scattered plants grow on bare rock and are rachitic because of the dry oligotrophic conditions (Juncá et al. 2005, Silveira et al. 2015). Such environment with low humidity and high temperature variations can be challenging for Euglossini bees to build their nests (Dressler 1982, Roubik 1992, Cameron 2004). This leads us to the question of why Euglossa leucotricha and Euglossa melanotricha did not respond directly to the proportion of grass-woody savanna like the other two species? The missing piece here is the wooded savanna. Like the grass-woody savanna, the wooded savanna also has appropriate conditions for Euglossini bees to build their nests (Juncá et al. 2005). In addition, both vegetation types have richer and more abundant floral resources than the rupestrian grass-woody savanna (Moreira et al. 2015, Moreira et al. 2016). Therefore, the amount of resources present on the landscape are inversely proportional to the rupestrian grass-woody savanna cover (Figure 3, Moreira et al. 2016). If the proposed effects are true, one can conclude that rupestrian grass-woody savanna is unfavorable for Euglossini bees. Furthermore, in the studied region Euglossa leuchotricha and Euglossa melanotricha can use both grass-wood savanna and wooded savanna, when Euglossa fimbriata and Eulaema nigrita may use preferentially the first one.
The differences among species in their responses to vegetation types, as discussed above, also illustrate the problem associated with confusions
regarding the use of the terms ‘vegetation types’ and ‘habitat’, commonly used as synonyms (Mitchell 2005). This is especially important considering that the species studied here are also present in forested environments (Tonhasca et al. 2002a, Tonhasca et al. 2003, Milet-Pinheiro & Schlindwein 2005, Ramalho et al. 2009, Brosi et al. 2007, Aguiar et al. 2015, Rosa et al. 2015). Studies that aim to evaluate the effects of habitat loss on Euglossini bees in forested regions generally assume binary landscapes including only the categories ‘habitat’ (forest) and ‘inhospitable matrix’ (non-forest) (Tonhasca 2002a, Tonhasca et al. 2003, Milet-Pinheiro & Schlindwein 2005, Ramalho et al. 2009, Brosi et al. 2007). However many species do not necessarily perceive the environment in that way. Our results show that this approach may be inadequate for community level analyses, and is likely a reason for some of the mixed results reported in the literature. There are two alternatives to deal with this problem. The first is to analyze only the species that are closely associated with forests and therefore are dependent on these environments (Pardini et al. 2010). The second alternative is to explicitly consider the landscape’s heterogeneity instead of the single habitat notion for the community level (Fahrig et al. 2013, Moreira et al. 2015). If the last one is done, we can greatly increase our understanding of the relationship between Euglossini and the spatial structure of the surrounding environments.
Acknowledgments
We thank the Conselho Nacional de Pesquisa e Desenvolvimento Científico e Tecnológico (CNPq) for the financial aid. We also thank the team of the Laboratório de Biologia e Ecologia de Abelhas (LABEA), for their help in sampling design and fieldwork, especially Camila Magalhães Pigozo and Alder Oliveira-Alves. For the last but not the least, we thank the professor André Nemésio from the Universidade Federal de Minas Gerais for the confirmation of the species identification.
References
AGUIAR, W.M. DE, SOFIA, S.H., MELO, G.A.R. & M.C. GAGLIANONE. 2015. Changes in Orchid Bee Communities Across Forest-Agroecosystem Boundaries in Brazilian Atlantic Forest Landscapes. Environ. Entomol. 44(6): 1465–1471.
AUGUSTO, S.C. & C.A. GARÓFALO. 2009. Bionomics and sociological aspects of Euglossa fimbriata (Apidae, Euglossini). Genet. Mol. Res. 8(2): 525–538.
AUGUSTO, S.C. & C.A. GARÓFALO. 2007. Nidificação de Euglossa (Euglossa) melanotricha Moure (Hymenoptera: Apidae) no Solo do Cerrado. Neotrop. Entomol. 36(1): 153–156.
BELLARD, C., LECLERC, C., LEROY, B., BAKKENES, M., VELOZ, S., THUILLER, W. & F. COURCHAMP. 2014. Vulnerability of biodiversity hotspots to global change. Glob. Ecol. Biogeogr. 23(12): 1376–1386.
BRASIL, I.B.G.E. 1992. Manual Técnico da Vegetação Brasileira.
BROSI, B.J. 2009. The effects of forest fragmentation on euglossine bee communities (Hymenoptera: Apidae: Euglossini). Biol. Conserv. 142(2): 414–423.
BROSI, B.J., DAILY, G.C. & P.R. EHRLICH. 2007. Bee community shifts with landscape context in a tropical countryside. Ecol. Appl. 17(2): 418–430. BURNHAM, K.P. & D.R. ANDERSON. 2002. Model selection and multimodel
inference: a practical information-theoretic approach. Springer-Verlag, New York.
CAMERON, S.A. 2004. Phylogeny and biology of neotropical orchid bees (Euglossini). Annu. Rev. Entomol. 49(107): 377–404.
CHITTKA, L. & J.D. THOMSON. 2001. Cognitive Ecology of Pollination Animal Behavior and Floral Evolution.
DIRETORIA DE DESENVOLVIMENTO FLORESTAL. 1998. Mapa da Cobertura Vegetal do Estado da Bahia.
DRESSLER, R.L. 1982. Biology of the Orchid Bees (Euglossini). Annu. Rev. Ecol. Syst. 13(1): 373–394.
DUNNING, J.B., DANIELSON, B.J. & H.R. PULLIAM. 1992. Ecological Processes That Affect Populations in Complex Landscapes. Oikos 65(1): 169–175. Figure 3 - Principal components of the proportion of the six cover types in the
FAHRIG, L. 2013. Rethinking patch size and isolation effects: the habitat amount hypothesis K. Triantis (Ed.). J. Biogeogr. 40(9): 1649–1663.
FAHRIG, L., BAUDRY, J., BROTONS, L., BUREL, F.G., CRIST, T.O., FULLER, R.J., SIRAMI, C., SIRIWARDENA, G.M. & J.L. MARTIN. 2011. Functional landscape heterogeneity and animal biodiversity in agricultural landscapes. Ecol. Lett. 14(2): 101–112.
INMET, Instituto Nacional de Meteorologia. BDMEP - Banco de Dados Meteorológicos para Ensino e Pesquisa. Online version available at: http://www.inmet.gov.br/ portal/index.php?r=bdmep/bdmep. (last acess in 11/Oct/2015).
JANZEN, D.H. 1971. Euglossine Bees as Long-Distance Pollinators of Tropical Plants. Science. 171(3967): 203–205.
JIANG, Z., HUETE, A., DIDAN, K. & T. MIURA. 2008. Development of a two-band enhanced vegetation index without a blue two-band. Remote Sens. Environ. 112(10): 3833–3845.
JUNCÁ, F.A., FUNCH, L. & W. ROCHA. 2005. Biodiversidade e Conservação da Chapada Diamantina. Ministério do Meio Ambiente, Brasília.
KLINK, C.A. & R.B. MACHADO. 2005. A conservação do Cerrado brasileiro. Megadiversidade 1(1): 147–155.
KNOLL, F.R.N. & N.C. PENATTI. 2012. Habitat Fragmentation Effects on the Orchid Bee Communities in Remnant Forests of Southeastern Brazil. Neotrop. Entomol. 41(5): 355–365.
MCGARIGAL, K., CUSHMAN, S.A. & E. ENE. 2012. FRAGSTATS v4.1: Spatial pattern analysis Program for categorical and continuous maps.
MENDES, F.N., RÊGO, M.M.C. & C.C. CARVALHO. 2008. Abelhas Euglossina (Hymenoptera, Apidae) coletadas em uma monocultura de eucalipto circundada por Cerrado em Urbano Santos, Maranhão, Brasil. Iheringia 98(3): 285–290. MICHENER, C.D. 2007. The Bees the World. The Johns Hopkins University
Press, Baltimore.
MILET-PINHEIRO, P. & C. SCHLINDWEIN. 2005. Do euglossine males (Apidae, Euglossini) leave tropical rainforest to collect fragrances in sugarcane monocultures? Rev. Bras. Zool. 22(4): 853–858.
MITCHELL, S.C.S. 2005. How useful is the concept of habitat? – a critique. Oikos. 110(3) 634–638.
MOREIRA, E.F., BOSCOLO, D. & B.F. VIANA. 2015. Spatial Heterogeneity Regulates Plant- Pollinator Networks across Multiple Landscape Scales. PLoS One. 10(4): e0123628. doi:10.1371/journal.pone.0123628
MOREIRA, E.F., SANTOS, R.L.S., FRANCA-ROCHA, W.J.S., BOSCOLO, D. & C.M. PIGOZZO. 2016. Comparação e Desempenho de Algoritmos Paramétricos
na Classificação Supervisionada de Áreas Naturalmente Heterogêneas e
Dinâmicas. Rev. Bras. Cartogr. 68(3): 581–594.
MOURE, J.S., GABRIEL, A.R. & D. URBAN. Catalogue of bees (Hymenoptera, Apoidea) in the neotropical region. Curitiba: Sociedade Brasileira de Entomologia, 2007.
MYERS, N., MITTERMEIER, R.A., MITTERMEIER, C.G., FONSECA, G.A.B. & J. KENT. 2000. Biodiversity hotspots for conservation priorities. Nature 403(6772): 853–8.
NEMÉSIO, A. 2009. Orchid bees (Hymenoptera: Apidae) of the Brazilian Atlantic Forest Z. 2041 (Ed.). Zootaxa 2041: 1–242.
NEVES, E.L. & B.F. VIANA. 1997. Inventário da fauna de Euglossinae (Hymenoptera,
Apidae) do baixo sul da Bahia, Brasil. Rev. Bras. Zool. 14(4): 831-837. OLIVEIRA, M.L. & L.A.O. CAMPOS. 1996. Preferência por estratos florestais
e por substâncias odoríferas em abelhas Euglossinae (Hymenoptera, Apidae). Rev. Bras. Zool. 13(4): 1075–1085.
PARDINI, R., BUENO, A.A., GARDNER, T.A., PRADO, P.I. & J.P. METZGER. 2010. Beyond the Fragmentation Threshold Hypothesis: Regime Shifts in Biodiversity Across Fragmented Landscapes B. Fenton (Ed.). PLoS One. 5(10): e13666. doi:10.1371/journal.pone.0013666
PEEL, M.C., FINLAYSON, B.L. & T.A. MCMAHON. 2007. Updated world map
of the Köppen-Geiger climate classification. Hydrol. Earth Syst. Sci. Discuss.
4(2): 439–473.
POKORNY, T., LOOSE, D., DYKER, G., QUEZADA-EUAN, J.J.G. & T. ELTZ. 2014. Dispersal ability of male orchid bees and direct evidence for long-range flights. Apidologie 46(2): 224–237.
POTTS, S.G., VULLIAMY, B., DAFNI, A., NE’EMAN, G. & P. WILLMER. 2003. Linking Bees and Flowers: How Do Floral Communities Structure Pollinator Communities? Ecology 84(10): 2628–2642.
POTTS, S.G., VULLIAMY, B., ROBERTS, S., O’TOOLE, C., DAFNI, A., NE’EMAN, G. & P. WILLMER. 2005. Role of nesting resources in organising diverse bee communities in a Mediterranean landscape. Ecol. Entomol. 30(1): 78–85. POWELL, A.H. & G.V. POWELL. 1987. Population dynamics of male euglossine
bees in Amazonian forest fragments. Biotropica 19(2): 176–179.
RAMALHO, A.V., GAGLIANONE, M.C. & M.L. OLIVEIRA. 2009. Comunidades de abelhas Euglossina (Hymenoptera, Apidae) em fragmentos de Mata Atlântica no Sudeste do Brasil. Rev. Bras. Entomol. 53(1): 95–101.
REBÊLO, J.M.M. & C.A. GARÓFALO. 1997. Comunidades de machos de Euglossini (Hymenoptera: Apidae) em matas semidecíduas do Nordeste do estado de São Paulo. An. Soc. Entomol. Bras. 26(2): 243–255.
ROSA, J.F., RAMALHO, M. & M.C. ARIAS. 2016. Functional connectivity and genetic diversity of Eulaema atleticana (Apidae, Euglossina) in the Brazilian Atlantic Forest Corridor: assessment of gene flow. Biotropica 48(4): 509–517. ROSA, J.F., RAMALHO, M., MONTEIRO, D. & M.D. SILVA. 2015. Permeability of matrices of agricultural crops to Euglossina bees (Hymenoptera, Apidae) in the Atlantic Rain Forest. Apidologie 46(6): 691–702.
ROUBIK, D.W. 1992. Ecology and Natural History of Tropical Bees. Cambridge: Cambridge University.
SILVEIRA, G.C., FREITAS, R.F., TOSTA, T.H.A., RABELO, L.S., GAGLIANONE, M.C. & S.C. AUGUSTO. 2015. The orchid bee fauna in the Brazilian savanna: do forest formations contribute to higher species diversity? Apidologie 46(2): 197–208.
STEFFAN-DEWENTER, I., MÜNZENBERG, U., BÜRGER, C., THIES, C. & T. TSCHARNTKE. 2002. Scale dependent effects of landscape context on three pollinator guilds. Ecology. 83(5) 1421–1432.
TONHASCA, A., BLACKMER, J.L. & G.S. ALBUQUERQUE. 2002a. Abundance and Diversity of Euglossine Bees in the Fragmented Landscape of the Brazilian Atlantic Forest. Biotropica 34(3): 416–422.
TONHASCA, A., BLACKMER, J.L. & G.S. ALBUQUERQUE. 2002b. Within-habitat heterogeneity of euglossine bee populations: a re-evaluation of the evidence. J. Trop. Ecol. 18(6): 929–933.
TONHASCA, A., ALBUQUERQUE, G.S. & J.L. BLACKMER. 2003. Dispersal of euglossine bees between fragments of the Brazilian Atlantic Forest. J. Trop. Ecol. 19(1): 99–102.
TURNER, M.G. & R.H. GARDNER. 2015. Landscape Ecology in Theory and Practice. Springer New York, New York, NY.
VELOSO, P.H., FILHO, R.R.L.A. & A.C.J. LIMA. 1991. Classificação da vegetação
brasileira, adaptada a um sistema universal. Fundação Instituto Brasileiro de
Geografia e Estatística IBGE.
VIANA, B.F., MELO, A.M.C. & P.D. DRUMOND. 2006. Variação na estrutura do
habitat afetando a composição de abelhas e vespas solitárias em remanescentes
florestais urbanos de Mata Atlântica no Nordeste do Brasil. Sitientibus. Série
Ciências Biológicas 6(4): 282–295.
WIKELSKI, M., MOXLEY, J., EATON-MORDAS, A., LÓPEZ-URIBE, M.M., HOLLAND, R., D. MOSKOWITZ, D. W. ROUBIK, & R. KAYS. 2010. Large-range movements of neotropical orchid bees observed via radio telemetry. N. E. Raine (Ed.). PLoS One. 5(5): e10738. doi:10.1371/journal.pone.0010738 ZUCCHI, R., SAKAGAMI, S. & J.M.F. CAMARGO. 1969. Instructions for use
observations on a neotropical parasocial bee, Eulaema nigrita, with a review of Euglossinae (Hymenoptera, Apidae). A comparative study. 北海道大學理
學部紀要 = Hokkaido Daigaku Rigakubu Kiyo. Dai-6-Bu. Dobutsugaku-Hen 17(2): 271–380.
Supplementary material
The following online material is available for this article:
Appendix 1: Detailed description of the selection of the sampling unities Appendix 2: Detailed local vegetation and landscape structure measurement scheme
Appendix 3: Dataset