* Corresponding author:
E-mail: thiagoleitealencar@ yahoo.com.br
Received: September 1st, 2015 Approved: February 25, 2016
How to cite: Alencar TL, Chaves AF, Freire AG, Assis Júnior RN, Mota JCA. Liquid Bovine Biofertilizer and Cultivation Effects on the Porosity of a Typic Haplocambids as a Function of Cultivation and Dose. Rev Bras Cienc Solo. 2016;40:e0150307.
Copyright: This is an open-access article distributed under the terms of the Creative Commons Attribution License, which permits unrestricted use, distribution, and reproduction in any medium, provided that the original author and source are credited.
Liquid Bovine Biofertilizer and
Cultivation Effects on the Porosity
of a Typic Haplocambids as a
Function of Cultivation and Dose
Thiago Leite de Alencar(1)*
, Arilene Franklin Chaves(1)
, Alcione Guimarães Freire(1) , Raimundo Nonato de Assis Júnior(2)
and Jaedson Cláudio Anunciato Mota(2) (1) Universidade Federal do Ceará, Departamento de Ciências do Solo, Programa de Pós-graduação em
Ciência do Solo, Fortaleza, Ceará, Brasil. (2)
Universidade Federal do Ceará, Departamento de Ciências do Solo, Fortaleza, Ceará, Brasil.
ABSTRACT: The soil porous space is where processes related to gases and soil solution occur, and provides an adequate guide for agricultural practices. This study aimed to evaluate the integrated effects of cultivation and the application of liquid bovine biofertilizer on the porous network of a Typic Haplocambids (Cambissolo Háplico Ta Eutrófico) cultivated with figs (Ficus carica L.). Four treatments were evaluated (under fig cultivation with the application of 20, 40 and 60 % of biofertilizer through irrigation, a control treatment without biofertilizer and an additional treatment – soil under natural vegetation). Disturbed and undisturbed soil samples were collected in three soil layers (0.0-0.1, 0.1-0.2 and 0.2-0.3 m) with four replicates. The following physical properties were analyzed: particle-size distribution, soil bulk and particle densities, and soil water retention curve. The coefficient of intrinsic soil air permeability was calculated based on the equation that considers the decreasing pressure method. Soil porosity, pore continuity index and blocked porosity were calculated and pore length was estimated. Compared with the native forest, pore network quality is improved, if not maintained, when the soil is cultivated under the conditions described in this experiment. In the conditions of cultivation, the application of bovine biofertilizer, for supplying sediments that block or reduce the size of the pores, did not improve soil air permeability. The cases where pore network quality was worsened in soil porosity as a result of the applied treatments (Biofertilizer 20 %, Biofertilizer 40 % and Biofertilizer 60 % for the layer of 0.0-0.1 m and Biofertilizer 60 % for 0.1-0.2 m), although not considered critical to plant development, point to the need for specific management practices (for instance, avoid coarse residues in the biofertilizer before its application) to avoid soil degradation.
INTRODUCTION
The knowledge on the geometry and magnitude of soil porous space is essential to understand soil water and solute dynamics, as well as gas diffusion (Ball et al., 2007). Plant development is significantly affected by the capacity of the soil to promote an adequate gas exchange between the rhizosphere and the atmosphere (Silva et al., 2009). Therefore, the quantification and the monitoring of properties related to the soil porous system are important to evaluate its physical functionality.
Intrinsic soil air permeability and pore continuity and length indices are parameters that influence soil gas and water flows. Thus, they are relevant for soil porous space characterization and the identification of changes in soil structure, since they are sensitive to the effects of management practices (Blackwell et al., 1990; Fish and Koppi, 1994; Cavalieri et al., 2009).
Soil porous system can be significantly altered by different factors, and frequently happens as a result of anthropic actions associated with land uses (Costa et al., 2014). Soil management practices have a great impact on soil aeration. Practices promoting soil disturbance with the use of plows tend to increase the volume of pores, soil permeability and air storage (Braunack and Dexter, 1989). In this scenario, the addition of organic material, like bovine biofertilizer, has been an anthropic alteration used to improve functional performance in the agricultural system (Kitamura et al., 2008). However, the magnitude of the alteration in structure and functionality of the soil porous system, caused by the addition of bovine biofertilizer, needs to be better detailed.
Comprehension of the existing relationships in the pore network induced by soil management is crucial for the prognosis of characteristics involving water, solutes and gas flow in the soil profile. Such understanding helps farmers and researchers more efficiently to develop an adequate management plan to be adopted in the production of a given crop (Lipiec et al., 2006).
This study was based on the following hypotheses: 1) cultivation, since it degrades soil properties related to porous geometry, worsens its quality compared with soil under natural vegetation; and 2) the application of bovine biofertilizer (organic matter) in soil under cultivation, since it acts as a cementing agent between soil particles, improves soil structure and, consequently, properties related to the porous system. Therefore, this study aimed to evaluate the integrated effects of cultivation and the application of a biofertilizer on the porous network of a Cambissolo Háplico Eutrófico cultivated with fig (Ficus carica L.).
MATERIALS AND METHODS
Studied area
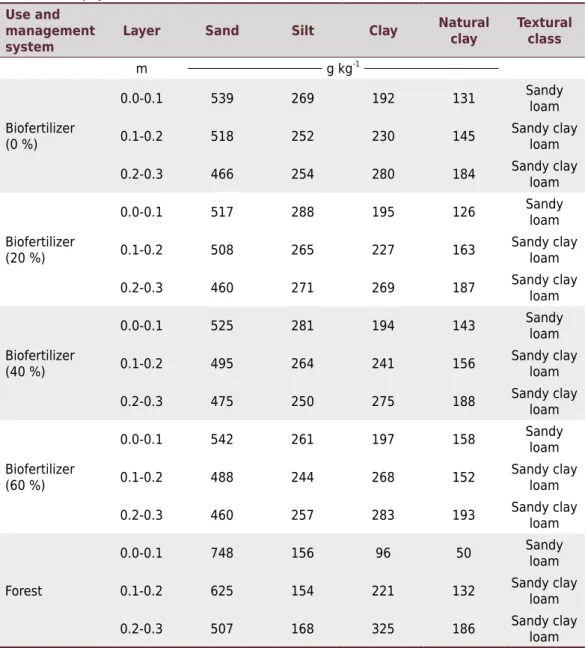
The area is located at the Apodi Plateau, in the municipality of Limoeiro do Norte, Ceará, Brazil. The experimental area cultivated with fig (0.02 ha) has the geographic coordinates of 5° 10’ 57.64” S and 38° 0’ 45.97” W in its center, at an altitude of 145 m. The secondary native forest, taken as a reference, is located 400 m away from the cultivated area. The soil of the experimental area is classified as a Cambissolo Háplico Ta Eutrófico (Santos et al., 2013), corresponding to Typic Haplocambids (Soil Survey Staff, 2014), originated from the limestone of the Jandaíra Formation (Brasil, 1973). Selected soil properties are shown in table 1.
Experimental procedure
soil was produced through an anaerobic process, in plastic receptacles (volume of 200 L). A hose was attached to its lid with the other tip immersed in a receptacle with water until the height of 0.20 m, for gases outlet. The proportion for the biofertilizer production was 50 % (volume/volume) of the fermentation of the fresh bovine manure and water, for a period of 30 days.
Biofertilizer doses were formulated with the following proportions: T0, 0:5 – 0 % biofertilizer and 100 % water; T1, 1:4 – 20 % biofertilizer and 80 % water; T2, 2:3 – 40 % biofertilizer and 60 % water; and T3, 3:2 – 60 % biofertilizer and 40 % water. The biofertilizer was applied to the soil from October 2010 to August 2012, for a total of 23 months, over four crop cycles, with 46 applications, and 138 L of solution per plant. A localized drip irrigation system was used for the fertigation in the experiment, which was designed to operate with two emitter lines per plant row, with four emitters per plant, each with a mean flow rate of 4 L h-1. At the end of the experiment, the amount of organic material added to the soil through the 20, 40 and 60 % biofertilizer was approximately 0.182, 0.364 and 0.546 kg per m² of soil, respectively. Biofertilizer samples were for chemical characterization (Table 2).
Table 1. Soil physical characteristics Use and
management system
Layer Sand Silt Clay Natural
clay
Textural class
m g kg-1
Biofertilizer (0 %)
0.0-0.1 539 269 192 131 Sandy
loam
0.1-0.2 518 252 230 145 Sandy clay
loam
0.2-0.3 466 254 280 184 Sandy clay
loam
Biofertilizer (20 %)
0.0-0.1 517 288 195 126 Sandy
loam
0.1-0.2 508 265 227 163 Sandy clay
loam
0.2-0.3 460 271 269 187 Sandy clay
loam
Biofertilizer (40 %)
0.0-0.1 525 281 194 143 Sandy
loam
0.1-0.2 495 264 241 156 Sandy clay
loam
0.2-0.3 475 250 275 188 Sandy clay
loam
Biofertilizer (60 %)
0.0-0.1 542 261 197 158 Sandy
loam
0.1-0.2 488 244 268 152 Sandy clay
loam
0.2-0.3 460 257 283 193 Sandy clay
loam
Forest
0.0-0.1 748 156 96 50 Sandy
loam
0.1-0.2 625 154 221 132 Sandy clay
loam
0.2-0.3 507 168 325 186 Sandy clay
In order to evaluate soil porous system quality, five soil scenarios were considered (under fig cultivation with the application of 20, 40 and 60 % biofertilizer through irrigation, a control treatment without biofertilizer and an additional treatment – soil under natural vegetation), in three soil layers (0.0-0.1, 0.1-0.2 and 0.2-0.3 m) (Table 2).
Analyses
Disturbed and undisturbed soil samples were collected in the previously mentioned layers. Disturbed soil samples were analyzed in the laboratory for granulometry and particle density. Undisturbed soil samples were collected using an Uhland soil sampler, in 0.05-m-high steel rings with a diameter of 0.05 m. These samples were analyzed in the laboratory for particle-size distribution, soil bulk and particle densities, soil water retention curve, total porosity, macroporosity, microporosity, intrinsic soil air permeability (Kair), pore continuity indices (K1 and N) and average pore length (Lp).
In the particle-size distribution analysis, clay content was determined through the pipette method, sand content through sieving and silt content through the difference between clay and sand fractions (Gee and Bauder, 1986). Water dispersible clay was determined using the same method adopted for particle-size distribution, but without the chemical dispersant.
Soil particle density (ρp) was determined through the volumetric flask method (Blake and Hartge, 1986a) and soil bulk density (ρs) was determined using undisturbed soil samples, collected in cylinders of known volume, and dried at 105 °C until constant mass (Blake and Hartge, 1986b). Soil porosity was obtained through PT = [1- (ρs/ρp)], where PT is the total porosity (m3 m-3), and ρp and ρs are soil particle and bulk densities (Mg m-3
). Microporosity (pores with diameter ≤50 µm) was determined using Haines’ funnel, through the application of a 6-kPa tension on the samples, until the water occupying these pores was drained (Danielson and Sutherland, 1986). Macroporosity was calculated by the difference between total porosity and volume of pores with a diameter smaller than 50 µm.
In the determination of the soil water retention curve, the saturation water content was considered equal to soil total porosity (PT); Haines’ funnel was used for low matric potentials (-2, -4, -6, -8 and -10 kPa) and Richards’ porous plate apparatus (Klute, 1986) was used for the others (-33, -100, -300, -700, -1000 and -1500 kPa). The data were fitted to the mathematical model proposed by van Genuchten (1980), equation 1:
θ = θr +
θs – θr
[1 + (α|φm|)
n
]m Eq. 1
where θr and θs are, respectively, residual and saturation water contents (m 3 m-3),
φm soil water matric potential (kPa), α is a scaling factor for φm, and m and n are parameters related to the curve shape. The software SWRC, version 2.0, was used, fixing θr and θs at the soil water contents measured in the laboratory at saturation
Table 2. Chemical properties of the pure bovine biofertilizer (100 %) and the estimated doses, after diluted in water, in the different concentrations
Sample N P K Ca Mg S Fe Zn Cu Mn B Na EC C C/N pH
g L-1 mg L-1 dS m-1 %
100 % 0.78 0.73 1.19 0.59 0.28 0.21 73.04 5.88 2.04 9.32 1.62 175 7.05 1.08 13.8 7.78
20 % 0.16 0.15 0.25 0.12 0.06 0.06 14.60 1.17 0.40 1.86 0.32 35 1.41 0.216 13.5 8.05
40 % 0.31 0.29 0.49 0.24 0.11 0.08 29.21 2.35 0.82 3.72 0.48 70 2.82 0.432 13.9 8.29
60 % 0.47 0.44 0.68 0.35 0.17 0.13 43.82 3.52 1.22 5.59 0.97 105 4.23 0.648 13.8 8.14
and at the tension of 1,500 kPa, respectively. The parameters α, m and n were fitted through the Newton-Raphson iterative method, with no dependence between m and n (Dourado Neto et al., 2000).
Intrinsic soil air permeability was determined through the decreasing pressure method (Kirkham, 1946; Neves et al., 2007; Silva et al., 2009; Silveira et al., 2011). A volume of air, corresponding to the pressure of 1 kPa in the reservoir, was passed through the volumetric ring containing an undisturbed soil sample, equilibrated at tensions of 2, 6, 10, 33 and 100 kPa. During the procedure, the decrease in pressure over time was measured, until the equilibrium with the atmospheric pressure, using the software PermeAr, v.1.0 (Silveira et al., 2011). Soil air permeability coefficient (Kair) was determined using equation 2:
Kair =
2.3 x L x η x V
A x Patm
x |S| Eq. 2
where Kair is the soil air permeability coefficient (m2), V is the air volume passing through the cylinder (m3), η
is the dynamic air viscosity (Pa.s), L is the height of the volumetric ring (m), A is the cross-section of the soil sample (m2), P
atm is the atmospheric air pressure (Pa) and S is the angular coefficient of the linear regression of the pressure (ln of pressure) over time.
To obtain the pore continuity index, the values of intrinsic soil air permeability were related to the values of aeration porosity (εair) through the Kozeny-Carman equation, similarly to Ahuja et al. (1984), according to equation 3:
Kair = Mεair
N Eq. 3
where M (intercept) and N (slope) are empirical constants. The exponent N, according to the authors, is considered a pore continuity index, since it reflects the increase in Kair with the increase in εair (aeration porosity) or a decrease in pore tortuosity, and the increase in superficial area with the increase in the fraction of pores available to air flow. Aeration porosity (εair) was calculated by the difference between total porosity and the volumetric water content at each matric potential established. Equation 3, adjusted to the logarithmic form, results in equation 4:
log Kair = log M + N log εair Eq. 4
where M and N values are then estimated from the linear regression of the relationship of log εair versus log Kair. The intercept of the line with the abscissa, in the graph relating air permeability with aeration porosity in the axis of log εair, can be used as a measure of the blocked porosity (εb), which corresponds to the εair value below which soil air flow stops due to the discontinuity in the aeration pore network. From equation 4, εb is expressed by equation 5:
εb = 10
(–log M)/N Eq. 5
Another index, K1, was suggested by Groenevelt et al. (1984) to determine whether differences in Kair can be attributed only to differences in εair or if they can be partially attributed to other geometric aspects of the air-filled porous space, such as pore-size distribution, tortuosity and continuity. It is obtained through equation 6:
Kair
K1 =
εair Eq. 6
Thus, the average pore length for this range (d), approximately 30 µm, corresponded to the matric potential of -10 kPa.
3 d(mm) =
Φ(cm) Eq. 7
Then, the volume was calculated, which corresponds to the water displaced between the matric potentials of – 8 and -12 kPa. Pore length (Lp) was then calculated according to equation 8:
Vss
Lp = Ap Eq. 8
where Lp is the average pore length, mm; Vss is the volume of the soil solution (mm3) collected between the two matric potentials (kPa); and Ap is the average pore area, mm2(π r
m
2, where r
m is the average pore radius, mm, for the interval between the two matric potentials considered).
Statistical analysis was performed using the software Assistat, version 7.6 (beta) (Silva, 2013). The experimental data were analyzed in a completely randomized design, in a split-plot scheme, 5 × 3 × 4 (five treatments – under fig cultivation with the application of 20, 40 and 60 % of the biofertilizer through irrigation, a control treatment without biofertilizer and an additional treatment – soil under natural vegetation; three soil layers 0.0-0.1, 0.1-0.2 and 0.2-0.3 m; and four replicates). The Kolmogorov-Smirnov test, at 5 % of probability, was applied to verify data normality.
Since the experiment had two control treatments, one as a reference for biofertilizer application and another as a reference for soil cultivation, the F test was used for variance analysis and Dunnett’s test at 5 % probability was used for means comparison, between means of the other treatments and the scenario of soil under secondary native forest, considering five treatments and four replicates.
RESULTS AND DISCUSSION
Soil air permeability
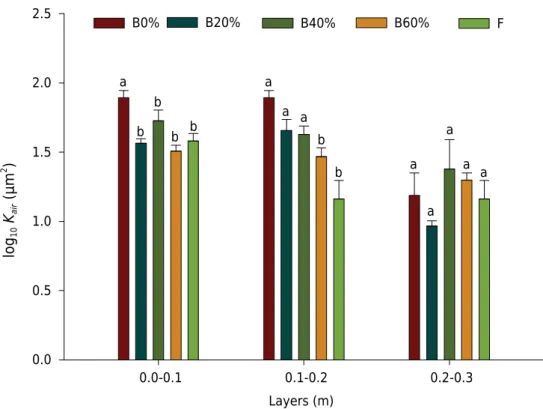
The statistical analysis for intrinsic soil air permeability (Kair), at the tension adopted by Alencar et al. (2015) to define the field capacity, 10 kPa, revealed significant difference between treatments in the layer of 0.0-0.1 m (Figure 1), and the soil under fig cultivation without biofertilizer application had greater area available to gas flow compared with the native forest.
An important, particular contribution of soil air permeability comes from wetting and drying cycles caused by fertigation, which participate in the genesis of stable aggregates, creating pores between aggregates, thus increasing the area for gas flow in the fertigated treatments (Sartori et al., 1985; Pagliai et al., 1987; Dalal and Bridge, 1996; Costa et al., 2014). The formation of pores between soil aggregates occurs as a result of physical forces. In this context, successive fertigation cycles become important factors, because they change the water regime in the soil, altering and/or intensifying natural processes, such as the reorganization of particles and changes in the porous system, which induce soil aggregation (Dalal and Bridge, 1996; Costa et al., 2014).
soil through the 20, 40 and 60 % biofertilizer, at the end of the experiment, was approximately equal to 0.182 kg, 0.364 kg and 0.546 kg per m² of soil, respectively, which caused higher microporosity values for treatments with biofertilizer application (information on the porosity can be found in Alencar et al., 2015). Thus, the increase in the values of microporosity is an indication of obstruction or reduction in pore diameter by organic residues.
The pore-size distribution analysis using the soil water retention curve is an important tool to be used in monitoring the addition of biofertilizer. According to the results obtained by Alencar et al. (2015), the effect of biofertilizer on the obstruction/reduction of diameter of soil pores was evident.
In the 0.1-0.2 m layer (Figure 1), the effect of pore obstruction by residues from the biofertilizer was identified in smaller scale, being noticeable through the Dunnett’s test at 5 % probability only in the treatment with higher amounts of biofertilizer applied to the soil. For the 0.2-0.3 m layer, there was no significant difference between the scenarios of cultivated soil and native forest, evidencing that pore obstruction or reduction in diameter must occur predominantly in the layers closest to where the biofertilizer is applied.
At the end of the experiment, the values of organic carbon obtained in the systems with native forest, B0%, B20%, B40% and B60% were 12.4, 15.7, 13.4, 15.0 and 14.8 g kg-1 (0.0-0.1 m); 7.2, 11.6, 11.5, 12.3 and 10.3 g kg-1 (0.1-0.2 m); and 6.0, 10.3, 10.2, 10.1 and 9.6 g kg-1, respectively (Alencar et al., 2015). The similar values between treatments are due to the low amounts of C in the composition of the biofertilizer, because of the release of CO2 and CH4 in the biodigestion process (Medeiros and Lopes, 2006), the low C:N ratio, which favors rapid mineralization of the organic matter added to the soil (Giacomini et al., 2015), and the environmental conditions of the semiarid region, which do not favor a high supply of plant biomass in the native forest area (Alencar et al., 2015).
Figure 1. Intrinsic soil air permeability, with the errors of the means, for areas under fig cultivation and secondary native forest (B0% – Control; B20% – 20 % Biofertilizer; B40% – 40 % Biofertilizer; B60% – 60 % Biofertilizer; F – Native forest). Means followed by the same letter in the layer do not differ by Dunnett’s test at 5 % probability.
B0% B20% B40% B60% F
Layers (m)
0.0-0.1 0.1-0.2 0.2-0.3
0.0 0.5 1.0 1.5 2.0 2.5
a
b b
b
a
a a b
b a
a a
a a b
log
10
Kair
(μm
As previously mentioned, close to the application site, there is the effect of wetting and drying cycles, which contribute to the packing of particles, forming less porous intra-aggregate arrangements. In addition, Dexter (1988) claims that soil porosity increases from micro- to macroaggregates, because, besides the intra-aggregate porosity, there is a contribution from inter-aggregate pores. In the conditions of this study, this claim does not apply, because inter-aggregate pores were also blocked by the deposition of organic sediments from the bovine biofertilizer. Considering the reduction/obstruction of pores due to the addition of biofertilizer, it should be pointed out that the quality of the porous system for agricultural use was not compromised, since the functions of the soil with respect to the flow of water and gases remained satisfactory. In spite of that, it is recommended, as a management practice, to avoid coarse residues in the biofertilizer before its application.
Comparing cultivated areas with the native forest, cultivation did not degrade the pore network, since Kair values, depending on the treatments, are statistically equal to or higher than those found for the native forest area. It should be pointed out that management practices adopted in cultivated soils change the porous space, influencing the gas exchange environment in the root zone (Braunack and Dexter, 1989; Tormena et al., 1998; Rodrigues et al., 2011). Freire (2012) and Alves (2013) also found that the air permeability of Cambisols at the Apodi Plateau was improved when the soil was subjected to cultivation.
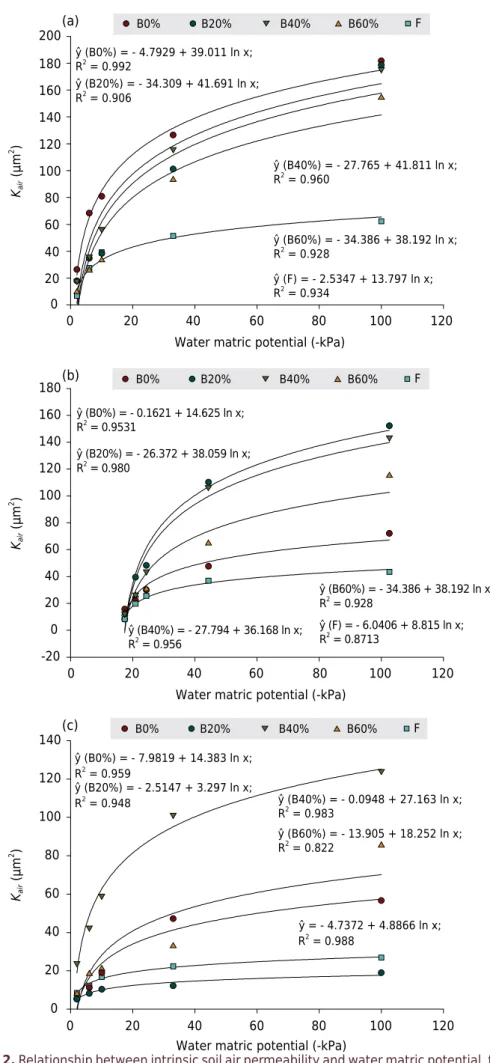
Thus, soil air permeability provides integrated knowledge on the effects of changes caused by cultivation in the internal structure of the soil, pore geometry, geometric variables (pore-size distribution, total porosity) and functional properties or processes, resulting in differences between treatments (Mentges et al., 2016; Reichert et al., 2016). Soil Kair had positive correlation with the logarithmic fit in relation to the water matric potentials for all management scenarios studied (Figure 2). Thus, the application of higher water matric potentials allows more water to drain from the soil, resulting in an increase of the area available to gas flow, which confirms that intrinsic soil air permeability (Kair) has an inverse relationship with soil water content (Silva et al., 2009), i.e., as the soil dries, the pores previously occupied by water become natural pathways for air flow. Although the relationship is inverse, the fact that it is logarithmic indicates that the drying of the soil does not cause an increase of air permeability in the same proportion with which water tension varies, i.e., Kair increments are increasingly smaller for the same variation in soil water tension.
For all studied tensions, Kair values were higher than 1 μm 2 (log K
air = 0), which according to McQueen and Shepherd (2002) is considered critical to define non-functional porosity, the one where pores responsible for aeration are blocked and do not participate in the convective air transport. Such condition was not found in the evaluated management scenarios, in any of the applied tensions from 2 to 100 kPa.
The behavior of the relationship between soil air permeability (Kair) and the aeration porosity (ɛair) can be seen in Figure 3. Positive correlation and good fit (with r of at least 0.92 for the analyzed scenarios) were found between the variables for all studied systems and layers. The treatments with 20 %, 60 % and 40 % biofertilizer in the layers of 0.0-0.1 m, 0.1-0.2 m and 0.2-0.3 m, respectively, have higher Kair values for the ɛair considered critical to plant development, reported by Silva et al. (1994) as ɛair = 0.1 m3 m-3 or log ɛair = -1.0 m
3 m-3. It should be pointed out that, unlike the situation discussed
Figure 2. Relationship between intrinsic soil air permeability and water matric potential, for areas
under fig cultivation and secondary native forest in the layers of 0.0-0.1 m (a), 0.1-0.2 m (b) and
0.2-0.3 m (c).
Water matric potential (-kPa)
0 20 40 60 80 100 120
0 20 40 60 80 100 120 140 -20 0 20 40 60 80 100 120 140 160 180 0 20 40 60 80 100 120 140 160 180 200 (c)
ŷ (B0%) = - 4.7929 + 39.011 ln x; R2
= 0.992
ŷ (B20%) = - 34.309 + 41.691 ln x; R2 = 0.906
ŷ (B40%) = - 27.765 + 41.811 ln x; R2
= 0.960
ŷ (B60%) = - 34.386 + 38.192 ln x; R2
= 0.928
ŷ (F) = - 2.5347 + 13.797 ln x; R2
= 0.934
ŷ (B0%) = - 0.1621 + 14.625 ln x; R2
= 0.9531
ŷ (B20%) = - 26.372 + 38.059 ln x; R2
= 0.980
ŷ (B60%) = - 34.386 + 38.192 ln x; R2
= 0.928
ŷ (B40%) = - 27.794 + 36.168 ln x; R2
= 0.956
ŷ (F) = - 6.0406 + 8.815 ln x; R2
= 0.8713
ŷ (B0%) = - 7.9819 + 14.383 ln x; R2
= 0.959
ŷ (B20%) = - 2.5147 + 3.297 ln x; R2
= 0.948 ŷ (B40%) = - 0.0948 + 27.163 ln x; R2
= 0.983
ŷ (B60%) = - 13.905 + 18.252 ln x; R2
= 0.822
ŷ = - 4.7372 + 4.8866 ln x; R2 = 0.988 Kair (μm 2 ) Kair (μm 2 ) Kair (μm 2 )
Water matric potential (-kPa)
0 20 40 60 80 100 120
Water matric potential (-kPa)
0 20 40 60 80 100 120
(b)
(a) B0% B20% B60%B40% F
B0% B20% B60%B40% F
Figure 3. Logarithmic relationship between soil air permeability (Kair) and aeration porosity (ɛair) for
areas under fig cultivation and secondary native forest in the layers of 0.0-0.1 m (a), 0.1-0.2 m (b)
and 0.2-0.3 m (c).
-2.0 -1.8 -1.6 -1.4 -1.2 -1.0 -0.8 -0.6 -0.4
0.5 1.0 1.5 2.0 2.5
B0% B20% B60%B40% F
ŷ (B0%) = 3.8333 + 2.3213x; R2
= 0.999
ŷ (B20%) = 3.1054 + 1.2104x; R2
= 0.872
ŷ (B40%) = 3.5278 + 1.9326x; R2
= 0.955
ŷ (B60%) = 4.2835 + 2.6819x; R2
= 0.998
ŷ (F) = 2.7998 + 1.6689x; R2
= 0.996
ŷ (B0%) = 2.6429 + 1.2869x; R2
= 0.853
ŷ (B20%) = 3.9017 + 2.4237x; R2
= 0.995
ŷ (B40%) = 3.549 + 1.7802x; R2
= 0.964
ŷ (B60%) = 2.7809 + 1.003x; R2
= 0.8737
ŷ (F) = 2.283 + 1.057x; R2
= 0.989
ŷ (B0%) = 3.358 + 2.1595x; R2
= 0.979
ŷ (B20%) = 1.8896 + 0.8109x; R2
= 0.957
ŷ (B40%) = 2.882 + 1.0075x; R2
= 0.990
ŷ (B60%) = 2.6767 + 1.2085x; R2
= 0.8711
ŷ (F) = 1.6634 + 0.4051x; R2
= 0.8746
log
10
Kair
(μm
2 )
log εair (m 3 m-3 ) log 10 Kair (μm 2 )l og 10 Kair (μm 2 )
-2.0 -1.8 -1.6 -1.4 -1.2 -1.0 -0.8 -0.6 -0.4
0.8 1.2 1.6 2.0 2.6
log εair (m 3
m-3
)
-2.0 -1.8 -1.6 -1.4 -1.2 -1.0 -0.8 -0.6 -0.4
0.5 1.0 1.5 2.0 2.5
log εair (m 3 m-3 ) 0.0 (c) (b) (a) 2.4 2.2 1.8 1.4 1.0
B0% B20% B60%B40% F
Pore continuity indices (K1, N) and pore length (Lp)
The K1 indicate that, in general, the cultivated areas have higher pore continuity compared with the secondary native forest for the analyzed layers, similarly to that which was found for the parameter N (Table 3). It is noteworthy that, although the cultivated areas have increased the amount of soil micropores, the connectivity between pores was improved, which according to Freire (2012) is essential for an adequate gas exchange between soil and atmosphere.
N values (Table 4) indicated that the cultivated areas in general have pores more efficient for air flow compared with the native forest area, which according to Streck (2007) is of great importance to adequate gas exchange. Here, it is important to point out that the main soil aeration mechanism is diffusion, a kinetic-molecular phenomenon
Table 3. Pore continuity index (K1) for areas under fig cultivation and secondary native forest in the layers of 0.0-0.1 m, 0.1-0.2 m and 0.2-0.3 m, for the tension of 10 kPa
Use and management system
0.0-0.1 m 0.1-0.2 m 0.2-0.3 m
log10 K1 (µm 2
)
Biofertilizer 0 % 2.74 2.33 2.29
Biofertilizer 20 % 2.69 2.57 2.09
Biofertilizer 40 % 2.65 2.70 2.88
Biofertilizer 60 % 2.55 2.66 2.39
Forest 2.33 2.22 2.25
Table 4. Parameters of the regression equation, log Kair = log M + N log ɛair, and blocked porosity
(ɛb) for areas under fig cultivation and secondary native forest, in the layers of 0.0-0.1 m, 0.1-0.2 m
and 0.2-0.3 m Use and management system
Layer log M N R² ɛb
m µm² %
Biofertilizer 0 %
0.0-0.1 3.83 2.32 0.99 0.1
0.1-0.2 2.64 1.29 0.85 0.8
0.2-0.3 3.36 2.16 0.98 2.7
Biofertilizer 20 %
0.0-0.1 3.10 1.21 0.88 0.2
0.1-0.2 3.90 2.42 0.99 2.4
0.2-0.3 1.90 0.81 0.96 0.4
Biofertilizer 40 %
0.0-0.1 3.53 1.93 0.95 1.5
0.1-0.2 3.55 1.78 0.96 1.0
0.2-0.3 2.88 1.01 0.99 0.1
Biofertilizer 60 %
0.0-0.1 4.28 2.68 0.99 2.5
0.1-0.2 2.78 1.00 0.87 0.2
0.2-0.3 2.68 1.21 0.87 0.6
Forest
0.0-0.1 2.80 1.67 0.99 2.1
0.1-0.2 2.28 1.06 0.99 0.7
that does not necessarily depend on pore size, but on the connection between pores (Braunack and Dexter, 1989). Higher N values indicate soils with complex structure (Schjønning et al., 1999). In general, N values supported the results found by other indicators with respect to soil porosity (Kair, K1 at the tension of 10 kPa), that pore network quality is notably better in the superficial soil layer of all studied systems, despite comments on the possibility of obstruction/reduction of pore diameter in cases where biofertilizer was applied.
The cultivated systems had higher volumes of blocked pores (ɛb) compared with the native forest, thus indicating that areas under fig cultivation have higher volume of non-functional pores, which are not available to gas flow. The treatments with the increasing doses of biofertilizer, as previously discussed, probably blocked soil pores in the superficial layers. In the case of soil under fig cultivation without biofertilizer application, soil disturbance caused clay particles to migrate and be deposited in the subsurface layer, which improved pore connectivity in the superficial layers. It is important to point out that the blocked porosity does not participate in the convective transport of water and air in the soil, which makes it independent of pore continuity, calculated considering those pores that effectively participate in the flow of water and gases in the soil.
Although most studies in the literature consider the correlation between organic C and porosity as direct, the increase in C is often not sufficient to mitigate the negative effects of anthropic activity, especially in the superficial soil layer. For instance, Mota et al. (2014) observed a direct correlation between organic C content and soil density, which at first contradicts the literature (Stock and Downes, 2008; Cunha et al., 2011), showing that the anthropic factor inhibited the role that carbon must play in soil resilience (Gregory et al., 2009). In this study, the addition of small-size particles, and not particularly carbon, was the main factor for the obstruction of part of the soil pores.
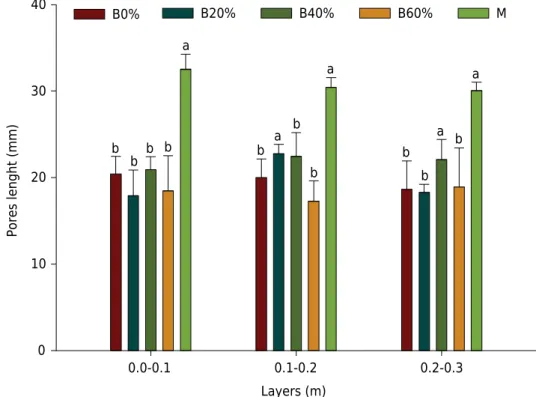
As for the average pore length (Lp) at the tension range from 8 to 12 kPa (Figure 4), in general, longer pores were observed in the soil under secondary native forest in
Figure 4. Average pore length, with the standard deviations from the mean, for areas
under fig cultivation and secondary native forest. (B0% – Control; B20% – 20 % Biofertilizer; B40% – 40 % Biofertilizer; B60% – 60 % Biofertilizer; F – Native forest). Means followed by the same letter in the layer do not differ by Dunnett’s test at 5 % probability. Tension of 10 kPa.
Pores lenght (mm)
0 10 20 30 40
B20% B40% B60% M
B0%
a
b
b b b
a
a b
b b
a
a b b
b
Layers (m)
superficial and subsurface soil layers. The lower pore length in cultivated areas is related to soil disturbance. Although the treatment with native forest has longer pores, the pore continuity indices (K1 and N) indicated that these pores are not connected or, at least, have high tortuosity. Thus, the index Lp did not prove to be a good indicator in the definition of soil air permeability. It should be pointed out that, although Lp had this limitation, it proved to be sensitive to variations caused by the management practices imposed on the soil. The average pore length was used only in the range from -8 kPa to -12 kPa, because the mean value approximately corresponds to the field capacity condition established for the least limiting water range, -10 kPa (Silva et al., 1994).
The comprehension on the dynamics of soil structure for this experiment was based on intensity-type properties, i.e., those that consider soil structural organization, dynamic aspects and processes that vary in space and time (Reichert et al., 2016). Thus, the intensity properties contributed to a better understanding of the alterations caused on soil structure by the treatments.
Agricultural systems are open from the thermodynamic perspective and tend to a stationary state, i.e., in dynamic equilibrium with the lowest production of entropy. From this point of view, the tendency is to converge to the improvement in structure, porous space and functions of the soil (Addiscott, 1995). Therefore, the minimum production of entropy leads the soil-plant system to self-organization and, consequently, to environmental sustainability (Vezzani and Mielniczuk, 2009).
The qualitative aspect of soil structure depends on the maintenance of an adequate balance between ordering and dissipation processes (Reichert et al., 2016). Therefore, from the thermodynamic point of view, the cultivated areas are found in situations very close to dynamic equilibrium, in conditions similar to or improved in relation to the secondary native forest. For the soil-plant system, according to Addiscott (1995), the steady state is characterized when there is a reduction of entropy due to the formation of structural units, formation of organic material, normal flow of water and gases, factors identified in the areas under cultivation, which, in combination, contribute to the development of the soil profile.
CONCLUSIONS
Compared to the native forest, pore network quality is improved, if not maintained, when soil is cultivated under the conditions described in this experiment.
In the conditions of cultivation, the application of bovine biofertilizer, which supply sediments that block or reduce the size of pores, did not improve soil air permeability.
The cases in which soil porosity was worsened due to the applied treatments (Biofertilizer 20 %, Biofertilizer 40 % and Biofertilizer 60 % for the layer of 0.0-0.1 m and Biofertilizer 60 % for 0.1-0.2 m), although not considered critical to plant development, indicate the need for the adoption of specific management practices (for instance, avoid coarse residues in the biofertilizer before its application) to avoid soil degradation.
ACKNOWLEDGEMENTS
To the National Council for Scientific and Technological Development (CNPq), and to the Foundation for Scientific and Technological Development of the Ceará State.
REFERENCES
Ahuja LR, Naney JW, Green RE, Nielsen DR. Macroporosity to characterize spatial variability of hydraulic conductivity and effects of land management. Soil Sci Soc Am J. 1984;48:699-702. doi:10.2136/sssaj1984.03615995004800040001x
Alencar TL, Chaves AF, Santos CLA, Assis Júnior RN, Mota JCA. Atributos físicos de um
Cambissolo cultivado e tratado com biofertilizante na Chapada do Apodi, Ceará. Rev Bras Cienc Solo. 2015;39:1-13. doi:10.1590/01000683rbcs20140437
Alves CVO. Índice S relativo como avaliador da qualidade física e sua relação com atributos da fração porosa de um Cambissolo [dissertação]. Fortaleza: Universidade Federal do Ceará; 2013. Ball BC, Watson CA, Baddeley JA. Soil physical fertility, soil structure and rooting conditions after ploughing organically managed grass/clover swards. Soil Use Manage. 2007;23:20-7. doi:10.1111/j.1475-2743.2006.00059.x
Blake GR, Hartge KH. Bulk density. In: Klute A, editor. Methods of soil analysis. 2nd
ed. Madison: American Society of Agronomy; 1986a. Pt 1. p.363-75. (Agronomy monography, 9).
Blake GR, Hartge KH. Particle density. In: Klute A, editor. Methods of soil analysis. 2nd
ed. Madison: American Society of Agronomy; 1986b. Pt 1. p.377-82. (Agronomy monography, 9). Blackwell PS, Ringrose-Voase AJ, Jayawardane NS, Olsson KA, Mckenzie DC, Mason WK. The use of air-filled porosity and intrinsic permeability to air to characterize structure of macropore space and satured hydraulic conductivity of clay soils. Soil Sci. 1990;41:215-28. doi:10.1111/j.1365-2389.1990.tb00058.x
Brasil. Ministério da Agricultura. Levantamento Exploratório – Reconhecimento de solos do Estado do Ceará. Recife: 1973. (Boletim técnico, 28).
Braunack WA, Dexter AR. Soil aggregation in the seedbed: a review. II. Effect of aggregate sizes on plant growth. Soil Till Res. 1989;14:281-98. doi:10.1111/j.1365-2389.1990.tb00058.x
Cavalieri KMV, Silva AP, Tormena CA, Leão TP, Dexter AR, Håkansson I. Long-term effects of no-tillage on dynamic soil physical properties in a Rhodic Ferrasol in Paraná, Brazil. Soil Till Res. 2009;103:158-64. doi:10.1016/j.still.2008.10.014
Costa PA, Mota JCA, Romero, RE, Freire AG, Ferreira TO. Changes in soil pore network in response to twenty-three years of irrigation in a tropical semiarid pasture from northeast Brazil. Soil Till Res. 2014;137:23-32. doi:10.1016/j.still.2013.11.004
Cunha EQ, Stone LF, Ferreira EPB, Didonet AD, Moreira JAA, Leandro WM. Sistemas de preparo do solo e culturas de cobertura na produção orgânica de feijão e milho: I – Atributos físicos do solo. Rev Bras Cienc Solo. 2011;35:589-602. doi:10.1590/S0100-06832011000200029
Danielson RE, Sutherland PL. Porosity. In: Klute A, editor. Methods of soil analysis, physical and mineralogical methods. Madison: American Society of Agronomy; 1986. Pt 1. p.443-61. Dalal RC, Bridge BJ. Aggregation and organic matter storage in sub-humid and semi-arid soils. In: Carter MR, Stewart BA, editors. Structure and organic matter storage in agricultural soils. Boca Raton: Lewis Publishers; 1996. p.263-307.
Dexter AR. Advances in characterization of soil structure. Soil Till Res. 1988;11:199-238. doi:10.1016/0167-1987(88)90002-5
Dourado Neto D, Nielsen DR, Hopmans JW, Reichardt K, Bacchi OOS. Software to model soil water retention curves (SWRC, version 2.00). Sci Agric. 2000;57:191-2. doi:10.1590/S0103-90162000000100031
Fish AN, Koppi AJ. The use of a simple field air permeability as a rapid indicator of functional soil pore space. Geoderma. 1994;63:255-64. doi:10.1016/0016-7061(94)90067-1
Freire AG. Índices de qualidade física para um Cambissolo em sistemas de manejo [dissertação]. Fortaleza: Universidade Federal do Ceará; 2012.
Gee GW, Bauder JW. Particle-size analysis. In: Klute A, editor. Methods of soil analysis. 2nd
Gregory AS, Watts CW, Griffiths BS, Hallett PD, Kuan HL, Whitmore AP. The effect of long-term soil management on the physical and biological resilience of a range of arable and grassland soils in England. Geoderma. 2009;153:172-85. doi:10.1016/j.geoderma.2009.08.002
Groenevelt PH, Kay BD, Grant CD. Physical assessment of a soil with respect to rooting potential. Geoderma. 1984;34:101-14. doi:10.1016/0016-7061(84)90016-8
Kitamura AE, Alves MC, Suzuki LGAS, Paz Gonzalez A. Recuperação de um solo degradado com a aplicação de adubos verdes e lodo de esgoto. Rev Bras Cienc Solo. 2008;32:405-16. doi:10.1590/S0100-06832008000100038
Kirkham D. Field method for determination of air permeability of soil in its undisturbed state. Soil Sci Soc Am Proc. 1946;11:93-9.
Klute A. Water retention: Laboratory methods. In: Klute A, editor. Methods of soil analysis, physical and mineralogical methods. Madison: American Society of Agronomy; 1986. Pt 1. p.635-62. (Agronomy monography, 9).
Lipiec J, Kús J, Słowinska-Jurkiewicz A, Nosalewicz A. Soil porosity and water infiltration as influenced by tillage methods. Soil Till Res. 2006;89:210-20. doi:10.1016/j.still.2005.07.012 McQueen DJ, Shepherd TG. Physical changes and compaction sensitivity of a fine textured, poorly drained soil (Typic Endoaquept) under varying durations of cropping, Manawatu Region, New Zealand. Soil Till Res. 2002;25:217-30. doi:10.1016/S0167-1987(01)00231-8
Medeiros MB, Lopes JS. Biofertilizantes líquidos e sustentabilidade agrícola. Bahia Agríc. 2006;7:24-6.
Mentges MI, Reichert JM, Rodrigues MF, Awe GO, Mentges LR. Capacity and intensity soil aeration properties affected by granulometry, moisture, and structure in no-tillage soils. Geoderma. 2016;263:47-59. doi:10.1016/j.geoderma.2015.08.042
Mota JCA, Alves CVO, Freire AG, Assis Júnior RN. Uni- and multivariate analyses of soil physical quality indicators of a Cambisol from Apodi Plateau – CE, Brazil. Soil Till Res. 2014;140:66-73. doi:10.1016/j.still.2014.02.004
Neves CMNN, Silva MLN, Curi N, Cardoso EL, Macedo RLG, Ferreira, MM, Souza FS. Atributos indicadores da qualidade do solo em sistema agrossilvopastoril no noroeste do Estado de Minas Gerais. Sci For. 2007;74:45-53.
Pagliai M, La Marca M, Lucamante G. Changes in soil porosity in remolded soils treated with poultry manure. Soil Sci. 1987;144:128-40. doi:10.1097/00010694-198708000-00007 Reichert JM, Rosac VT, Vogelmann ES, Rosa DP, Horn, R, Reinert, DJ, Sattler A, Denardin JE. Conceptual framework for capacity and intensity physical soil properties affected by short and long-term (14 years) continuous no-tillage and controlled traffic. Soil Till Res. 2016;158:123-36. doi:10.1016/j.still.2015.11.010
Rodrigues S, Silva AP, Giarola NFB, Rosa JA. Permeabilidade ao ar em Latossolo Vermelho sob diferentes sistemas de manejo. Rev Bras Cienc Solo. 2011;35:105-14. doi:10.1590/S0100-06832011000100010
Santos HG, Jacomine P KT, Anjos LHC, Oliveira VAVL, Francisco J, Coelho MR, Almeida JA, Cunha TJF, Oliveira JB. Sistema brasileiro de classificação de solos. 3ª ed. Brasília, DF: Embrapa; 2013 Sartori G, Ferrari GA, Pagliai M. Changes in soil porosity and surface shrinkage
in a remolded, saline clay soil treated with compost. Soil Sci. 1985;139:523-30. doi:10.1097/00010694-198506000-00008
Schjønning P, Thomsen IK, Møberg JP, Jonge H, Kristensen K, Christensen BT. Turnover of organic matter in differently textured soils. I. Physical characteristics of structurally disturbed and intact soils. Geoderma. 1999;89:177-98. doi:10.1016/S0016-7061(98)00083-4
Silva AP, Kay B D, Perfect E. Characterization of the least limiting water range of soils. Soil Sci Soc Am J. 1994;58:1775-81.
Silva FAS. Assistat – Assistência estatística. Versão 7.6 (beta). Campina Grande: UFCG; 2013. Silveira LR, Brito AS, Mota JCA, Moraes SO, Libardi PL. Sistema de aquisição de dados para equipamento de medida da permeabilidade intrínseca do solo ao ar. Rev Bras Cienc Solo. 2011;35:429-36. doi:10.1590/S0100-06832011000200012
Soil Survey Staff. Keys to soil taxonomy. 12th
ed. Washington, DC: USDA-Natural Resources Conservation Service; 2014.
Stock O, Downes NK. Effects of additions of organic matter on the penetration
resistance of glacial till for the entire water tension range. Soil Till Res. 2008;99:191-201. doi:10.1016/j.still.2008.02.002
Streck CA. Índice S e fluxo de água e ar em solos do Sul do Brasil [tese]. Santa Maria: Universidade Federal de Santa Maria; 2007.
Tormena CA, Silva AP, Libardi PL. Caracterização do intervalo hídrico ótimo de um Latossolo Roxo sob plantio direto. Rev Bras Cienc Solo. 1998;22:573-81. doi:10.1590/S0100-06831998000400002
van Genuchten MT. A closed-form equation for predicting the hydraulic conductivity of unsaturated soils. Soil Sci Soc Am J. 1980;44:892-8. doi:10.2136/sssaj1980.03615995004400050002x