* Corresponding author: E-mail: [email protected]
Received: May 23, 2016 Approved: April 7, 2017
How to cite: Pereira JM, Segat JC, Baretta D, Vasconcellos RLF, Baretta CRDM, Cardoso EJBN. Soil macrofauna as a soil quality indicator in native and replanted Araucaria angustifolia
forests. Rev Bras Cienc Solo. 2017;41:e0160261.
https://doi.org/10.1590/18069657rbcs20160261
Copyright: This is an open-access article distributed under the terms of the Creative Commons Attribution License, which permits unrestricted use, distribution, and reproduction in any medium, provided that the original author and source are credited.
Soil Macrofauna as a Soil Quality
Indicator in Native and replanted
Araucaria angustifolia
Forests
Jamil de Morais Pereira(1)*
, Julia Corá Segat(2)
, Dilmar Baretta(2)
, Rafael Leandro de Figueiredo Vasconcellos(3)
, Carolina Riviera Duarte Maluche Baretta(4)
and Elke Jurandy Bran Nogueira Cardoso(3)
(1)
Instituto Federal de Educação, Ciência e Tecnologia do Sul de Minas, Campus Inconfidentes, Inconfidentes, Minas Gerais, Brasil.
(2)
Universidade do Estado de Santa Catarina, Centro de Educação Superior do Oeste, Chapecó, Santa Catarina, Brasil.
(3)
Escola Superior de Agricultura “Luiz de Queiroz”, Departamento de Ciência do Solo, Piracicaba, São Paulo, Brasil.
(4)
Universidade Comunitária da Região de Chapecó, Programa de Pós-Graduação em Ciências Ambientais, Chapecó, Santa Catarina, Brasil.
ABSTRACT: Studies on soil quality in Araucaria forests contribute to understanding changes in this ecosystem and serve as a tool in conserving its biodiversity. The aim of this study was to evaluate the potential of soil macrofauna in discriminating native and replanted Araucaria forests for selection of soil quality indicators. Native (NF) and replanted (RF) Araucaria angustifolia forests were evaluated in three regions of the state of São Paulo, representing three true replications. Fifteen soil samples were collected in each area for evaluation of the physical, chemical, and microbiological properties and the macrofauna through use of monolith excavation and the manual screening method [Tropical Soil Biology and Fertility (TSBF) method]. In addition, we evaluated the weight of the surface litter dry matter and the C, N, and S contents. The abundance of macrofauna was subjected to Principal Components Analysis (PCA) and the physical, chemical, and microbiological properties were used as explanatory environmental variables for changes in the soil community. These variables and the macrofaunal properties were applied in analyses of variance and in canonical discriminant analysis (CDA) to indicate the best properties for discrimination of the forests studied. The abundance of macrofaunal groups
was influenced by the state of conservation of the forest and by the sampling period; the
native forest and the summer season provided greater diversity of taxonomic groups. The richness of taxonomic groups was the property that most contributes to discriminating reforested areas from native forests. The Oligochaeta group was a prominent indicator of soil quality and/or environmental disruption in Araucaria forests. Soil moisture, total porosity, and S content in the surface litter were likewise variables that contributed to distinguishing the areas. The ecological indexes (diversity, dominance, and equitability) were not sensitive to the changes in macrofaunal properties in the forests studied.
Keywords: multivariate analysis, biodiversity, bioindicators.
INTRODUCTION
The species Araucaria angustifolia (Bert.) O. Kuntze is a gymnosperm predominant in the Mixed Ombrophilous Forest in the Atlantic Forest domain (Souza et al., 2015). Intense use of Araucaria because of the quality of its wood, and increasing economic activity resulted in reduction of these forests (Ribeiro et al., 2009). In the state of São Paulo, Araucaria forests are quite fragmented and cover a small territorial area, less than 4 % of their original area (Mantovani et al., 2004; Kronka et al., 2005), leading to a critical situation for conserving the biodiversity of this ecosystem (Baretta et al., 2007a; Ribeiro et al., 2009; Souza et al., 2015) and placing Araucaria angustifolia on the list of “critically endangered” species worldwide (Thomas, 2013).
Conservation of remaining Mixed Ombrophilous Forests in fully protected conservation areas and restoration of this ecosystem in already degraded areas is a promising alternative in preserving this species and associated biodiversity, both above and below the soil level (Cardoso and Vasconcellos, 2015). The soil under native and reforested
Araucaria forests in the state of São Paulo has high acidity and low exchangeable base and P contents, making the organic matter from decomposition of plant residues the main source of many nutrients for plants and the biological community (Carvalho et al., 2012; Pereira et al., 2013).
The soil biological community (mainly invertebrates), in the search for food and habitat,
brings significant changes in the physical, chemical, and biological properties of the soil,
although it too is regulated by climate, soil properties (soil structure and fertility), and the quality and amount of surface litter (Lavelle, 1996; Lavelle et al., 2006). The intensity of this regulation, together with the complex interaction between biotic and abiotic factors
of the soil, defines the support capacity of this soil. In this respect, maintaining native
Araucaria forests and improving areas in which it is replanted can ensure the sustainability and preservation of this ecosystem. Nevertheless, assessing soil quality is a complex task, which involves the use of indicators (Schloter et al., 2003; Cardoso et al., 2013).
In addition to the traditional physical and chemical properties (Schoenholtz et al., 2000; Baretta et al., 2008a; Pereira et al., 2013), biological (microbiological and macrofaunal)
soil indicators should be included so that, together, they can better reflect the processes
that act on soil quality (Bastida et al., 2008; Baretta et al., 2010; Cardoso et al., 2013;
Vasconcellos et al., 2013a). Soil invertebrates perform different functions in land
ecosystems and are represented by more than 20 taxonomic groups (Korasaki et al., 2013; Lavelle et al., 2014). In addition to their ecological function, soil invertebrates are also used as indicators of soil quality or of environmental disruptions because they are widely distributed and abundant, yet they are quite sensitive to the diverse human interventions made in the ecosystems (Baretta et al., 2010; Vasconcellos et al., 2013b; Segat et al., 2015).
Results from previous studies developed in native and replanted Araucaria forests show greater diversity and abundance of invertebrates associated with a more conserved forest, such as in the case of spider families (Baretta et al., 2007a), springtails (Baretta et al., 2008b), and earthworm species (Baretta et al., 2007b). A clear separation between the native forest, which was more conserved, and the replanted forests was observed in all these studies (Baretta et al., 2010). However, studies related only to soil quality in comparing preserved and degraded Araucaria forests could not be found.
Studies already published led to an understanding that soil macrofauna can also be used as a quality indicator in areas of native and replanted Araucaria forests. Thus, the aim of this study is to evaluate the potential of soil invertebrate macrofauna and of explanatory environmental variables in distinguishing native and replanted Araucaria
MATERIALS AND METHODS
Description of the study areas
The study was conducted in Mixed Ombrophilous Forest areas of the Atlantic Forest biome in the state of São Paulo (SP). Plots of 0.5-1.0 ha were selected in areas of native forest (NF) and replanted forest (RF) with Araucaria angustifolia in three regions of the state. The areas of each region were considered true replicates. Detailed information on
the physical-chemical properties of the soil and of the floristic composition of the areas
studied can be obtained in Santos et al. (2009), and Pereira et al. (2013).
The first location for sampling NF and RF was subdivided into area 1 for native forest
and area 2 for replanted forest (Pereira et al., 2013). The areas belong to the Bananal
Ecological Station in the Serra da Bocaina. In the first sample collection period, in the
winter (August), the mean temperature was 17 °C and rainfall was 40 mm. In the second period, in the summer (February), the mean temperature was 22 °C and the month of highest rainfall (January) registered more than 300 mm. In the NF area, there are 178 species of trees and bushes distributed in 46 families and 89 genera, according to Santos et al. (2009) and Pereira et al. (2013).
The second region studied (with area 3, NF) is in the Itaberá Ecological Station in the municipality of Itaberá, SP. Mean temperature in the winter was 17 °C and rainfall was 45 mm; in the summer, the mean temperature was 25 °C and the highest rainfall in January
was 420 mm. The detailed floristic composition of this area can be found in Santos and
Ivanauskas (2010) and the location and soil properties in Pereira et al. (2013). In this same region (with area 4, RF) is the Itapeva Experimental Station in the municipality of Itapeva, SP, that has been in replanted forest for 45 years, with predominance of Araucaria and understory species. More detailed descriptions regarding location (latitude, longitude, and altitude) and soil properties can be found in Pereira et al. (2013).
The third region is in the Alto Ribeira State Tourist Park (Parque Estadual Turístico do Alto Ribeira) (with area 5, NF) in the municipality of Barra do Chapéu and (with area 6, RF) in the municipality of Iporanga. In the winter sampling period, April was the driest month (<50 mm) and June was the coldest month (mean of 17 °C), whereas in the summer, the rainiest month was January (more than 400 mm) and mean temperature was 24 °C.
Details regarding flora and soil can be found in Souza (2008) and Pereira et al. (2013).
The climate in all these regions is humid mesothermal, according to the Köppen’s climate
classification system. Information on the physical and chemical properties can be found
in Pereira et al. (2013). Each forest was represented by three true replications and, in each one, 15 soil samples were collected at random for evaluation of soil macrofauna and physical-chemical and microbiological properties.
Evaluation of soil macrofauna
The Tropical Soil Biology and Fertility (TSBF) method was used for evaluation of soil macrofauna (Anderson and Ingram, 1993). Samples were collected in the winter (August) and in the summer (February). A total of 15 soil monoliths were collected per area (0.25 × 0.25 m) at the depth of 0.00-0.20 m in each sample collection period (Baretta et al., 2007a). Before removing the soil monolith, the surface litter was sampled in the same area. The invertebrates were separated from the surface litter and from the soil and
identified in taxonomic groups with the aid of a stereoscopic microscope. After this
separation, the abundance, richness, Shannon’s diversity index, Simpson’s dominance index, and Pielou’s evenness index were calculated (Odum, 1983).
For determination of physical, chemical, and microbiological properties, the soil was
sampled with the aid of an auger at the depth of 0.00-0.20 m, and five simple samples
Dry matter, C, N, and S of the surface litter
The dry matter of the surface litter was determined (55 °C until constant weight). This dry matter was then ground, passed through a 100 mesh (1.7 mm) sieve, and the C, N, and S contents were determined by dry combustion in a simultaneous elemental analyzer (Elementar, Vario EL cube) for C, N, S, and H.
Soil chemical and physical properties
The soil samples were sieved through a 2 mm mesh and homogenized. The pH was determined by potentiometry in a 0.01 mol L-1 CaCl
2 solution. Phosphorus, Ca
2+, and
Mg2+ were extracted with ion exchange resin. Potassium was extracted by Mehlich-1
and determined by flame emission spectrometry. Phosphorus was determined electrophotometrically by the molybdenum blue complex, and Ca2+ and Mg2+ by atomic
absorption spectrometry. The H+Al were determined by a potentiometer in SMP solution at pH 7.0. We extracted Al from soil using a KCl solution (1 mol L-1) and determined by titration with 0.025 mol L-1 NaOH. Organic carbon (OC) was determined by colorimetric
procedures through oxidation of organic matter with Na2Cr2O7.2H2O and H2SO4, according
to Raij et al. (2001).
Soil moisture content was determined after drying the soil in a laboratory oven at 105 °C for 48 h. For particle size analysis, the sand fraction was obtained through sieving (0.053 mm),
clay fraction by the hydrometer method (Gee and Or, 2002), and silt by the difference
between the quantity of soil and the quantity of sand plus clay in the sample. In the winter, at the same collection points of samples for chemical analyses, undisturbed soil samples were removed from the 0.00-0.05 m layer, which were saturated by capillarity, gradually raising the water layer up to two-thirds the height of the soil sample rings. They were then subjected to the matrix potentials of -1 and -6 kPa using a tension table. When water balance was reached, the samples were weighed and subsequently dried in a laboratory oven at 105 °C for 48 h to determine moisture content (Claessen, 1997) and soil density (Blake and Hartge, 1986). Macroporosity was obtained by the
difference between the moisture content of the saturated soil and that corresponding to
the application of 6 kPa (Claessen, 1997). Microporosity was estimated by the moisture content retained at the tension of 6 kPa. Total porosity was obtained by the sum of the macro and microporosity. Particle density was determined by the helium gas pycnometer method (Danielson and Sutherland, 1986).
Microbial biomass carbon, soil respiration, metabolic quotient, and dehydrogenase activity
Microbial biomass carbon (MBC) was determined by the fumigation-extraction method (Vance et al., 1987) using 100 g of soil. The samples were fumigated in ethanol-free chloroform for 24 h. The C of the fumigated and non-fumigated samples was extracted simultaneously with K2SO4 (0.5 mol L
-1) under shaking at 180 rpm for 30 min, oxidation with K 2Cr2O7
(66 mmol L-1), and titration with ferrous ammonium sulfate (33 mmol L-1 [(NH
4)2.Fe(SO4)2.6H2O])
in the presence of barium diphenylamine sulfonate. The correction factor used in the calculations was 0.33, as proposed by Sparling and West (1988).
Microbial activity was evaluated by determination of basal respiration, the CO2 released
in incubated samples of 100 g of soil. The soil was incubated in glass containers, in the dark at 28 °C, containing a crucible with NaOH (0.5 mol L-1), for 10 days. The C released
as CO2 was determined every 24 h through quantification of the remaining NaOH through
titration with standard HCl solution (0.5 mmol L-1), using phenolphthalein as an indicator
and previous precipitation of the Na through addition of BaCl2.2H2O (4 mol L -1
), according to Alef and Nannipieri (1995). The results of CO2-C and of microbial biomass carbon
(MBC) were used to calculate the metabolic quotient (qCO2), as described in Anderson
Dehydrogenase enzyme activity (DehA) was determined in 5 g soil samples with natural moisture and the addition of 5 mL of a triphenyltetrazolium chloride (TTC) solution, 1.0 % (v/v), incubated at 37 °C for 24 h. Enzyme activity was measured in a spectrophotometer at 485 nm (Casida et al., 1964).
Statistical analysis
The results of density, richness of taxonomic groups, and the indexes of Shannon diversity (H), Simpson dominance (Is), and Pielou’s evenness (e) were subjected to analysis of
variance (two-way Anova), and the means were compared by the LSD test (p≤0.05)
by the SAS 8.2 statistical program (Statistical Analysis Systems Institute Inc., 2002).
Principal Component Analysis (PCA) was conducted using the CANOCO 4.0 program (ter Braak and Smilauer, 1998). Chemical properties [pH(H2O), P, Ca2+, Mg2+, K+, Al3+, OC, and
H+Al], physical properties [bulk density (BD), macroporosity (Ma), microporosity (Mi), total porosity (TP), and soil moisture (Moi)], properties of surface litter [carbon (C-lit), nitrogen (N-lit), and sulfur (S-lit)], surface litter dry matter (SLDM), soil microbiological properties (MBC, CO2-C, DehA, and qCO2), and the diversity indexes (H, Is, and e) were
later used in the PCA as explanatory environmental variables for modifications in the
macrofaunal community.
Only the physical properties (Moi, BD, Ma, and TP), soil chemical properties (P, OC, Ca, H+Al), surface litter chemical properties (C-lit, N-lit, S-lit), SLDM, microbiological properties (MBC, qCO2, and DehA), and the diversity indexes (H, Is, and e) that were
significant (p<0.05) were used as explanatory environmental variables, thus increasing
the robustness of the analysis.
In addition, the environmental variables and the main properties of the macrofauna were subjected to canonical discriminant analysis (CDA) to identify which of them were most relevant in separation of the areas (Cruz-Castillo et al., 1994; Baretta et al.,
2005). The standardized canonical coefficients (SCC), the correlation coefficient (r), and the parallel discrimination rate (PDR) (PDR = r × SCC) were calculated. The values
of the coefficient of the parallel discrimination rate (PDR) indicate the force of the
variable in distinguishing the areas studied in which the values are considered good (from 0.1 to 0.2), very good (from 0.2 to 0.4), optimal (from 0.4 to 0.8), and excellent (above 0.81) (Baretta et al., 2010).
RESULTS AND DISCUSSION
The density of soil invertebrates (ind m-2) in the summer were higher in the NF (3,018 ind m-2)
than in the RF (2,115 ind m-2) (p<0.05). However, in the winter, there were no significant
differences (p>0.05) between NF (1,373 ind m-2) and RF (1,132 ind m-2). These values
are higher than those found by Merlim (2005) and Baretta et al. (2010) in a native and reforested Araucaria area in the Campos de Jordão State Park and by Vasconcellos et al. (2013b) in the winter in forest restoration areas in the state of São Paulo. The increase that
was observed may reflect the higher number of sampled areas of the same system (true
replications), and the better state of conservation of the areas studied. This highlights the need to adopt true replications in the study of soil macrofaunal biodiversity and studies over several years.
Regardless of the sample collection period, the groups of social insects Isoptera and Hymenoptera were those with the greatest relative frequency in the soil community in all the areas. The relative frequency of ants increased in the summer compared to winter, regardless of the type of forest. These groups have been reported as most frequent in soils
of different forest ecosystems (Aquino et al., 2008; Baretta et al., 2011; Nunes et al., 2012;
The relative frequency of Oligochaeta was greater in RF areas, which shows the importance of this group as a good indicator of soil quality and/or environmental disruption (Baretta et al., 2007b). The other groups were Coleoptera, Chilopoda, and Diplopoda, which exhibit similar density and frequency among the areas and periods of the year evaluated. This is explained by the fact that such groups have similar life cycles and stable densities throughout the year (Tuf and Tufová, 2008; Brown et al., 2009).
The mean values of richness of taxonomic groups of invertebrate soil macrofauna in the
two sample collection periods were significantly greater in the NF (10.04 in the winter and
11.82 in the summer) than in the RF (8.37 in the winter and 9.75 in the summer), and they were always greater in the summer. This indicates that the best sample collection period for studying the abundance and diversity of the soil macrofaunal community is the end of the rainy period. These results corroborate those of Merlim (2005) and Baretta et al. (2010), who obtained similar results, always greater in native and preserved forests. In general, the greatest richness of soil macrofaunal groups was associated with the native forest environment in the summer, where the greater diversity of plant cover may have resulted in greater heterogeneity and amount of surface litter and, consequently, greater food supply, as well as soil and climate conditions favorable to soil fauna.
Greater density and richness of soil fauna have been observed in soil under native forest cover in more advanced successional stages, compared to reforested and pasture areas (Moço et al., 2005; Menezes et al., 2009; Vasconcelos et al., 2013b), including native forest with Araucaria angustifolia (Baretta et al., 2010). In this respect, Gibson et al. (2011) alert that native and/or preserved secondary forests are irreplaceable in the task of preserving tropical biodiversity.
There were no significant differences in Shannon’s diversity (H), Simpson’s dominance
(Is), and Pielou’s evenness (e) ecological indices between NF and RF, although the NF exhibited greater richness of taxonomic groups in relation to RF. The predominance of some groups of soil invertebrates in NF, such as Isoptera, Hymenoptera, Coleoptera, and Chilopoda, with positive and higher scores in relation to the others, decreases equitability
among the groups, and is directly reflected in diversity. As consequence of this effect,
the ecological indices of diversity H, Is, and e showed weak association with the NF area
(Figure 1a). Lima et al. (2010), studying the effect of soil use on macrofaunal diversity and its relation to chemical properties in different agrosystems, found that, regardless
of the sample collection period, the soil under native forest cover had the lowest values of Shannon’s and Pielou’s indices, associated with the dominance of individuals of the Isoptera group. Thus, in the present study, considering not only the soil macrofaunal variables, but also the explanatory environmental variables, it was clear that the measure of diversity that best represented the areas of study was the richness of taxonomic groups, in comparison to the other ecological indices (H, Is, and e).
Principal Component Analysis (PCA)
Principal component analysis (PCA) revealed that the first two principal components (PC1
and PC2) explained 39.3 % of the total variability of the data in the winter, with 21.0 % explained by PC1 and only 18.3 % by PC2 (Figure 1a). In the summer, analysis of the
variables by PCA in the first two axes explained 40.6 % of the variance (Figure 1b). The
results of PCA show the separation of the forests studied, and that the groups of soil
macrofauna and the explanatory environmental variables occurred in a differentiated
manner between NF and RF in the two sample collection periods.
PC1 21.0 % 1.5 -1.0 -1.0 PC2 18.3 %1 .0
PC1 27.4 % 1.5
-1.5 -1.0 PC2 13.2 %1 .5 Oligo Enchy Pseudo Diplo Moll Blat Others Coleo Abun Iso Orth Opil Chil Hym Isopt C-lit MBC Ma P BD SLDM TP OC Moi Ca DehA NF RF Moi RF Oligo Isopt Abun Hym Blat Orth Coleo Opil Richness Chil Others Iso Diplo Moll Pseudo Enchy Grill TP H+AI
qCO2
DehA SLDM MBC BD Ma C-lit P N-lit NF (a) H Is e (b)
Figure 1. Relation between Principal Components 1 and 2, discriminating native Araucaria forests
considered to be invasive (Brown and James, 2007). Furthermore, the higher density of earthworms in RF is considered to be an indicator of improvement of soil quality in this location, especially through the presence of the genus Amynthas, which, though exotic, lives in soils with higher organic matter and surface litter content (Brown and James, 2006; Brown et al., 2006, 2009; Bartz et al., 2014). However, these two genera of earthworms (Amynthas and Ponthoscolex), found in the RF area, have already been observed in some ecosystems derived from the Atlantic Forest, especially areas with a certain human intervention, and have already been reported as indicators of disruptions
in different ecosystems (Fragoso et al., 1997; Burtelow et al., 1998; Brown and James,
2006; Marichal et al., 2010), including native Araucaria angustifolia forests in the state of São Paulo (Baretta et al., 2007b).
The PCA also showed that the RF was more associated with soils with higher moisture content, total porosity (Figures 1a and 1b), exchangeable acidity, DehA and qCO2 (Figure 1a). In this
area, the higher soil moisture content, regardless of the sample collection period, brought about especially by the accumulation of a greater diversity of surface litter, provided a soil environment more favorable to colonization by Oligochaeta and less favorable to most of the other groups of macrofauna (Pimentel et al., 2006; Rosa et al., 2015), which helped to explain their greater density in RF. The greater density of Oligochaeta in the RF area may also indicate that they are pioneers in preparing this environment, favoring colonization by
other groups of macrofauna in the long term, reflected in their being known as “ecosystem
engineers” (Brown et al., 2000; Baretta et al., 2011).
In both sample collection periods, the groups Chilopoda, Coleoptera, Isopoda, and Diplopoda showed greater association with NF, resulting in greater richness of taxonomic groups in this forest (Figure 1a). These groups were also more abundant in preserved forests than in replanted forests of this species, whether subjected to human intervention or not (Baretta et al., 2010; Rosa et al., 2015). The presence of predator and saprophyte groups in the NF, even in the winter period, indicates greater availability of food related to the greater variety of plant cover, which favors the colonization and development of these groups (Rousseau et al., 2013). Besides these, other groups were associated with NF, such as Enchytraeidae, Mollusca, Pseudoscorpionida, and Hymenoptera (Figure 1a).
The forest environments with the more conserved native Araucaria forest provided the best soil conditions for colonization of macrofauna, with the exception of Oligochaeta, indicating that these groups were sensitive to environmental changes present in the RF area, probably related to changes in the soil/surface litter environment, the main habitat and source of resources necessary for invertebrates (Lavelle et al., 2006; Vasconcelos et al., 2013b). The NF was also associated with soils that had a higher content of MBC, C, and N in the surface litter, a high P content in the soil, and greater aeration ability and soil BD, which may explain the association of most of the macrofaunal groups with this area. The combined and more frequent occurrence of predators and saprophytes, associated with P content in the soil and C and N content in the surface litter, indicates improvement in the biological quality of the soil and suggests that the surface litter represents a nutrient and energy reserve that stimulates soil macrofauna (Haddad et al., 2012). In addition,
the NF area is characterized by maintenance of more diversified and mature plant cover,
which allows greater input of surface litter, root density, reduction in thermal oscillations
in the soil, and nutrient cycling, essential for maintenance of a diversified soil community
(Aquino et al, 2008; Baretta et al., 2011).
Canonical Discriminant Analysis (CDA)
The Wilks’ Lambda multivariate statistical test for the invertebrate macrofaunal properties
and environmental variables indicated significant differences between sampling periods
High canonical correlation was also observed for the dry period (winter) (0.95) and rainy period (summer) (0.93) (p<0.0001). High canonical correlation values indicate high association among the properties analyzed and the areas where these properties dominated (Baretta et al., 2010).
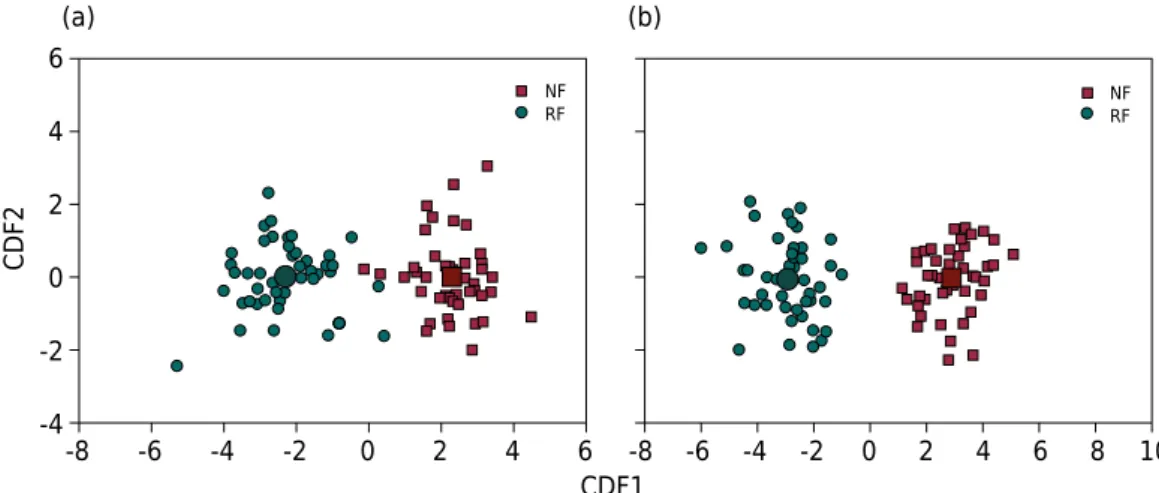
Table 1 indicates the standardized canonical coefficients (SCC) of CDF1 and CDF2 for
the two sampled areas with Araucaria, considering all the environmental properties and the soil macrofauna analyzed (Table 2). From the result of the CDA, we found that CDF1 clearly separated the NF area (with higher SCC values) from the RF area, in both sampling periods (Figures 2a and 2b).
The coefficient of the parallel discrimination rate (PDR) is considered the most adequate parameter for evaluating the effect of discrimination by the soil properties analyzed within the areas. Thus, the positive values of PDR indicate effects of separation between the
areas in regard to the property analyzed, whereas the negative values indicate similarities
(Baretta et al., 2008a). In general, the PDR value of each property was differentiated for
each sampling period (Table 1).
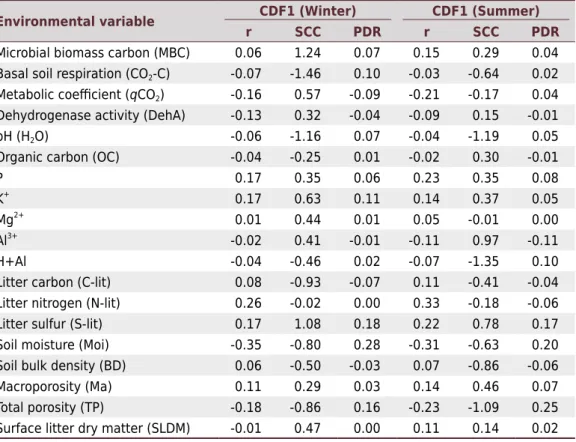
In the winter sampling period, within CDF1, the properties of soil moisture (0.28), S-lit (0.18), TP (0.16), K (0.11), and CO2-C (0.10) had the highest positive values of
coefficients of PDR, better explaining the separation between the areas studied (Table 1).
The environmental variables considered indicators of changes in the areas in CDF1 in the summer were TP (0.25), Moi (0.20), S-lit (0.17), and H+Al (0.10).
Total porosity (TP) of the soil is related to its capacity to provide conditions favorable
for growth and development of the plant root system, and it is highly influenced by soil
structure. Moisture content is related to the density of soil plant cover and the continuous presence of a thicker layer of surface litter, resulting in lower oscillation of temperature,
besides the soil texture effect. The S content in the surface litter may vary according to the
quality and diversity of plants in the areas of study; the same occurs with K, which is easily leached from the plant tissue to the soil (Torres and Pereira, 2008). Properties related to soil C and microbial activity (CO2-C and MBC) also contributed to separation of the areas,
as well as P and pH (H2O), which modulate the action of CO2-C and MBC, confirming their
participation as soil quality indicators (Maluche-Baretta et al., 2006; Baretta et al., 2010).
In the winter sampling, within CDF1, the macrofaunal properties that had the highest
positive values of the PDR coefficients were richness of taxonomic groups (0.13),
Oligochaeta (0.03), and Chilopoda (0.03) (Table 2).
(b) (a)
CDF1
CDF2
-4 -2 0 2 4 6
-8 -6 -4 -2 0 2 4 6 -8 -6 -4 -2 0 2 4 6 8 10
NF RF
NF RF
Figure 2. Standardized Canonical Coefficients (SCC) of the Canonical Discriminant functions 1
Table 2. Standardized canonical coefficients (SCC), canonical correlation (r), and Parallel
Discrimination Rate (PDR: r × SCC) related to canonical discriminant analysis (CDA) containing macrofaunal variables, in winter and summer, regardless of the site
Most frequent group CDF1 (Winter) CDF1 (Summer)
r SCC PDR r SCC PDR
Coleoptera 0.04 0.50 0.02 0.14 0.05 0.01
Orthoptera 0.04 0.13 0.01 0.00 -0.19 0.00
Hymenoptera 0.05 0.08 0.00 0.11 0.02 0.00
Isoptera 0.02 -0.30 -0.01 0.05 -0.24 -0.01
Diplopoda 0.02 -0.16 0.00 0.00 -0.03 0.00
Chilopoda 0.15 0.18 0.03 0.16 0.00 0.00
Isopoda 0.10 0.00 0.00 0.01 0.13 0.00
Opilionidae 0.01 -0.13 0.00 -0.01 -0.50 0.00
Pseudoscorpionidae 0.03 -0.26 -0.01 -0.04 -0.13 0.00
Mollusca 0.10 0.09 0.01 0.14 0.41 0.06
Blattodea 0.06 -0.16 -0.01 0.07 -0.21 -0.01
Griloblattodea 0.06 0.14 0.01 0.00 0.00 0.00
Enchytraeidae -0.06 -0.09 0.01 -0.12 -0.17 0.02
Oligochaeta -0.15 -0.21 0.03 -0.19 -0.22 0.04
Others(1)
-0.01 -0.22 0.00 0.07 0.18 0.01
Other macrofaunal properties
Abundance 0.03 0.00 0.00 0.08 0.00 0.00
Richness of taxonomical groups 0.11 1.18 0.13 0.17 0.91 0.15
Shannon’s diversity index (H) 0.06 -1.28 -0.08 0.06 -1.24 -0.08
Simpson’s dominance index (Is) 0.04 -1.07 -0.05 0.03 0.08 0.00
Pielou’s evenness index (e) 0.03 2.22 0.06 0.01 1.26 0.01
(1)
Others: Sum of less frequent groups
Table 1. Standardized canonical coefficients (SCC), canonical correlation (r), and Parallel
Discrimination Rate (PDR: r × SCC) related to canonical discriminant analysis (CDA) containing environmental variables, in winter and summer, regardless of the site
Environmental variable CDF1 (Winter) CDF1 (Summer)
r SCC PDR r SCC PDR
Microbial biomass carbon (MBC) 0.06 1.24 0.07 0.15 0.29 0.04
Basal soil respiration (CO2-C) -0.07 -1.46 0.10 -0.03 -0.64 0.02
Metabolic coefficient (qCO2) -0.16 0.57 -0.09 -0.21 -0.17 0.04
Dehydrogenase activity (DehA) -0.13 0.32 -0.04 -0.09 0.15 -0.01
pH (H2O) -0.06 -1.16 0.07 -0.04 -1.19 0.05
Organic carbon (OC) -0.04 -0.25 0.01 -0.02 0.30 -0.01
P 0.17 0.35 0.06 0.23 0.35 0.08
K+
0.17 0.63 0.11 0.14 0.37 0.05
Mg2+
0.01 0.44 0.01 0.05 -0.01 0.00
Al3+ -0.02 0.41 -0.01 -0.11 0.97 -0.11
H+Al -0.04 -0.46 0.02 -0.07 -1.35 0.10
Litter carbon (C-lit) 0.08 -0.93 -0.07 0.11 -0.41 -0.04
Litter nitrogen (N-lit) 0.26 -0.02 0.00 0.33 -0.18 -0.06
Litter sulfur (S-lit) 0.17 1.08 0.18 0.22 0.78 0.17
Soil moisture (Moi) -0.35 -0.80 0.28 -0.31 -0.63 0.20
Soil bulk density (BD) 0.06 -0.50 -0.03 0.07 -0.86 -0.06
Macroporosity (Ma) 0.11 0.29 0.03 0.14 0.46 0.07
Total porosity (TP) -0.18 -0.86 0.16 -0.23 -1.09 0.25
In the summer, within CDF1, the properties richness of taxonomic groups (0.15), Mollusca
(0.06), and Oligochaeta (0.04) had the highest positive values of PDR coefficients (Table 2). Baretta et al. (2010) also found positive values of PDR coefficients for Mollusca, considered an
indicator of changes in areas with Araucaria, regardless of the sample collection period. The other properties of the environmental variables and of macrofauna were less sensitive, with lower values of PDR, and they contributed less to the function recommended for separation
between the areas (Table 2). This result confirms recommendation of the Oligochaeta group
as important in discriminating between native and replanted Araucaria forests.
In the two sampling periods, we observed, through PDR values, that environmental and
macrofaunal properties were effective in separating the areas studied, showing potential as
indicators, because they provided separation between the areas, especially when a greater number of replications of the samples and of the ecosystems sampled (true replications)
is observed, as in the present study (Rossi et al., 2006). Thus, for effective evaluation of
soil quality in native and replanted Araucaria forests, there is the need for combined use of physical, chemical, and microbiological indicators, with the addition of the macrofauna, which play an important role in this ecosystem (Baretta et al., 2008a; Baretta et al., 2010).
CONCLUSIONS
The state of conservation of the Araucaria forest and the physical-chemical and microbiological properties of the soil were determining factors in the environmental
conditions that influenced the distribution of the macrofaunal community in the areas
with Araucaria. Such properties, together with the macrofauna, increase the robustness of evaluation of soil quality in areas with Araucaria.
The native forest with Araucaria that had greater floristic complexity provided greater
diversity of soil macrofaunal groups, and this diversity is greatest in the summer.
Shannon’s diversity, Simpson’s dominance, and Pielou’s evenness ecological indices were
not sensitive to modifications in the soil macrofaunal properties in the forests studied.
Most of the soil macrofaunal groups were associated with the native Araucaria forest in the PCA and responded positively to improvement in environmental quality.
The most promising properties for separation between the areas with Araucaria were Oligochaeta, Chilopoda, Mollusca, group richness, soil moisture and total porosity, litter sulfur content, CO2-C, and H+Al.
ACKNOWLEDGMENT
The first author is grateful to the Federal Institute of Education, Science and Technology of the South of Minas Gerais for the financial support to translate this article. D. B. thanks CNPq for a Scientific Productivity Exchange (Process number 307162/2015-0). EJBNC acknowledges a CNPq grant for Scientific Productivity.
REFERENCES
Alef K, Nannipieri P. Methods in applied soil microbiology and biochemistry. London: Academic Press; 1995.
Anderson JM, Ingram JSI. Tropical soil biology and fertility: a handbook of methods. 2nd ed. Wallingford: CAB International; 1993.
Anderson TH, Domsch KH. The metabolic quotient for CO2 (qCO2) as a specific activity parameter
Aquino AM, Silva RF, Mercante FM, Correia MEF, Guimarães MF, Lavelle P. Invertebrate soil macrofauna under different ground cover plants in the no-till system in the Cerrado. Eur J Soil Biol. 2008;44:191-7. https://doi.org/10.1016/j.ejsobi.2007.05.001
Baretta D, Brescovit AD, Knysak I, Cardoso EJBN. Trap and soil monolith sampled edaphic spiders (Arachnida: Araneae) in Araucaria angustifolia forest. Sci Agric. 2007a;64:375-83. https://doi.org/10.1590/S0103-90162007000400008
Baretta D, Brown GG, Cardoso EJBN. Potencial da Macrofauna e outras variáveis edáficas como indicadores da qualidade do solo em áreas com Araucaria angustifolia. Acta Zool Mex. 2010;26:135-50.
Baretta D, Brown GG, James SW, Cardoso EJBN. Earthworm populations sampled using collection methods in Atlantic Forests with Araucaria angustifolia. Sci Agri. 2007b;64:384-92. https://doi.org/10.1590/S0103-90162007000400009
Baretta D, Ferreira CS, Sousa JP, Cardoso EJBN. Colêmbolos (Hexapoda: Collembola) como bioindicadores de qualidade do solo em áreas com Araucaria angustifolia. Rev Bras Cienc Solo. 2008b;32:2693-9. https://doi.org/10.1590/S0100-06832008000700012
Baretta D, Maluche-Baretta CRD, Cardoso EJBN. Análise multivariada de atributos
microbiológicos e químicos do solo em florestas com Araucaria angustifolia. Rev Bras Cienc Solo. 2008a;32:2683-91. https://doi.org/10.1590/S0100-06832008000700011
Baretta D, Santos JCP, Figueiredo SR, Klauberg-Filho O. Efeito do monocultivo de pinus e da queima do campo nativo em atributos biológicos do solo no planalto sul catarinense. Rev Bras Cienc Solo. 2005;29:715-24. https://doi.org/10.1590/S0100-06832005000500007
Baretta D, Santos JCP, Segat JC, Geremia EV, Oliveira Filho LCI, Alves MV. Fauna edáfica e qualidade do solo. Tópic Cienc Solo. 2011;7:141-92.
Bartz MLC, Brown GG, Orso R, Mafra AL, Baretta D. The influence of land use systems on soil and surface litter fauna in the western region of Santa Catarina. Rev Cienc Agron. 2014;45:880-7. https://doi.org/10.1590/S1806-66902014000500003
Bastida F, Zsolnay A, Hernández T, García C. Past, present and future of soil quality indices: A biological perspective. Geoderma. 2008;147:159-71. https://doi.org/10.1016/j.geoderma. 2008.08.007
Blake GR, Hartge KH. Bulk density. In: Klute A, editor. Methods of Soil Analysis: Physical and Mineralogical Methods. 2nd ed. Madison: American Society of Agronomy; 1986. Pt 1. p.363-75.
Brown GG, Barois I, Lavelle P. Regulation of soil organic matter dynamics and microbial activity in the drilosphere and the role of interactions with other edaphic functional domains. Eur J Soil Biol. 2000;36:177-98. https://doi.org/10.1016/S1164-5563(00)01062-1
Brown GG, James SW. Ecologia, biodiversidade e biogeografia das minhocas no Brasil. In: Brown GG, Fragoso C, editores. Minhocas na América Latina: biodiversidade e ecologia. Londrina: Embrapa Soja; 2007. p.297-381.
Brown GG, James SW. Earthworm biodiversity in São Paulo State, Brazil. Eur J Soil Biol. 2006;42:S145-9. https://doi.org/10.1016/j.ejsobi.2006.06.006
Brown GG, James SW, Pasini A, Nunes DH, Benito NP, Martins PT, Sautter KD. Exotic, peregrine and invasive earthworms in Brazil: diversity, distribution and effects on soils and plants. Caribbean J Sci. 2006;42:339-58.
Brown GG, Maschio W, Froufe LCM. Macrofauna do solo em sistemas agroflorestais e Mata Atlântica em regeneração nos municípios de Barra do Turvo, SP, e Adrianópolis, PR. Colombo: Embrapa Florestas; 2009. (Documentos, 184).
Burtelow AE, Bohlen PJ, Groffman PM. Influence of exotic earthworm invasion on soil organic matter, microbial biomass and denitrification potential in forest soils of the northeastern United States. Appl Soil Ecol. 1998;9:197-202. https://doi.org/10.1016/S0929-1393(98)00075-4
Cardoso EJBN, Vasconcellos RLF, Bini D, Miyauchi MYH, Santos CA, Alves PRL, Paula AM, Nakatani AS, Pereira JM, Nogueira MA. Soil health: looking for suitable indicators. What should be considered to assess the effects of use and management on soil health? Sci Agric. 2013;70:274-89. https://doi.org/10.1590/S0103-90162013000400009
Carvalho F, Moreira FMS, Cardoso EJBN. Chemical and biochemical properties of Araucaria angustifolia (Bert.) Ktze. Forest soils in the state of São Paulo. Rev Bras Cienc Solo. 2012;36:1189-201. https://doi.org/10.1590/S0100-06832012000400013
Casida Junior LE, Klein DA, Santoro T. Soil dehydrogenase activity. Soil Sci. 1964;98:371-6.
Cruz-Castillo JG, Ganeshanandam S, Mackay BR, Lawes GS, Lawoko CRO, Woolley DJ. Applications of canonical discriminant analysis in horticultural research. Hortic Sci. 1994;29:1115-9.
Claessen MEC, organizador. Manual de métodos de análise de solo. 2a ed. Rio de Janeiro: Centro Nacional de Pesquisa de Solos; 1997.
Danielson RE, Sutherland PL. Porosity. In: Klute A, editor. Methods of Soil Analysis: Physical and Mineralogical Methods. 2nd ed. Madison: American Society of Agronomy; 1986. Pt 1. p.443-61.
Fragoso C, Brown GG, Patrón JC, Blanchart E, Lavelle P, Pashanasi B, Senapati B, Kumar T. Agricultural intensification, soil biodiversity and agroecosystem function in the tropics: the role of earthworms. Appl Soil Ecol. 1997;6:17-35. https://doi.org/10.1016/S0929-1393(96)00154-0
Gee GW, Or D. Particle-size analysis: Physical method. In: Dane JH, Topp GC, editors. Methods of soil analysis. Physical methods. Madison: Soil Science Society of America; 2002. Pt. 4. p.255-93.
Gibson L, Lee TM, Koh LP, Brook BW, Gardner TA, Barlow J, Peres CA, Bradshaw CJA, Laurence WF, Lovejoy TE, Sodhi NS. Primary forests are irreplaceable for sustaining tropical biodiversity. Nature. 2011;478:378-83. https://doi.org/10.1038/Nature10425
Haddad GQ, Cividanes FJ, Martins ICF, Correa LRB. Population fluctuations of Formicidae (hymenoptera) and Araneae (Arachnida) in two tillage systems in the region of Guaíra-SP. Florida Entomol. 2012;95:1012-8. https://doi.org/10.1653/024.095.0429
Korasaki V, Morais JW, Braga RF. Macrofauna. In: Moreira FMS, Cares JE, Zanetti R, Stürmer SL, editores. O ecossistema solo: componentes, relações ecológicas e efeitos na produção vegetal. Lavras: UFLA; 2013. p.119-38.
Kronka FJN, Nalon MA, Matsukuma CK, Kanashiro MM, Ywane MSS, Pavão M, Durigan G, Lima LMPR, Guillaumon JR, Baitello JB, Borgo SC, Manetti LA, Barradas AMF, Fukuda JC, Shida CN, Monteiro CHB, Pontinhas AAS, Andrade GG, Barbosa O, Soares APCA, Joly CAHTZ, Couto TZ. Inventário florestal da vegetação natural do Estado de São Paulo. São Paulo: Páginas e Letras; 2005.
Lavelle P. Diversity of soil fauna and ecosystem function. Biol Internat. 1996;33:3-16.
Lavelle P, Decaëns T, Aubert M, Barot S, Blouin M, Bureau F, Margerie P, Mora P, Rossi JP. Soil invertebrates and ecosystem services. Eur J Soil Biol. 2006;42:S3-15. https://doi.org/10.1016/j.ejsobi.2006.10.002.
Lavelle P, Moreira F, Spain A. Biodiversity: Conserving biodiversity in agroecosystems. Encycl Food Syst. 2014;2:41-60.
Lima SS, Aquino AM, Leite LFC, Velásquez E, Lavelle P. Relação entre macrofauna edáfica e atributos químicos do solo em diferentes agroecossistemas. Pesq Agropec Bras. 2010;45:322-31. https://doi.org/10.1590/S0100-204X2010000300013
Maluche-Baretta CRD, Amarante CVT, Klauberg-Filho O. Análise multivariada de atributos do solo em sistemas convencional e orgânico de produção de maçãs. Pesq Agropec Bras. 2006;41:1531-9. https://doi.org/10.1590/S0100-204X2006001000011
Mantovani A, Morellato LPC, Reis MS. Fenologia reprodutiva e produção de sementes em Araucaria angustifolia (Bert.) O. Kuntze. Rev Bras Bot. 2004;27:787-96.
https://doi.org/10.1590/S0100-84042004000400017
Menezes CEG, Correia MEF, Pereira MG, Batista I, Rodrigues KM, Couto WH, Anjos LHC, Oliveira IP. Macrofauna edáfica em estádios sucessionais de floresta estacional semidecidual e pastagem mista em Pinheiral (RJ). Rev Bras Cienc Solo. 2009;33:1647-56. https://doi.org/10.1590/S0100-06832009000600013
Merlim AO. Macrofauna edáfica em ecossistemas preservados e degradados no Parque Estadual de Campos do Jordão, SP [dissertação]. Piracicaba: Escola Superior de Agricultura “Luiz de Queiroz”; 2005.
Moço MKS, Gama-Rodrigues EF, Gama-Rodrigues AC, Correia MEF. Caracterização da fauna edáfica em diferentes coberturas vegetais na região norte fluminense. Rev Bras Cienc Solo. 2005;29:555-64. https://doi.org/10.1590/S0100-06832005000400008
Nunes LAPL, Silva DIB, Araújo ASF, Leite LFC, Correia MEF. Caracterização da fauna edáfica em sistemas de manejo para produção de forragens no Estado do Piauí. Rev Cienc Agron. 2012;43:30-7. http://dx.doi.org/10.1590/S1806-66902012000100004
Odum EP. Ecologia. Rio de Janeiro: Guanabara; 1983.
Paula JD, Lopes A. Jardins de formigas na Amazônia Central: um experimento de campo utilizando cupins vivos como iscas. Acta Amaz. 2013;43:447-54. https://doi.org/10.1590/S0044-59672013000400006
Pereira JM. Atributos biológicos como indicadores de qualidade do solo em florestas de
araucária nativa e reflorestada no estado de São Paulo, Brasil [tese]. Piracicaba: Escola Superior de Agricultura “Luiz de Queiroz”; 2012.
Pereira JM, Baretta D, Bini D, Vasconcellos RLF, Cardoso EJBN. Relationships between
microbial activity and soil physical and chemical properties in native and reforested Araucaria angustifolia forests in the state of São Paulo, Brazil. Rev Bras Cienc Solo. 2013;37:572-86. https://doi.org/10.1590/S0100-06832013000300003
Pimentel MS, Aquino AM, Correia MEF, Costa JR, Ricci MSF, De-Polli H. Atributos biológicos do solo sob manejo orgânico de cafeeiro, pastagem e floresta em região do médio Paraíba Fluminense-RJ. Coffee Sci. 2006;1:85-93.
Raij Bvan, Andrade JC, Cantarella H, Quaggio JA. Análise química para avaliação da fertilidade de solos tropicais. Campinas: Instituto Agronômico; 2001.
Ribeiro MC, Metzger JP, Martensen AC, Ponzoni FJ, Hirota MM. Brazilian Atlantic Forest: how much is left and how is the remaining forest distributed? Implications for conservation. Biol Conserv. 2009;142:1141-53. https://doi.org/10.1016/j.biocon.2009.02.021
Rosa MG, Klauberg Filho O, Bartz MLC, Mafra AL, Sousa JPFA, Baretta D. Macrofauna edáfica e atributos físicos e químicos em sistemas de uso do solo no planalto catarinense. Rev Bras Cienc Solo. 2015;39:1544-53. https://doi.org/10.1590/01000683rbcs20150033
Rossi JP, Mathieu J, Cooper M, Grimaldi M. Soil macrofaunal biodiversity in Amazonian pastures: matching sampling with patterns. Soil Biol Biochem. 2006;38:2178-87. https://doi.org/10.1016/j.soilbio.2006.01.020
Rousseau L, Fonte SJ, Téllez O, van der Hoek R, Lavelle P. Soil macrofauna as indicators of soil quality and land use impacts in smallholder agroecosystems of western Nicaragua. Ecol Indic. 2013;27:71-82. https://doi.org/10.1016/j.ecolind.2012.11.020
Santos RLR, Ivanauskas NM. Estrutura do componente arbóreo de trecho de floresta de araucária na Estação Ecológica de Itaberá, Itaberá-SP, Brasil. Inst Flor. 2010;42:127-31.
Santos RLR, Ivanauskas NM, Polisel RT, Esteves R. Comunidade arbórea de trecho de floresta secundária com araucária na Estação Ecológica de Bananal, Bananal-SP. Inst Flor. 2009;40:137-42.
Statistical Analysis Systems - SAS. SAS User’s guide: Statistics. Version 8.2. 6th ed. Cary: Statistical Analysis Systems Institute Inc.; 2002.
Schloter M, Dilly O, Munch JC. Indicators for evaluating soil quality. Agric Ecosyst Environ. 2003;98:255-62. https://doi.org/10.1016/S0167-8809(03)00085-9
Segat JC, Alves PRL, Baretta D, Cardoso EJBN. Ecotoxicological evaluation of swine manure disposal on tropical soils in Brazil. Ecotox Environ Safe. 2015;122:91-7. https://doi.org/10.1016/j.ecoenv.2015.07.017
Souza RPM. Estrutura da comunidade arbórea de trechos de florestas de Araucária no estado de São Paulo, Brasil [dissertação]. Piracicaba: Escola Superior de Agricultura “Luiz de Queiroz”; 2008.
Souza RPM, Polisel RT, Souza VC, Assis MC, Ivanauskas NM. Estrutura da comunidade arbórea e aspectos da regeneração natural de remanescentes florestais paulistas com araucária. In: Cardoso EJBN, Vasconcellos RLF, editores. Floresta com araucária: composição florística e biota do solo. Piracicaba: Fealq; 2015. p.89-132.
Sparling GP, West AW. A direct extraction method to estimate soil microbial C: Calibration
in situ using microbial respiration and 14
C labelled cells. Soil Biol Biochem. 1988;20:337-43. https://doi.org/10.1016/0038-0717(88)90014-4
ter Braak CJF, Smilauer P. CANOCO reference manual and user’s guide to Canoco for Windows: software for canonical community ordination (version 4). New York: Microcomputer Power; 1998.
Thomas, P. 2013. Araucaria angustifolia. The IUCN Red List of Threatened Species 2013: e.T32975A2829141. http://dx.doi.org/10.2305/IUCN.UK.2013-1.RLTS.T32975A2829141.en Tuf IH, Tufová J. Proposal of ecological classification of centipede, millipede and terrestrial isopod faunas for evaluation of habitat quality in Czech Republic. Cas Slez Muz Opava. 2008;57:37-44.
Torres JLR, Pereira MG. Dinâmica do potássio nos resíduos vegetais de plantas de cobertura no cerrado. Rev Bras Cienc Solo. 2008;32:1609-18. https://doi.org/10.1590/S0100-06832008000400025
Vance ED, Brookes PC, Jenkinson DS. An extraction method for measuring soil microbial biomass C. Soil Biol Biochem. 1987;19:703-7. https://doi.org/10.1016/0038-0717(87)90052-6
Vasconcellos RLF, Bonfim JA, Andreote FD, Mendes LW, Baretta D, Cardoso EJBN. Microbiological indicators of soil quality in a riparian forest recovery gradient. Ecol Eng. 2013a;53:313-20. https://doi.org/10.1016/j.ecoleng.2012.12.067