ISSN 2179-8087 (online)
Original Article
Microbiological Attributes of Soil Under Spontaneous
Restoration
Danielle Grazziotti
1, Paulo Grazziotti
2, Carla Ragonezi
1, Alexandre Silva
2,
Israel Pereira
2, Enilson Silva
31Programa de Pós-graduação em Produção Vegetal, Universidade Federal dos Vales do Jequitinhonha e Mucuri – UFVJM, Diamantina/MG, Brasil
2Departamento de Engenharia Florestal, Universidade Federal dos Vales do Jequitinhonha e Mucuri – UFVJM, Diamantina/MG, Brasil
3Departamento de Agronomia, Universidade Federal dos Vales do Jequitinhonha e Mucuri – UFVJM, Diamantina/MG, Brasil
ABSTRACT
The aim of this study was to evaluate the effect of vegetation on soil microbial activity during spontaneous restoration and the effect of remaining eucalypts on the restoration stage of reserve ranges installed in eucalypt plantations. The studied areas were in the following stages: initial restoration stage with and without remaining eucalypts; advanced restoration stage with and without remaining eucalypts. Areas of Cerrado, native forest and commercial eucalypt plantation (Eucalypts) were evaluated for reference. Principal component analysis detected the following groups: 1- Cerrado and areas in initial restoration stage with or without eucalypts and areas in advanced restoration stage without eucalypts; 2- areas in advanced restoration stage with eucalypts; 3- native forest; 4- Eucalypts. The restoration areas are at intermediate stage of recovery, slightly superior to the advanced stage. Basal respiration, organic and microbial soil carbon and microbial and metabolic quotients were more similar to those observed in Cerrado than in eucalypt cultivation areas and little influence of the remaining eucalypts plants was observed.
1. INTRODUCTION
The expansion of eucalypt plantations has caused legal reserve in many properties to become isolated areas amongst vast eucalypt stands. This has led to the need to adopt technical measures to enhance connectivity between the remaining fragments in such properties. One of these techniques is the implementation of ecological corridors. These aim to use ranges from areas previously planted with eucalyptus to form corridors through natural regeneration, where remaining eucalypt trees function as living perches, significantly contributing to the spontaneous restoration of the area.
Spontaneous restoration has often been adopted in the above mentioned recovering areas mainly because this is a lower-cost procedure (Souza et al., 2012) and because it promotes restoration based on arrival of native species while maintaining the integration with the surrounding landscape of croplands.
Assessment of environmental recovery stage is important because they aid to decide whether measures to improve the speed and, or degree of restoration should be adopted. However, there is little information about the evolution of spontaneous restoration stages in ecological corridors installed in Alto Vale do Jequitinhonha, and about the effect of the remaining eucalypt plants on the process of restoration. Shrub and tree floristic composition and structure in this area has been studied and there are indicatives that restoration has taken place, and some eucalypt remaining stands promote greater diversity of plants (Araújo et al., 2014).
As soil is an important component to plant growth, responsible for water and nutrient supply, the conservation or improvement of its quality is vital for the sustainability of ecosystems. Thus, the evaluation of soil quality has been proposed as an integrated indicator of environmental characteristics and ecosystem sustainability (Araújo et al., 2012). In general, most indicators recommended for evaluation of soil quality in terms of use and management are those that respond to environmental changes and that are subject to change at short- and medium-term (Pezarico et al., 2013). The analysis of microbial indicators of soil quality is relevant to obtain information on the performance of soil key functions such as the potential to cycle and
store nutrients (Araújo et al., 2012; Duan et al., 2015; Zhang et al., 2015; Hu et al., 2016).
Microbial indicators have frequently been suggested to be more sensitive to impacts caused by soil management than physical or chemical indicators (Yusuf et al., 2009; Frazão et al., 2010; Kaschuk et al., 2011; Paz-Ferreiro & Fu, 2016; Santos et al., 2016).
The high sensitivity of microbiological indicators can be of great importance to the early assessment of possible effects of the management adopted over soil quality, and consequently over the sustainability of the ecosystem. Thus, the aim of the present study was to evaluate the effect of cover crops on soil microbial activity during spontaneous restoration and evaluate the effect of remaining eucalypts on restoration in reserve ranges in Alto Vale do Jequitinhonha, in Minas Gerais.
2. MATERIAL AND METHODS
2.1. Area characterization
The study was carried out in 2004 in areas of the Aperam Bioenergia Ltda. company located on plateaus (“chapadas”) of Alto Vale do Jequitinhonha, in Itamarandiba, Capelinha, Turmalina and Minas Novas in the State of Minas Gerais. The area has a flat, slightly undulated relief and is traditionally used for forestry since the 1970s.
The climate in the region is tropical with dry winter, Aw type according to Köppen’s classification. The precipitation in the region is 1,445 mm on average, with 260 mm in December, the rainiest month, and no rain events in the month of September. Rains are concentrated in the months of January through April, and then November and December and the lowest means of precipitation happen in the months from May through September. Soils in the study areas are classified as Red Yellow Latosols, except for one type of soil in the plots studied in Cerrado, which is Red Latosol. However, both are typical dystrophic clayey soils and have similar physical, chemical, mineralogical and morphological attributes (Bispo et al., 2011).
2.2. Experimental design and treatments
The experiment consisted in a completely randomized 7x2 factorial design with treatments arranged in seven cover crops, and two soil layers, from 0 to 5 cm (0-5 layer) and from 5 to 20 cm (5-20 layer) deep, with four replications. The cover crops were: initial restoration in successional stage of less than three years with and without remaining eucalypts; advanced restoration in successional stage of more than three years with and without remaining eucalypts and, three controls: areas of Cerrado - tropical savanna (Cerrado), Seasonal Semi-deciduous Forest (Forest) and commercial eucalypt plantation (Eucalypt). The experimental unit consisted of a 400 m2 plot.
2.3. Experiment installation and execution
Plots in restoration areas were marked in sites (width 200 m) of spontaneous revegetation between eucalypt plantations (width 2000 m). Plot areas had been previously used for eucalypt cultivation. The last eucalypt harvest in areas of initial restoration occurred in 2001. In order to establish treatments without remaining eucalypts, the remaining plants were cut down and manually removed along with 20 m of border in January 2004, repeating this procedure when necessary. All plots were marked in January 2004. In the case of plots in advanced restoration areas with remaining trees, eucalypt had been harvested for the last time in 1998 and, in the case of advanced restoration areas without eucalypt trees, the remaining plants were mechanically removed in 1998. Control plots were marked in a commercial plantation of Eucalyptus urophylla, replanted in 2000. The Forest and Cerrado control plots were marked in undisturbed areas.
2.4. Sampling
Soil samples were collected in two seasons: August 2004, the end of the dry season, and December 2004, the beginning of the rainy season.
In each plot, ten soil sub-samples were randomly collected from the 0-5 and 5-20 cm deep layers, homogenized to form a composite sample, packaged in plastic bags and transported in thermal boxes to the Soil Microbiology Laboratory of the UFVJM (Universidade Federal dos Vales do Jequitinhonha
e Mucuri) in Diamantina, where they were sieved (2 mm) to remove organic residues and roots. Then, samples were stored at 4ºC until microbial analyses.
2.5. Laboratory analysis
Moisture and maximum water holding capacity (MWHC) were determined as proposed by Monteiro & Frighetto (2000). Soil basal respiration (Rbasal) was estimated as proposed by Alef & Nannipieri (1995). Microbial biomass content (Cmic) was determined using the method of fumigation and incubation described by Jenkinson & Powlson (1976). The Cmic was determined by the difference between the CO2 released from fumigated and non-fumigated samples, using the correction factor (Kc) 0.45 (Joergensen, 1995). The metabolic quotient (qCO2) was determined by the ratio between Rbasal and Cmic (Anderson & Domsch, 1993), expressed in µg CO2 µg Cmic-1 day -1.
Soil organic C content (Corg) was determined according to Walkley & Black (1934), and the microbial quotient (qMIC) calculated to determine the Cmic percentage of Corg.
2.6. Statistical analysis
Results from different seasons were separately submitted to analysis of variance. Comparisons through orthogonal contrasts between means at 5% error were carried out in order to compare restoration areas with controls (Cerrado and Eucalypt), to evaluate the effect of the remaining eucalypts and the advancement of spontaneous recovery. The Forest control was not included in orthogonal contrasts due to limited number of possible orthogonal contrasts, so that they would meet the main goals and also because the original biome in restoration areas were Cerrado. Thus, the Dunnett test at 5% was used to compare the Forest with each of the other areas.
3. RESULTS
In the dry season (August), orthogonal contrast analysis of soil characteristics showed differences only for contrasts between areas under restoration and Cerrado and Eucalypt control areas (Table 1). Areas under restoration presented lower moisture, MWHC, Corg and greater qMIC (Tables 2 and 3). This was also
evident in the mean test in relation to the Forest control (Tables 2 and 3). In the 0-5 cm layer soil, the mean Corg content in restoration areas was 40% lower than in Cerrado, three times lower than the Eucalypt area, and 4.5 times lower than the Forest (Table 3). In the 5-20 layer, the lower Corg content was only observed in relation to the Eucalypt and Forest areas (Table 3). Also in the dry season, usually in the two soil layers,
Table 1. Contrasts calculated with means for moisture, maximum water holding capacity (MWHC), organic C (Corg) and microbial quotient (qMIC) at the end of the dry season. Corg is presented for the two soil layers evaluated while other characteristics are presented as the mean of the two soil layers.
Contrast1/ Moisture MWHC Corg qMIC
0-5 cm 5-20 cm
Restoration areas vs Cerrado -145* -426* -130** -35 2.86**
Restoration areas vs Eucalypt -167** -507** -381** -114* 2.74**
Advanced restoration vs initial -36 -57 -10 -4 0.38
Remaining eucalypts in restoration areas 27 -17 -2 1 0.2
Remaining eucalypts in initial restoration areas 21 71 1 0 0.15 Remanescentes de eucalipto na regeneração avançada 6 -89 -3 1 0.05
* = significant at 5%; ** = signifcant at 1%; 1/ Restoration areas vs Cerrado = (IRWE + IROE + ARWE + AROE – 4Cerrado); Restoration areas vs Eucalypt = (IRWE + IROE + ARWE + AROE – 4Eucalipt); Advanced restoration vs initial (ARWE + AROE – IRWE – IROE); Remaining eucalypts in restoration areas = (IRWE + ARWE – IROE – AROE); Remaining eucalypts in initial restoration areas = (IRWE – IROE); Remaining eucalypts in advanced restoration areas = (ARWE – AROE); on that IRWE = Initial restoration with eucalypts; IROE = Initial restoration without eucalypts; ARWE = Advanced restoration with eucalypts; AROE = Advanced restoration without eucalypts.
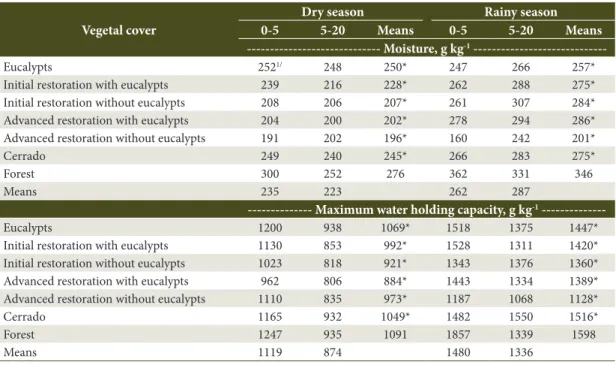
Table 2. Soil moisture and maximum water holding capacity evaluated in two soil layers, 0–5 and 5–20 cm deep, and in two seasons in reserve ranges at different stages of restoration and management, plus the Eucalypt, Cerrado and Forest controls.
Vegetal cover
Dry season Rainy season
0-5 5-20 Means 0-5 5-20 Means
--- Moisture, g kg-1
---Eucalypts 2521/ 248 250* 247 266 257*
Initial restoration with eucalypts 239 216 228* 262 288 275*
Initial restoration without eucalypts 208 206 207* 261 307 284*
Advanced restoration with eucalypts 204 200 202* 278 294 286*
Advanced restoration without eucalypts 191 202 196* 160 242 201*
Cerrado 249 240 245* 266 283 275*
Forest 300 252 276 362 331 346
Means 235 223 262 287
--- Maximum water holding capacity, g kg-1
---Eucalypts 1200 938 1069* 1518 1375 1447*
Initial restoration with eucalypts 1130 853 992* 1528 1311 1420* Initial restoration without eucalypts 1023 818 921* 1343 1376 1360* Advanced restoration with eucalypts 962 806 884* 1443 1334 1389* Advanced restoration without eucalypts 1110 835 973* 1187 1068 1128*
Cerrado 1165 932 1049* 1482 1550 1516*
Forest 1247 935 1091 1857 1339 1598
Means 1119 874 1480 1336
Table 3. Soil organic C, basal respiration, microbial biomass C, metabolic quotient and microbial quotient evaluated in two soil layers, 0-5 and 5-20 cm deep, and in two seasons in reserve ranges at different stages of spontaneous restoration and management, plus the Eucalypt, Cerrado and Forest controls.
Vegetal cover
Dry season Rainy season
0-5 5-20 Means 0-5 5-20 Means
--- Soil organic C (Corg), g kg-1 de solo
---Eucalypts 143*1/ 64 103 121* 36 79
Initial restoration with eucalypts 51* 36* 43 92* 29 61
Initial restoration without eucalypts 50* 36* 43 50* 30 40
Advanced restoration with eucalypts 44* 35* 39 50* 34 42
Advanced restoration without eucalypts 47* 34* 40 45* 29 37
Cerrado 80* 44* 62 73* 32 53
Forest 215 88 152 156 49 103
Means 90 48 69 84 34 59
--- Soil basal respiration (Rbasal), mg kg-1 h-1 CO
2
---Eucalypts 5.44 1.23 3.33 4.08 1.59 2.84
Initial restoration with eucalypts 4.54 1.91 3.23 4.85 0.88 2.86 Initial restoration without eucalypts 4.78 1.24 3.01 4.29 0.69 2.49 Advanced restoration with eucalypts 3.47 1.03 2.25 2.06* 0.72 1.39 Advanced restoration without eucalypts 4.84 0.59 2.72 3.92 0.99 2.46
Cerrado 5.04 1.90 3.47 1.79* 1.70 1.74
Forest 4.41 1.36 2.88 3.85 2.02 2.94
Means 4.65 1.32 3.55 1.23
--- Soil microbial biomass C (Cmic), mg de C kg-1
---Eucalypts 533 521 527 280* 121 220
Initial restoration with eucalypts 778 485 631 343* 210 303
Initial restoration without eucalypts 529 512 521 605* 206 445
Advanced restoration with eucalypts 554 657 606 799* 413 665
Advanced restoration without eucalypts 573 625 599 504* 438 517
Cerrado 650 327 489 735* 211 519
Forest 955 459 707 2148 382 1388
Means 653 512 773 283
--- Metabolic quotient (qCO2), µg CO2 µg Cmic-1 dia-1
---Eucalypts 0.27 0.06 0.16 0.56 0.30 0.43*
Initial restoration with eucalypts 0.18 0.10 0.14 0.37 0.09 0.23 Initial restoration without eucalypts 0.23 0.06 0.14 0.15 0.15 0.15 Advanced restoration with eucalypts 0.15 0.04 0.09 0.08 0.05 0.06 Advanced restoration without eucalypts 0.21 0.02 0.11 0.17 0.05 0.11
Cerrado 0.20 0.13 0.17 0.05 0.21 0.13
Forest 0.13 0.07 0.10 0.04 0.12 0.08
Means 0.20 0.07 0.20 0.14
--- Soil microbial quotient (qMIC), %
---Eucalypts 0.37 1.22 0.79 0.22 0.39 0.31*
Initial restoration with eucalypts 1.57 1.35 1.46* 0.38 0.71 0.55 Initial restoration without eucalypts 1.08 1.54 1.31* 1.19 0.68 0.94 Advanced restoration with eucalypts 1.31 1.89 1.60* 1.67 1.25 1.46 Advanced restoration without eucalypts 1.22 1.88 1.55* 1.14 1.54 1.34
Cerrado 0.79 0.74 0.76 1.02 0.62 0.82
Forest 0.44 0.53 0.49 1.46 0.91 1.18
Means 0.97 1.31 1.14 1.01 0.87 0.94
the Forest area had greater moisture, MWHC and Corg than Eucalypt and Cerrado controls (Tables 2 and 3).
During the rainy season (December), all studied characteristics were influenced by the type of vegetation cover (Table 4). In restoration areas, characteristics did not differ from Cerrado (p <0.05), except for the Rbasal in the 0-5 layer, which was 111% higher, on average, in restoration areas than in Cerrado (Table 3). Restoration areas had greater Cmic (101% - at 0-5 layer) and qMIC (246% - mean of the two layers) means and lower qCO2
(213% - mean of the two layers) and C org (51% - in the 0-5 layer) than the Eucalypt area (Tables 3 and 4). All restoration areas and Eucalypt and Cerrado controls had lower moisture, MWHC, Corg and Cmic than the Forest, and the last two factors occurred only in the 0–5 cm layer (Tables 3 and 4). The Rbasal in the advanced restoration area with eucalypts and Cerrado were also lower than the Forest control (Table 3).
Still in the rainy season, contrast analysis showed that areas in advanced restoration stage had lower Rbasal (35% - in the 0-5 layer), lower Corg (33% - in the 0–5 layer), greater Cmic (105% - in the 5–20 layer) and greater qMIC (47% - mean of the two layers) than the initial restoration stage (Tables 3 and 4). Restoration areas with remaining eucalypts presented greater moisture (22%) and Corg (33%) in the 0–5 cm layer (Tables 3 and 4) than areas without remaining eucalypts. As for the effect of remaining eucalypts on the initial
restoration, this provided greater Corg (46%) also in the 0-5 layer. In advanced restoration areas, the presence of remaining eucalypts promoted greater moisture (42% - in the 0-5 layer), greater MWHC (11% - mean of the two layers) and lower Rbasal (14% - mean of the two layers) (Table 2 and 3).
Four groups were formed in the principal component analysis according to soil characteristics evaluated in the different types of vegetation, in the two sampling seasons and in the 0-5 layer: 1- Cerrado and initial restoration areas with or without eucalypt and advanced restoration area without eucalypt; 2- advanced restoration area with eucalypt; 3- Forest; 4- Eucalypt (Figure 1).
4. DISCUSSION
Moisture, MWHC and Corg were lower in restoration areas than in Cerrado during the dry season (Tables 1, 2 and 3), as well as greater Rbasal in the 0–5 cm layer during the rainy season (Tables 3 and 4). This indicates that these areas under spontaneous restoration for at least three years have not reached the equilibrium state of the original biome, Cerrado. This was indicated, for example, by the Corg content that is critical for nutrient cycling and environmental sustainability, especially in tropical regions where soils are generally very weathered and unfertile, such as the Latosols in the studied area. The low Corg content also
Table 4. Contrasts calculated with the means for moisture, maximum water holding capacity (MWHC), basal respiration (Rbasal), microbial C (Cmic), metabolic quotient (qCO2), organic C (Corg) and microbial quotient (qMIC) in beginning of the rainy season.
Contrast1/ Moisture MWHC Rbasal Cmic qCO
2
Corg
qMIC
0-5 5-20 0-5 5-20 0-5 5-20 0-5 5-20
Restoration areas vs Cerrado -104 -1 -767 7.95** -3.52 -690 423 0.03 -56 -6 1.01 Restoration areas vs Eucalypt -28 68 -491 -1.20 -3.09 1131* 784 -1.17** -249** -21 3.05** Advanced restoration vs
initial -84 -59 -263 -3.17* 0.15 354 436* -0.21 -48* 4 1.31**
Remaining eucalypts in
restoration areas 119* 34 321 -1.30 -0.09 33 -21 0.03 48* 5 -0.27 Remaining eucalypts in
initial restoration areas 1 -19 60 0.56 0.18 -262 4 0.08 43** 0 -0.39 Remanescentes de eucalipto
na regeneração avançada 118** 52 261* -1.86* -0.27 295 -25 -0.05 5 5 0.12
reflected in low MWHC, since organic material has the ability to retain large amounts of water.
During the dry period, restoration areas had greater qMIC, proportion of Corg which is composed by Cmic, than Cerrado (Tables 1 and 2). This indicates that these areas have greater proportional fraction of living organic matter. This fraction is able to recycle nutrients faster than the rest of the soil organic matter (Moreira & Siqueira, 2006). This is a response of management and indicates greater addition of useful organic residues for microbial growth, since greater qMIC indicates the existence of better soil conditions (Yusuf et al., 2009; Paz-Ferreiro & Fu, 2016). However, greater Rbasal observed in regenerating areas in contrast with Cerrado in the 0-5 cm layer in the rainy season associated with lower Cmic, although not statistically significant (Tables 3 and 4), indicate that soil microbiota in restoration areas breathe more per unit of biomass. This is resulting from some environmental stress in these areas.
The Corg in the Eucalypt area was greater than in restoration areas in the two periods evaluated (Tables 1, 3 and 4) and this may be due to the high density of plants with rapid growth and subsequent production of high biomass which is deposited on the soil surface along with fallen leaves, branches and roots. This larger Corg content, therefore, explains greater MWHC (Tables 1 and 2). Nevertheless, lower Cmic and qMIC and greater qCO2 observed in Eucalypt control when compared to restoration areas indicate lower sustainability in the first, despite the greater Corg content. This is because the soil has smaller absolute living (Cmic) and relative (qMIC) organic matter fraction and greater respiration rates per microbial biomass unit (qCO2) (Tables 1, 3 and 4). High qCO2 and low qMIC demonstrate that the Corg is unsuitable for sustaining great microbial biomass, thus representing lower environmental sustainability, since Cmic fraction of the soil, although this represents a small part of the active fraction of the organic matter responsible for most of the cycled nutrients (Franzluebbers et al.,
1999; Paz-Ferreiro & Fu, 2016). The larger metabolic activity per unit of biomass indicated by high qCO2 promotes the consumption of organic matter in the soil without its transformation into Cmic and indicates lower environmental sustainability.
In the rainy season, the larger Cmic (significant only in the 5-20 layer) and qMIC in advanced restoration areas, and the lower Rbasal in the 0–5 cm layer in initial restoration areas (Tables 3 and 4), indicate greater sustainability of the soil environment in the first ones. The greater Corg content in the 0-5 cm layer in initial restoration areas may be due to fact that these areas have been cultured for a shorter time and due the recent harvest process, in which large quantities of biomass are deposited on the soil surface.
Greater moisture in the 0–5 cm layer in restoration areas with remaining eucalypts in the rainy season may be associated with increased shading promoted by the remaining eucalypts, reducing the incidence of light and the dryness of the soil. This greater moisture and greater Corg (Tables 1, 2, 3 and 4) may have favored the spontaneous restoration in this area. This was shown by Araújo et al. (2014) in his study on floristic composition and structure of the shrub and tree vegetation in these areas. These authors observed that the vegetation in advanced restoration sites with eucalyptus presented diversity index (Shannon) of 3.38 and equability index of 0.86, while advanced restoration sites without eucalypt had diversity index of 2.15 and the equability index of 0.59. This highlights the importance of maintaining eucalypt plants for their perch function and and to promote spontaneous restoration of these areas.
The lower Rbasal in advanced restoration areas with eucalypts for the same microbial biomass (Cmic) than in restoration areas without eucalypt (Tables 3 and 4), indicating the superiority of these microbial characteristics on the recovery of the first areas. This is also confirmed by the rates observed by Araújo et al. (2014). Thus, microbial characteristics of the soil confirm the observed in the vegetation studied, demonstrating the utility of such tool for the evaluation of soil quality and recovery stage of degraded areas.
Moisture, MWHC, Corg and Cmic of the Forest soil were different from all the other areas (Table 2 and 3) and they are consistent with the phytosociological characteristics of such environments (Araújo et al., 2014). These results were confirmed by the Principal
Component analysis (Figure 1), where these soil characteristics were also seen to contribute much for explaining the singularization of the Forest area in a distinct group (Figure 1). Among the factors that explain the greater Cmic in the Forest are possible the greater soil organic matter, soil moisture, dense surface litter layer, besides the quantity and quality of crop residues returned to the soil, as the floristic composition of these areas is very diversified. The qMIC also contributed to highlight the advanced restoration area with remaining eucalypt (Figure 1).
The qCO2 and Rbasal were the most significant indexes separating Eucalypt control from other areas (Figure 1). Lower qCO2 allows the identification of soils that provide best conditions for biomass to efficiently transform carbon into energy and new cellular components (Silva et al., 2010, Paz-Ferreiro & Fu, 2016), which, according to the theory of “bioenergetic development of ecosystems” (Odum, 1969), are present in little disturbed or stressed environments. In general, low qCO2 indicates energetic economy and supposedly reflects a more stable environment, closer to the equilibrium state. This is the case of areas with native vegetation. On the other hand, high values indicate ecosystems subjected to some stress or disturbance (Anderson & Domsch, 1993; Moreira & Siqueira, 2006; Paz-Ferreiro & Fu, 2016). The high qCO2 observed in the Eucalypt control area (Tables 3 and 4) reflect greater losses of C per unit of microbial biomass due to respiration process uncoupled with energy production and conservation process, showing a condition of stress or disorder (Islam & Weil, 2000), that is, an imbalanced environment. The qCO2 can be considered appropriate indicators of progressive maturation studies of the soil system (Anderson & Domsch, 1993).
and nutrients. Soil moisture has a fundamental role in bacterial growth in the soil.
The Principal Components analysis (Figure 1) confirms that natural regeneration of areas intended for ecological corridors happens within three years. Areas in initial restoration stage with or without remaining eucalypts and in advanced restoration stage without remaining eucalypts were similar to the Cerrado control. The potential that soil microbial characteristics have of detecting soil changes more promptly than physical-chemical characteristics, when comparing areas at different stages of restoration, has been also observed by other authors (Frazão et al., 2010; Kaschuk et al., 2011).
Restoration areas are in more advanced stages of recovery than the Eucalypt control, but they have not yet reached the equilibruim of the Cerrado control. However, the results show that spontaneous recovery has been effective to change microbial soil attributes towards those found in Cerrado. The monitoring of these developments is important for guiding companies that implement ecological corridors to assess the efficiency of the practices adopted as well as the need for interventions. In this sense, the results of the present study show the remaining eucalypts in areas under initial restoration have no effect over soil microbial characteristics. This was also observed in a concomitant phytosociological study carried out in these areas (Araújo et al., 2014). This study showed that the removal of eucalypts in advanced regeneration stages promoted reduction of diversity by giving way to intense colonization by Mimosa gemmulata, a pioneer species, in addition to possible crop damage caused to other species. Eucalypt maintenance in advanced restoration stages resulted in higher diversity and other phytosociological structural attributes (Araújo et al., 2014). Further studies on the effect of the remaining eucalypt trees in soil characteristics, flora and fauna should be conducted.
5. CONCLUSIONS
Restoration areas are at intermediate stage of recovery, slightly superiority to the more advanced stage, and similar to the soil conditions of Cerrado and remaining eucalypt plants exert little influence on such results.
Soil microbial characteristics are efficient to evaluate the recovery stage of the areas under spontaneous recovery.
SUBMISSION STATUS
Received: 19 july, 2016 Accepted: 1 oct., 2016
CORRESPONDENCE TO
Paulo Grazziotti
Departamento de Engenharia Florestal,
Universidade Federal dos Vales do Jequitinhonha e Mucuri – UFVJM, Campus JK, Rodovia MGT 367, Km 583, 5000, Alto da Jacuba, CEP 39100-000, Diamantina, MG, Brasil
e-mail: grazziot@yahoo.com.br
REFERENCES
Alef K, Nannipieri P. Methods in applied soil microbiology
and biochemistry. London: Academic Press; 1995.
Anderson JPE, Domsch KH. The metabolic quotiente (qCO2) as a specific activity parameter to assess the effects of environmental conditions, such as pH, on the microbial biomass of forest soils. Soil Biology & Biochemistry 1993; 25(3): 393-395. http://dx.doi.org/10.1016/0038-0717(93)90140-7.
Araújo EA, Ker JC, Neves JCL, Lani JL. Qualidade do solo: conceitos, indicadores e avaliação. Applied Research
& Agrotechnology 2012; 5(1): 187-206.
Araújo JEVL, Mendonça CV Fo, Santos JB, Carvalho FP. Infestação de Mimosa gemmulata Barneby em áreas entre talhões de eucalipto de Cerrado em sucessão secundária.
Revista Árvore 2014; 38(3): 415-422. http://dx.doi.
org/10.1590/S0100-67622014000300003.
Bispo FHA, Silva AC, Vidal-Torrado P. Highlands of the upper Jequitinhonha Valley, Brazil. I – Characterization and classification. Revista Brasileira de Ciencia do Solo 2011; 35(4): 1069-1080.
Duan B, Zhang Y, Xu G, Chen J, Paquette A, Peng S. Long-term responses of plant growth: soil microbial communities and soil enzyme activities to elevated CO2 and neighbouring plants. Agricultural and Forest
Meteorology 2015; 213: 91-101. http://dx.doi.org/10.1016/j.
agrformet.2015.06.017.
Frazão LA, de Cassia Piccolo M, Feigl BJ, Cerri CC, Cerri CEP. Inorganic nitrogen, microbial biomass and microbial activity of a sandy Brazilian Cerrado soil under different land uses. Agriculture, Ecosystems & Environment 2010; 135(3): 161-167. http://dx.doi.org/10.1016/j.agee.2009.09.003.
Hu Y-F, Peng J-J, Yuan S, Shu X-Y, Jiang S-L, Pu Q et al. Influence of ecological restoration on vegetation and soil microbiological properties in Alpine-cold semi-humid desertified land. Ecological Engineering 2016; 94: 88-94. http://dx.doi.org/10.1016/j.ecoleng.2016.05.061.
Islam KR, Weil RR. Soil quality indicator properties in mid-Atlantic soils as influenced by conservation management.
Journal of Soil and Water Conservation 2000; 55(1): 69-78.
Jenkinson DS, Powlson DS. The effects of biocidal treatments on metabolism in soil-V. A method for measuring soil biomassa. Soil Biology & Biochemistry 1976; 8(3): 209-213. http://dx.doi.org/10.1016/0038-0717(76)90005-5.
Joergensen RG. The fumigation incubation method. In: Alef K, Nannipieri P, editores. Methods in applied
soil microbiology and biochemistry. London: Academic
Press; 1995.
Kaschuk G, Alberton O, Hungria M. Quantifying effects of different agricultural land uses on soil microbial biomass and activity in Brazilian biomes: inferences to improve soil quality. Plant and Soil 2011; 338(1-2): 467-481. http:// dx.doi.org/10.1007/s11104-010-0559-z.
Monteiro RTR, Frighetto RTS. Determinação da umidade, pH e capacidade de retenção de água do solo. In: Frighetto RTS, Valarini PJ, editores. Indicadores biológicos e bioquímicos
da qualidade do solo: Manual técnico. Jaguariúna. Embrapa
Meio Ambiente; 2000.
Moreira FMS, Siqueira JO. Microbiologia e bioquímica do solo. 2 ed. Lavras: Universidade Federal de Lavras; 2006.
Odum EP. The strategy of ecosystems development. Science 1969; 164(3877): 262-270. PMid:5776636. http://dx.doi. org/10.1126/science.164.3877.262.
Paz‐Ferreiro J, Fu S. Biological indices for soil quality evaluation: perspectives and limitations. Land Degradation
& Development 2016; 27(1): 14-25. http://dx.doi.
org/10.1002/ldr.2262.
Pezarico CR, Vitorino ACT, Mercante FM, Daniel O. Indicadores de qualidade do solo em sistemas agroflorestais.
Revista de Ciências Agrárias 2013; 56(1): 40-47. http://
dx.doi.org/10.4322/rca.2013.004.
Santos JV, Varón-López M, Soares CRFS, Leal PL, Siqueira JO, Moreira FMS. Biological attributes of rehabilitated soils contaminated with heavy metals. Environmental
Science and Pollution Research International 2016; 23(7):
6735-6748. PMid:26662102. http://dx.doi.org/10.1007/ s11356-015-5904-6.
Silva RRD, Silva MLN, Cardoso EL, Moreira FMDS, Curi N, Alovisi AMT. Biomassa e atividade microbiana em solo sob diferentes sistemas de manejo na região fisiográfica Campos das Vertentes-MG. Revista Brasileira de Ciencia
do Solo 2010; 34(5): 1585-1592. http://dx.doi.org/10.1590/
S0100-06832010000500011.
Souza LM, Faria RAVB, Botelho SA, Fontes MAL, Faria JMR. Potencial da regeneração natural como método de restauração do entorno de nascente perturbada. Cerne 2012; 18(4): 565-576. http://dx.doi.org/10.1590/S0104-77602012000400006.
Valentin JL. Ecologia numérica: uma introdução à
análise multivariada de dados ecológicos. Rio de Janeiro:
Interciência; 2000.
Walkley A, Black IA. An examination of the Degtjarref method for determining soil organic matter, and a proposed modification of the chromic acid titration method. Soil Science 1934; 37(1): 29-38. http://dx.doi. org/10.1097/00010694-193401000-00003.
Yusuf AA, Abaidoo RC, Iwuafor ENO, Olufajo OO, Sanginga N. Rotation effects of grain legumes and fallow on maize yield, microbial biomass and chemical properties of an Alfisol in the Nigerian savanna. Agriculture, Ecosystems
& Environment 2009; 129(1): 325-331. http://dx.doi.
org/10.1016/j.agee.2008.10.007.