Vol.49, n. 5 : pp. 785-798, September 2006
ISSN 1516-8913 Printed in Brazil BRAZILIAN ARCHIVES OF
BIOLOGY AND TECHNOLOGY A N I N T E R N A T I O N A L J O U R N A L
Floristic and Phytosociological Description of a Riparian
Forest and the Relationship with the Edaphic Environment
in Caiuá Ecological Station - Paraná - Brazil
Lysias Vellozo da Costa Filho1, Marcos Rafael Nanni2 and João Batista Campos1*
1
Instituto Ambiental do Paraná - IAP; Rua Marquês de Abrantes, 510; [email protected]; 87020-170; Maringá - PR - Brasil. 2Universidade Estadual de Maringá - UEM; Maringá - PR - Brasil
ABSTRACT
Relationship in soil physical and chemical properties of soil, floristic and phytosociological association of semi-deciduous riparian forest of the Paranapanema River (R) and Rosana Reservoir (Re) in the Caiuá Ecological Station were evaluated. Aerial photography and satellite image were used to determine the forest cover and to locate 15 transects 50 x 30m (1500m2),which were used to sample trees with diameters at breast height (DBH)≥15 cm. R contained 1487 individuals from 33 families, 64 genders and 73 species. The Shannon-weaver index (H') was 3.318. Re contained 1146 individuals from 35 families, 72 genders and 85 species and the H' was 3.755. There was a statistically significant difference (P≤0.05) between R and Re environments and statistically significant correlations (p<0.05) were detected between soil physical attributes and Importance Values (IV) using the Detrended Correspondence Analysis (DCA).
Key words: Tropical semi deciduous forest, riverine forest, multivariate analysis, riparian forest, soil-vegetation,
Caiuá Ecological Station
* Author for correspondence
INTRODUCTION
Biotic and abiotic components are important soil elements that consist of live organisms inter-mixed with the products of decomposition action. (Odum, 1988). This association between organisms and the geological or mineral substratum, interacting with each other, constitute the landscape. The result of this interaction can be observed in the various types of forest formations (Jacomine, 2000). In the tropics many factors have been attributed to the distribution and diversity of plant species. Some authors attribute this diversity to edaphic-climatic variation, while others attribute the diversity to stochastic events (Shariff et al., 1990).
However, generally distribution and diversity of plants is attributed to climatic and pedological variations (Eletrosul, 1986; Härdtle et al., 2003). In tropical regions the semi-deciduous forest is a type of forest, composed of meso-phanerophyte that covers, in general, sand-dystrophic soils (IBGE, 1992).
exclusion of certain species. Therefore, the high diversity in the riparian areas is associated with the physical and chemical substratum variability and the interaction between the topography and hydrological regime of the watershed (Soares and Perez-Filho, 1997).
Information about the floristic composition, the forest structure, sucessional categories and other phytosociological relationships can be found in several published papers (ELETROSUL, 1986; Cezar and Leitão-Filho, 1990; Soares and Silva, 1990; Goetzke, 1990; Martins, 1993; Campos and Souza, 1997; Souza, 1998; Jacomine, 2000; Fonseca and Rodrigues, 2000; Campos et al., 2000; Campos and Souza, 2002; Härdtle et al., 2003). However, many current studies address the relationships between vegetation and the physical environment, especially in relationship to soil condition.
One of the current objectives is to improve scientific knowledge base which cont be used as a basis for allocating government subsides for the
reclamation of marginal agricultural lands. This study addressed the information fragmentation phytosociological and soil data in a semi-deciduous forest in two different riparian environments. The information was used to verify the possible relationship between the physical environment and vegetation structure.
MATERIALS AND METHODS
Site description
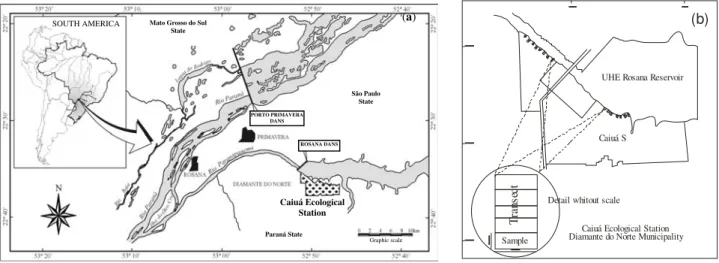
The study sites are located in the Caiuá Ecological Station (CaiuaES) in the Diamante do Norte municipality (22º41'00" S and 52º 55'00"W) and an altitude of 240 to 380 m. The total area is 1,427.300 ha, and it is located in the lower watershed of the Paranapanema River at the shore of the Rosana Hydroelectric Dams (RosanaHD) and in the last lotic portion of the Paranapanema River (Fig. 1(a)).
UHE Rosana Reservoir
Caiuá S
Detail whitout scale
Caiuá Ecological Station Diamante do Norte Municipality Sample
T
ra
ns
ec
t
(b)
Figure 1 - Map of the study area - Caiuá Ecological Station (a) and locations of the transects at the CaiuaES (b).
The vegetation of the CaiuaES, according to the IBGE (1992) classification, has a primary association with a semi-deciduous Forest. In the
CaiuaES the submontane formation is
predominanting (78.36%), with a small alluvial formation (0.58%) influenced by periodic flooding of the Paranapanema River. The remaining areas are of secondary vegetation (IAP, 1997). Agricultural areas are composed primarily of pastures, cassava and coffee plantations and surround the CaiuaES.
According to the climatic classification of Koeppen, the climate is Cfa - meso-thermic, wet, without a dry season and warm summers. The mean temperature of the coolest month is under 18ºC and the mean temperature of the warmest month is over 22ºC (Maack, 2002).
The Caiua sandstone material (Sao Bento series— Cretacean) makes up most of the soil in the CaiuaES. The relief in the CaiuaES is divided into three characteristic components: the alluvial portion in the shore region of the Paranapanema River, the valley with undulating or strongly
(a)
SOUTH AMERICA Mato Grosso do Sul State
São Paulo State
ROSANA DANS PORTO PRIMAVERA
DANS
Caiuá Ecological Station
Paraná State
Graphic scale
undulating slopes, and the high surfaces of the plateau which represent different sublevels in relief (IAP, 1997).
Sampling methodology and survey
An orbital image from the sensor TM+ of Landsat-7, WRS 223_076, with a passage date of May 12th, 2000 was used to determine the transect locations. Utilizing similar criteria, based on the reflectance value (INPE, 1999), a 74,5000 ha area with similar characteristics was defined among two distinct environments, namely the shore of the Paranapanema River (R) and the shore of the reservoir of the RosanaHD (Re). Both had only one forest physiognomy primarily semi-deciduous forest alluvial formations and submontane formations.
The phytosociological survey was completed in this area using the continuous parcels methods (Müller-Dombois and Ellenberg, 1974). The area was broken into a 22.500 m2 surface and divided
into 75 parcels that were each 300 m2 (10m x
30m). The parcels were established in 15 transects of five parcels each with the purpose of determining the species distribution pattern. The transects were located in two environments, eight at the Paranapanema River shore and seven at the Rosana Reservoir shore. The parcels were located perpendicular to the river and reservoir shore (Fig. 1b). Trees were identified by species, and the diameter at breast height (DBH) was recorded for all trees with a DBH greater than or equal to 15cm. The soil was collected using a composite sampling system and was collected at three different locations in each transect (parcels nº 1, 3 and 5). The samples were collected using a soil core and using a sampling distance of 0.20m beginning at 0m and ending at 1.0m.
The chemical analyses of soil included pH in CaCl2 and H2O, Al+++, H+Al+++, Ca+++Mg+, Ca++,
K+, P, C and micronutrients. The soil texture was
determined using the densiometer method according to EMBRAPA (1997).
Analysis of the structure and vegetation floristic composition
The phytosociological parameters were obtained by using the software package FITOPAC® 1.4. The density, dominance, and absolute and relative frequency were calculated. The importance value (VI), equitability index (J) and diversity index Shannon-Weaner (H') were calculated using the data (Müeller-Dombois and Ellenberg, 1974).
The successional stage of the vegetation was evaluated using the methods proposed by Budowski (1963) and by personal field observations. The species were classified using the following successional categories: pioneers (P), early secondary (ES), later secondary (LS) and without classification (WC) according to the criteria adoped by Gandolfi et al. (1995) and Ivanaukas et al. (1999).
Data analysis
The differences between the two environments (R and Re) were verified through variance analysis (P≤0.05), applied to the sample units averages of the number of individuals (nºindiv), total volume (vol), species number (S), Shannon-Weaver Index (H') and Equability Index (J), DCA1 and DCA2 axis (Palmer, [s.d.]; Lewilson; Prado, [s.d.]; Hill; Gauch, 1980) and soil texture. The presupposition of normality and homocedasticity was tested and the homocedasticity was evaluated by the Levene test and the variances were considered homogeneous when at a P-value of 0.05.
The spatial variation of the species was evaluated in the two environments according to their respective importance value (VI), through the Detrended Correspondence Analysis - DCA (Hill and Gauch, 1980). This helped to characterize the environments. This analysis was done using the statistical software PC-ORD version 2.0. The influence of soil texture in the species variation and importance values (IV) was analyzed using the Pearson's Correlation Analysis. The variance analysis and the Pearson's Correlation were executed with the support of the statistical software STATISTICA version 5.0.
RESULTS AND DISCUSSION
Soil characterization
The classification of soil in the R was a Gleisoil + Neosoil Fluvic, clay texture with little relief. The soil texture had mean values of 35% sand, 30% silt, and 35% clay (Table 2). Similar values were found by Brotel et al. (2002) and Nanni (2000) in studies conducted at the dike margin and low-lying area adjacent to Porto Rico Island and the floodplain of the high Paraná River.
The R was characterized by the presence of a red eutrophic argisoil, A moderate, sand texture, and a gently undulating relief, with a coarser soil texture and relatively less silt and clay than shown in the Neosoil of the Re (Table 1). This characteristic was mentioned by Resende et al. (2002) and found by Nanni (2000) while working with Argisoil from the Caiua Sand (Arenito Caiua). These soils have low silt contents.
Table 1 - Average values and standard deviations of soil texture in the River Environment (R) and Reservoir
Environment (Re) at the CaiuaES
Soil Texture (%)
Coarse Sand Fine Sand Silt Clay
R Re R Re R Re R Re
0-40 3.3±1.5 61.1±7.7 28.5±6.3 21.9±7.4 30.2±3.1 3.4±0.8 38.0±4.8 13.6±2.6 40-80 2.8±2.0 54.3±6.0 34.1±12.2 22.9±5.2 29.4±6.7 3.1±0.9 33.8±7.3 19.4±5.5 80-100 2.3±2.2 53.3±7.3 33.9±14.8 21.4±3.8 30.4±9.6 2.0±1.0 33.4±7.7 23.3±6.1
Mean Values* 2.8±1.9* 32.1±11.1* 30.0±6.5* 35.1±6.6*
*The average values represent the transect average (nº 8) due to soil textural composition and is shows a great discrepancy in relation to the other soil texture numbers (“outlier”).
Relative to the chemical composition, the soils of the R were acidic with a low amount of exchangeable aluminum (Al3+), characteristic of
the Neosoil Fluvic soils (Table 2). A strong anisotropy was present, caused by the deposition made by the temporal characteristics of the river
regime, responsible for the alluvium. Annually or at less frequent intervals, new layers covered the some of the pioneer plants under depositing alluvium. This often resulted in an irregular distribution of organic matter in this type of soil (Resende et al. 2002).
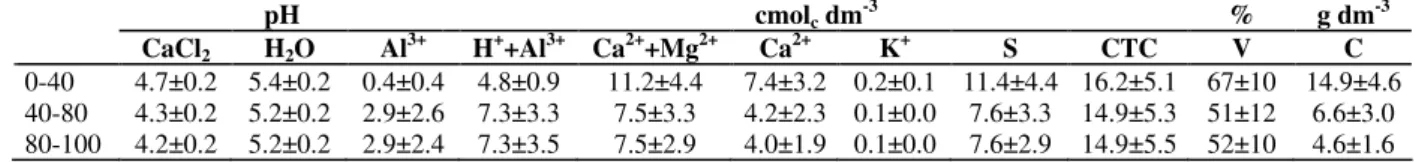
Table 2 - Average values and standard deviations of chemical analysis in the River Environment (R) at the CaiuaES
pH cmolc dm
-3
% g dm-3
CaCl2 H2O Al3+ H++Al3+ Ca2++Mg2+ Ca2+ K+ S CTC V C
0-40 4.7±0.2 5.4±0.2 0.4±0.4 4.8±0.9 11.2±4.4 7.4±3.2 0.2±0.1 11.4±4.4 16.2±5.1 67±10 14.9±4.6
40-80 4.3±0.2 5.2±0.2 2.9±2.6 7.3±3.3 7.5±3.3 4.2±2.3 0.1±0.0 7.6±3.3 14.9±5.3 51±12 6.6±3.0
80-100 4.2±0.2 5.2±0.2 2.9±2.4 7.3±3.5 7.5±2.9 4.0±1.9 0.1±0.0 7.6±2.9 14.9±5.5 52±10 4.6±1.6
The soils of the Re were less acidic than of the R and with absence of exchangeable aluminum (Al3+). This resulted in lower values for the
macro-elements, Ca and Mg, as well as making it difficult to detect organic matter. There was also a
low cation exchange capacity (CEC) and little retention of bases, characteristic of the conditions found in the Argisoils of the region (EMBRAPA, 1984).
Table 3 - Average values and standard deviations of chemical analysis in the Reservoir Environment (Re) at the
CaiuaES
pH cmolc dm-3 % g dm-3
CaCl2 H2O Al3+ H++Al3+ Ca2++Mg2+ Ca2+ K+ S CTC V C
0-40 5.8±0.7 6.5±0.6 0.0±0.0 2.1±0.4 4.1±1.1 3.2±1.2 0.2±0.2 4.3±1.2 6.4±0.8 66±9 10.0±2.0
40-80 5.6±0.7 6.4±0.7 0.0±0.0 2.0±0.4 3.0±0.7 2.2±0.8 0.1±0.0 3.1±0.8 5.1±0.6 59±8 5.0±1.3
80-100 5.5±0.6 6.3±0.6 0.0±0.0 2.1±0.3 2.8±0.6 2.0±0.5 0.1±0.0 2.9±0.6 5.0±0.5 57±7 2.9±0.5
The soil characterization and vegetative analyses of the regional landscape resulted in the
association of the Gleisoil Tiomorfic + Neosoil Fluvic soils. These had a clay texture on areas of little relief, a structure of small, sub-angular blocks, of strong consistence, plastic and viscous, and showing a transition between horizons which was diffused and gradual and with horizons A moderately acidic pH and ii) the environment Reservoir (Re), with the presence of the red eutrophic argisoils. These had horizons A moderate sand texture, moderately undulating relief, solid structure, low consistence, no plasticity or viscosity, little differentiation in the transition between horizons with slightly acid pH. Vegetation characterization
In R 1,487 individuals were sampled, belonging to 33 families, 64 genus and 73 species, including some exotic species. Similar values for the number of families (35), genus (71) and species (96) were found by Soares-Silva et al. (1998). The total density was 1,239 individuals·ha-1. Other results
for total density in forested riparian buffer areas have values of 1,935 individuals·ha-1 (Soares-Silva
et al., 1998), 1,594 individuals·ha-1 (Dias et al.,
1998), 942 individuals·ha-1 (Campos and Souza,
2002) and 1,824 individuals·ha-1 (Soares-Silva,
1990).
In the survey at R, 1,146 individuals belonging to 35 families, 72 genus and 85 species, including exotic species, were recorded. The total density was 1,091 individuals.ha-1. Durigan et al. (2000) found the same forest physiognomy, density 1,080 individuals·ha-1 of 62 species belong to 28 families
in a similar environment. Other results for total density in submontane forests registered values of 800 individuals·ha-1 (Moreno et al., 2003), 2,271
individuals·ha-1 (Ivanauskas et al., 1999) and 1,280
individuals·ha-1 (Fonseca and Rodrigues, 2000).
In R, Myrtaceae and Lauraceae were the families that represented the greatest number of species, seven and six respectively, followed by the
families Leguminosae Caesalpinoideae,
Leguminosae, and Mimosoideae. The families Euphorbiaceae and Rutaceae, with five species each, presented 20.5% of the species. Meliaceae and Rubiaceae, with four species each, 10.9% and Leguminosae and Papilionoideae with three species or 8.2% of the total. Other works in the forested riparian buffers, with the same inclusion criteria, found the same families, although in different locations. Soares-Silva et al. (1998), registered Fabaceae (10 species) followed by the Meliaceae (9), Euphorbiaceae and Myrtaceae (8), Lauraceae (7), Flacourtiaceae, Mimosaceae and
Sapindaceae (5 each). Between the phanerogams identified in the floodplain of the high Parana River (PR and MS), the families of greatest occurrence are: Fabaceae (38 species), Myrtaceae (23), Euphorbiaceae and Rubiaceae (22), Solanceae(20), Mimosaceae (18), Poaceae (15), Asteraceae and Sapindaceae (14) and Rutaceae (11), (Souza et al., 1997).
The most prevalent family was the Polygonaceae, with 214 individuals and a Relative Density (RD= 14.4%) represented only by two species, of which to be detached Triplaris americana with 213 individuals (RD=14.3%). The family Clusiaceae had the second highest occurrence with 144 individuals, but this taxon is represented exclusively by Calophyllum brasiliense (RD= 9.7%) tree species with characteristic of the alluvial flood plains ELETROSUL (1986); IAP (1997). The family Caesalpinoideae had 138 individuals distributed among the species
Holocalyx balansae (RD=0.7%), Peltophorum
dubium (RD=0.5%), Apuleia leiocarpa
(RD=0.9%), Hymenaea courbaril (RD=7.0%), and
Copaifera langsdorffii (RD=0.2%). The
Elaeocarpaceae family was also present with 120 individuals of the species Sloanea guianensis (RD=8.1%) and Cecropiaceae represented by 108 individuals of the species Cecropia pachystachya (DR=7.3%).
In the Re, the family Myrtaceae was the most numerous species (9) followed by the
Caesalpinoideae (8), representing 9.4%,
Mimosoideae (7), Papilionideae and Rutaceae (7), Meliaceae (5) and Lauraceae (4). The families represented by just one species had a species richness of 17 (48.6%). In a submontane forest, Moreno et al. (2003), found Myrtaceae, Leguminosae (lato sense) and Sapotaceae, Lauraceae and Moraceae were the most numerous species. This is in agreement with the observed results. In a submontane semi-deciduous forest Ivanauskas et al. (1999) found the most numerous species in the families Myrtaceae, followed by
Lauraceae, Euphorbiaceae, Rubiaceae and
Fabaceae, respectively. Soares-Silva (1990) recorded Myrtaceae, Meliaceae, Lauraceae, Euphorbiaceae and Fabaceae as the most numerous in species.
Lauraceae was the second most abundant with 107 individuals, representing 9.3% of the total. The family Leguminosae papilionidaea had an assemblage of 105 individuals (RD=9.2%), followed by Leguminosae Mimosoideae with 95
indíviduals (RD=8.3%) and Leguminosae
Caesalpinoideae with 85 individuals (RD=7.42). The families Leguminosae showed the greatest species richness, (21), from which Peltophorum
dubium (RD=4.7%), Parapiptadenia rigida
(RD=3.7%) and Machaerium stipitatum
(RD=3.2%) were the most prevalent species. The family Meliaceae was well represented with 88 individuals surveyed (RD=7.7%) and the family Cecropiaceae also had a high number of individuals (72) recorded (RD=6.3%). The family Cecropiaceae was represented by only one species (Cecropia pachystachya). This individual species presented the greatest relative density in the study. The diversity index (H'), in R was 3.318, similar to the values obtained by others works in stream marginal areas, as an example the indices obtained by Soares-Silva et al., (1998) H'= 3.90, Bianchini et al., (2003) H'= 3.44 Ivanauska et al. (1999), H'= 3.77 and by Botrel et al. (2002) H'= 3.734. The equability index (J) was 0.773, indicating concentration of abundance in few species, which was in agreement with the study of Brotel et al. (2002). This was possibly due to occurrence of species adapted to the fluvial regime, which was the characteristic environment of the area.
In Re, the diversity index (H') was 3.755 and the equability was 0.845, values comparable with other indices obtained in preserved semi-deciduous forests (Ivanauska et al., 1997). For example Soares-Silva (1990) obtained H'=3.69, Botrel et al. (2002) obtained H'= 3.10, Gandolfi et al. (1995) H'= 3.73 and Martins (1993) H'= 3.63. From the 73 species of the R, the first twenty largest Importance Values (IV) (Table 4) comprised 75.1% of the total number of individuals. The species that represented the greatest density was Triplaris americana with 213
individuals (RD= 14.32), followed by
Calophyllum brasiliense with 144 individuals (RD= 9.68), Sloanea guianensis with 120
representatives (RD= 8.07), Cecropia
Pachystachya with 108 representatives (RD= 7.26)
and Hymenaea courbaril with 104 representatives
(RD= 6.99) (Fig.2(a)). The species Triplaris americana was the most frequent, appearing in 92.5% of the parcels surveyed. The high frequency value indicated that the species had a wide
distribution throughout the forest, confirming the preliminary studies made in the CaiuaEE by IAP (1997). All of this species have their occurrence registered in others studies made in similar environments (ELETROSUL, 1986; Campos and Souza, 1997; IAP, 1997; Souza, 1998).
The species surveyed in the study characterize the structure of the alluvial semi-deciduous forest, and corresponded to the same species identified in other works. According to Roderjan et al. (2002) these species corresponded to the portion of the stream that was vulnerable to periodic flooding. Areas dominated by hydromorfic soils such as the
Neosoils Flúvic, Neosoils Quartzarênic
hydromórfic and Gleisoils were where these species frequently occurred. It was possible to observe the position of these species in relation to their IV, which were variable in different studies. This cont be attributed to the spatial variability of the substrate and by the higher or lower degrees of disturbance found in these environments (Campos and Souza, 2002).
Twenty of the 85 species surveyed in the Re (Table 4) accounted for 65.5% of the total IV. Cecropia pachystachya had the greatest density with 72 occurrences (RD= 6.3%), followed by Alchornea triplinervia with 71 occurrences (RD= 6.2%), Croton floribundus with 64 occurrences (Rd= 5.58%), Astronium graveolens with 59 occurrences (RD= 5.2%), Peltophorum dubium
with 54 occurrences (RD= 4.71) and
Chrysophyllum gonocarpum with 49 occurrences (DR= 4.3%). Alchornea triplinervia was the species with the greatest IV (15.26) followed by
Croton floribundus (IV= 14.96), Cecropia
pachystachya (IV= 14.91), Gallesia integrifolia
(IV= 13.97) and Astronium graveolens
(IV=13.04). These species were found in different locations in others studies carried out in similar environments. For example, César and Leitão (1990) found that Alchornea triplinervia was in 22nd position (IV=3.26), Croton floribundus was in
18th position (IV= 3.62) and Astonium graveolens
was in 15th position (IV= 6.02). Ivanauskas et al.
(1999) documented Alchornea triplinervia in 37th
position (IV=1.64). Durigan et al. (2000) found Gallesia integrifolia in 6th position (IV= 7.9),
Croton floribundus in 8th position (IV=6.6) and
Astonium graveolens in 21st position (IV=3.4). These results showed the importance to know the Importance Value (IV).
Among species with the greatest VI, the
polyneuron (DoR=5.89) is notable as it the characteristic reference species of the Semi-deciduous submontane forest, located in the Paranaense Plateau (Veloso, 1992). Aspidosperma polyneuron was found with the Ficus obtusiuscula (IV= 7.70), Lonchocarpus guilemminianus (IV= 7.22) and L. muehlbergianus (IV= 6.59) (Fig. 2b). All of these species are present in studies conducted in relatively sandier soils in riverine systems where greater fertility and water availability exist for common species found in this ecosystem (ELETROSUL, 1986; IAP, 1997; Campos and Souza, 1997; Souza et al., 1997).
There were 73 tree species found in RE. They were classified as pioneer species (12 species, 15.1%), secondary species (23 species, 31.50%), and late secondary species (27 species, 36.98%). There were 11 species (15.1%) that were unclassified.
There were 85 tree species found in Re, 13 (15.3%) of which were classified as pioneer species, 30 (32.3%) as early secondary species, 34 (40.0%) as late secondary species and 8 (9.4%) species that were unclassified.
Table 4 - Importance Value (IV) and number of the individuals surveyed (FREQ), by species in the R and Re
environments.
IV
SPECIES FREQ
ENV. (R) ENV. (Re)
Triplaris americana L. 219 29.62 2.06
Cecropia pachystachya Trec. 180 15.72 14.61
Calophyllumbrasiliense Cambess. 144 22.34
Sloanea guianensis (Aubl.) Benth. 122 24.07 1.72
Gallesia integrifolia (Spreng.) Harms 115 26. 06 13.97
Hymenaea courbaril L. 109 15.04 1.37
Zygia cauliflora (Willd.) Killip ex Record 109 10.45 6.82
Alchornea triplinervia (Spreng.) Müll. Arg. 72 0.28 15.26
Croton floribundus Spreng 70 1.14 14.96
Vochysia tucanorum Mart. 66 10.64 1.72
Ocotea diospyrifolia (Meissn.) Mez. 65 4.86 8.83
Lonchocarpus guilleminianus ( Tul. ) Malme 62 7.37 7.22
Peltophorum dubium (Spreng.) Taub. 62 2.45 11.04
Astronium graveolens Jacq. 59 13.04
Chrysophyllum gonocarpum (Mart. and Eichler) Engl. 59 2.79 11.85
Guarea guidonia (L.) Sleumer 55 7.7 8.19
Guatteria sp 55 7.89 1.47
Nectandra mollis (Kunth) Nees 54 3.47 8.28
Guarea kunthiana A. Juss. 48 1.67 8.1
Parapiptadenia rigida (Benth.) Brenan 44 0.51 8.86
Bastardiopsis densiflora (Hook. and Arn.) Hassl. 40 9.46
Lonchocarpus muehlbergianus Hassl. 38 4 6.59
Mangifera indica L. 38 0.57
Solanum sp 37 7.55
Metrodorea nigra A. St.-Hil. 35 5.36
Maytenus ilicifolia (Schrad.) Planch. 34 5.59 0.3
Miconiadiscolor Macfad. 32 5.75
Casearia gossypiosperma Briq. 25 4.62 6.48
Nectandra cissiflora Nees 25 2.3 4.35
Cassia ferruginea (Schrader) Schrader ex DC. 23 0.63
Protium heptaphyllum Aubl. March. 23 3.52
Albiziahassleri ( Chod. ) Burkart 22 3.41 4.28
Tapirira guianensis Aubl. 22 4.31 0.37
Apuleia leiocarpa (Vogel) J.F. Macbr. 20 4.85 2.45
Eugenia uniflora L. 20 3.22 2.51
Ficusobtusiuscula Miq. 20 6.7 7.7
Campomanesia xanthocarpa Berg. 19 2.17 4.4
Cont. Table 4
Actinostenom cancolor (Spreng.) Mull. Arg. 18 3.8
Trema micrantha (L.) Blume 18 0.96 2.61
Citrus aurantium L. 17 2.4 1.49
Annona cacans Warm. 16 5.02
Cedrela fissilis Vell. 16 6.26
Holocalyx balansae Micheli 16 3.43 3.03
Blepharocalyx salicifolius (Kunth) O. Berg. 14 2.64 0.8
Aspidosperma polyneuron Müll. Arg. 13 1.03 7.9
Bougainvillea glabra Choisy 12 1.2 2.73
Poecilanthe parviflora Benth. 12 2.48
Nectandrafalcifolia ( Nees ) J.A.Castigl. 11 0.29 2.55
Jacaratia spinosa (Aubl.) A. DC. 10 3.64
Machaerium stipitatum (DC.) Vogel 10 7.24
Balfourodendron riedelianum (Engl.) Engl. 9 2.37
Peschiera fuchsiaefolia (Mull.Arg.) MIers 9 0.26 1.65
Rapanea ferruginea (R. and P.) Mez 9 1.07 1.51
Celtis sp 8 1.85
Eugenia involucrata DC. 8 1.53
Cariniana estrellensis (Raddi) Kuntze 7 2.24 1.36
Chlorophora tinctoria (L.) Gaudich. ex Benth. 7 0.62 1.32
Diatenopteryx sorbifolia Radlk. 7 1.61
Meliaazedarach L. 7 1.99 1.93
Myrciaria tenella (DC.) O. Berg. 7 1.22 0.92
Plinia rivularis (Camb.) Rotman 7 0.87 1.63
Pouteria caimito (Ruiz and Pav.) Radlk. 7 4.08
Pterogyne nitens Tul. 7 1.83
Zanthoxylumrhoifolium Lam. 7 0.28 1.43
Acrocomia aculeata (Jacq.) Lodd. ex Mart. 6 2.75
Citrus sp1 6 0.78 0.70
Copaifera langsdorffii Desf. 6 3.23 2.68
Cordia trichotoma (Vell.) Arráb. ex Steud. 6 1.82
Inga fagifolia G. Don 6 1.61
Syagrus romanzoffiana (Cham.) Glassman 6 0.3 2.16
Inga uruguensis Hook. and Arn. 5 0.33 1.49
Mezilaurus sp 5 1.87
Psidiumguajava L. 5 0.9
Cabralea canjerana (Vell.) Mart. 3 1.04
Colubrina glandulosa Perkins 3 0.34 0.66
Trichilia hirta L. 3 1.07
Acacia polyphylla DC. 2 0.58
Allophylus edulis (A. St.-Hil., Cambess. and A. Juss.) Radlk. 2 0.3 0.29
Anadenanthera macrocarpa (Benth.) Brenan 2 0.44
Campomanesiaguazumaefolia Blume 2 0.6
Coussarea platyphylla Müll. Arg. 2 0.35
Esenbeckia febrifuga (A. St. Hil.) A. Juss. ex Mart. 2 0.36 0.32
Machaerium aculeatum Raddi 2 1.46
Maytenus alaternoides Reissn. 2 0.25 0.29
Monimia sp 2 0.42
Myrciaria trunciflora O. Berg 2 0.26 0.56
Myroxylon peruiferum L.f. 2 0.58
Ruprechtia laxiflora Meisn.. 2 0.27 0.29
Schizolobium parahyba (Vell.) S.F. Blake 2 1.23
Sweetia fruticosa Spreng. 2 0.27 0.3
Aegiphila sellowiana Cham. 1 0.31
Aspidosperma cylindrocarpon Müll. Arg. 1 0.41
Casearia decandra Jacq. 1 0.29
Cont. Table 4
Citrus sp 1 0.25
Cordia ecalyculata Vell. 1 0.31
Croton urucurana Baill. 1 0.25
Didymopanaxmorototoni ( Aubl. ) Decne. and Planch. 1 0.45
Enterolobium contortisiliquum (Vell.) Morong 1 0.43
EugeniapyriformisCambess. 1 0.36
Genipa americana L. 1 0.3
Helietta apiculata Benth. 1 0.47
Quillaja brasiliensis (A. St.-Hil. and Tul.) Mart. 1 0.26
Roupala brailiensis Klotzsch 1 0.34
Securinegaguaraiuva Kuhlm. 1 0.51
Comparative analysis between the R and Re.
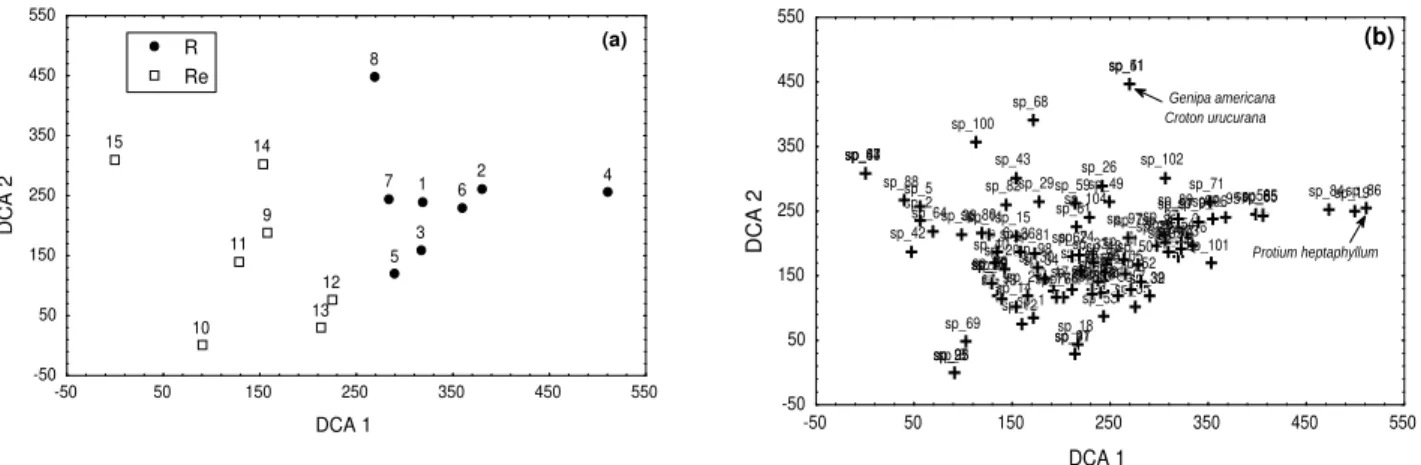
The structure of the tree community in the different environments, R and Re showed differences in various attributes. The Re area had a greater number of species, families and specific diversity. Dimensions of relationships between species in the community, like abundance, frequency and dominance (represented by category IV) were summarized using the Detrended Correspondence Analyses (DCA), which created the axis DCA1 with auto value (λ) = 0.57180, and the DCA2, auto value (λ) = 0.33225. Results showed that the distribution of transects was well- defined for the distribution of the characteristic species from each environment studied. Transects of the sampled area were separated into two distinct groups: the first composed by transects 1-8 for R and the second for transects 9 -15 for the Re (Fig. 3a).
There were species that were characterized in transects, mainly those species that were identified in only one transect. For example, Croton
urucurana and Genipa americana (sp_41 and
sp_51) were sampled only in transect 8, Protium heptaphyllum (sp_86) was sampled only in transect 4 and Enterolobium contortisiliquum (sp_44), Machaerium aculeatum (sp_63) and Psidium guajava (sp_87) were sampled only in transect 15 (Fig. 3b).
The relationships between vegetation and edaphic characteristics in the environment were generally characterized by the transect and distribution of the species. Dynamic processes, involved in shaping the composition of forest communities
provided a theoretical framework for
understanding how riparian vegetation developed (Neiff, 1986; Reichardt, 1989; Rodrigues, 1991; Soares and Perez-Filho, 1997; Campos and Souza 2002). The physical and chemical properties of the soil were also important attributes (Kramer, 1975; Odum, 1988 and Richard, 1998). This study used soil texture to help in determining the relationship between soil and vegetation in the environment. The two areas, R and Re, were significantly different (P<0.05) in soil texture and the DCA1 axis, which represented category VI of the indicator species in the transects. The correlation between soil texture and the DCA1 scores were evaluated by Pearson’s Correlation Analysis showing a statistically significant (p<0.05) between the factors, (soil texture and sites).
0 1 0 2 0 30 40 50 60 7 0 80
T ri pl ar i s am er ic ana
G al le s i a in te gri fol ia
Slo ane a gui an ens is
C a lo phy ll um b r as i l ie ns e
C ec r op ia p ac h ys tac hya
H ym e nae a c ou rb ari l
Voc hy s i a tu c an oru m
Z y gi a c a ul ifl ora
G uatteri a s p
G ua rea g ui don ia
So la num s p
Lo nc h oc a rpu s gui l le m in ia nus
F ic us ob tus iu s c u la
M i c on ia d ys c ol or
M ay te nus i l ic ifl ora
O c otea d io s py ri fol ia
A pul ei a l ei oc a rpa
C a s ea ri a gos s y pi os p erm a
T api r ir a gui an ens is
Pou te ri a c ai m i to
O utras E s p é c ie s
V I
D R D o R F R
0 20 40 6 0 8 0 10 0
Al cho rn ea tri pl i ner vi a
C roton fl or ib und us
C ec ro pi a pac hys ta c hya
G al l esi a i ntegr i fo li a
As tr on iu m g rav eo le ns
C hry so phy ll um go noc ar pum
Pel to pho ru m d ub i um
Bas tar di op s i s den s i fl or a
Par ap ip ta den ia r i gi da
O c otea di os pyr i fo li a
N ectan dr a m ol li s
G u ar ea gu id oni a
G ua re a kun th ia na
A spi do s pe rm a p ol yne ur on
F i cus o b tus i us c ul a
M ac h aer i um stip itatum
L onc hoc ar pus g ui ll em i ni an us
Z yg ia c aul i fl or a
L onc hoc arp us m ue hl b er gi an us
C as e ar ia g oss ypi os per m a
O utr as
Es p é c ie s
V I
D R D o R F R
DCA 1
D
C
A
2 1 2
3 4 5 6 7 8 9 10 11 12 13 14 15 -50 50 150 250 350 450 550
-50 50 150 250 350 450 550
R Re (a) DCA 1 D C A 2 sp_1 sp_2 sp_3 sp_4 sp_5 sp_6 sp_7 sp_8 sp_9 sp_10 sp_11 sp_12 sp_13sp_14 sp_15 sp_16 sp_17 sp_18 sp_19 sp_20 sp_21sp_22 sp_23 sp_24 sp_25 sp_26 sp_27 sp_28 sp_29 sp_30 sp_31 sp_32 sp_33 sp_34 sp_35 sp_36 sp_37 sp_38 sp_39 sp_40 sp_41 sp_42 sp_43 sp_44 sp_45 sp_46 sp_47 sp_48 sp_49 sp_50 sp_51 sp_52 sp_53 sp_54 sp_55 sp_56 sp_57 sp_58 sp_59 sp_60 sp_61 sp_62 sp_63 sp_64 sp_65 sp_66 sp_67 sp_68 sp_69 sp_70 sp_71 sp_72 sp_73 sp_74 sp_75 sp_76
sp_77 sp_78sp_79 sp_80 sp_81 sp_82 sp_83 sp_84 sp_85 sp_86 sp_87 sp_88 sp_89 sp_90 sp_91 sp_92 sp_93
sp_94sp_96sp_95 sp_97 sp_98 sp_99 sp_100 sp_101 sp_102 sp_103 sp_104 sp_105 -50 50 150 250 350 450 550
-50 50 150 250 350 450 550
Genipa americana Croton urucurana
Protium heptaphyllum
(b)
Figure 3 - Ordination of the scores derivative from the Detrended Correspondence Analyses (DCA),
involving the results of the IV by environments (a) and by species (b).
areia (grama/kg) D C A 1 -50 50 150 250 350 450 550
100 200 300 400 500 600 700 800 900 1000 Regressão
95% intervalo de confiança Re
R (8)
r=0,69; p < 0,05 R (4) (a) silte (grama/kg) D C A 1 -50 50 150 250 350 450 550
0 50 100 150 200 250 300 350 400 Regressão
95% intervalo de confiança
Re
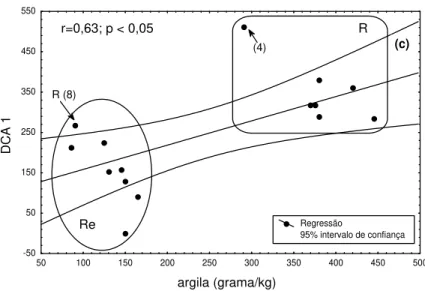
argila (grama/kg)
D
C
A
1
-50 50 150 250 350 450 550
50 100 150 200 250 300 350 400 450 500 Regressão
95% intervalo de confiança
Re
r=0,63; p < 0,05 R
(4)
R (8)
(c)
Figure 4 - Pearson’s Correlation between the DCA axis and the soil texture: (a) sand; (b) silt and (c) clay
CONCLUSION
The ordination process based on Detrended Correspondence Analyses (DCA) summarized parameter of category VI and demonstrated the relationship between the vegetation and edaphic features analyzed in this study through a comparison of soil texture and vegetation distribution in the different systems. Descriptive characteristics of the community, such as richness, abundance and biomass did not differentiate significantly between environments but helped in the characterization of the environments of R and Re. The factors of the phytosociological relationships between the species in the one community, such as dominance, frequency and abundance, represented by the IV, help to characterize the environment. Croton urucurana,
Genipa americana, Protium heptaphyllum,
Enterolobium contortisiliquum and Machaerium
aculeatum were shown to be indicator species in the environment.
It was possible to define a vegetation matrix associated with the different environments. Possible future complementary studies would include collection of a more comprehensive set of edaphic characteristics. This would help in the better understanding of the dynamics of the
ecosystem and the development forest
communities. The definition of the matrices in this study contributed to the species selection processes. This is an important element in
rehabilitation projects of similar forested ecosystems.
RESUMO
Das análises das propriedades física e química dos solos, da florística e da fítossociológica da vegetação arbórea de fragmentos da floresta estacional semidecidual localizados às margens do Rio Paranapanema (R) e do Reservatório de Rosana (Re) na Estação Ecológica do Caiuá (22°41'S e 52°55'W), verificou-se as correlações vegetação x solo. Utilizou-se fotografias aéreas e imagens de satélite para determinar a similaridade da cobertura florestal e alocar 15 transectos de 50m x 30m (1500m2) cada, amostrou-se os
REFERENCES
Bianchini, E.; Popolo, R. S.; Dias, M. C. and Pimenta. J. A. (2003), Diversidade e estrutura de espécies arbóreas em área alagável do município de Londrina, Sul do Brasil. Acta Botânica Brasílica, 17: (3), 405-419.
Brotel, R. T.; Oliveira-Filho, A. T.; Rodrigues L. A. and Curi, N. (2002), Influência do solo e topografia sobre as variações da composição florística e estrutura da comunidade arbórea-arbustiva de uma floresta estacional semidecidual de Ingaí, MG.Revista Brasil. Bot., 25: (2), 195-213.
Budowski, G. (1963), Forest Sucession in Tropical Lowlands. Turrialba.13: (1), 42-44,
Campos, J. B.; Romagnolo, M. B. and Souza, M. C. (2000), Structure, composition and spatial distribution of tree species in a remnant of the semi deciduous seasonal alluvial forest of the upper paraná river floodplain. Brazilian Archives of Biology and Technology, 43: (2), 185-194.
Campos, J. B. and Souza, M. C. (2002), Arboreous Vegetations of an alluvial riparian forest an their soil relations: Porto Rico Island, Paraná River, Brazil.
Brazilian Archives of Biology and Technology, 45:
(2), 137-149
Campos, J. B. and Souza, M. C. (1997), Vegetação. In: Vazzoler, A. E. A. M.; Agostinho, A. A. and Hahn, N.S. (Eds.). A planície de inundação do Alto Rio Paraná: aspectos físicos, biológicos e socioecômicos.
Maringá: EDUEM. pp. 331-342.
Cesar, O. and Leitão-Filho, H. F. (1990), Estudo fitossociológico de mata mesófila semidecídua na Fazenda Barreiro Rico, Município de Anhembi, SP.
Revista Brasileira de Biologia, 50: (2), 443-452.
Dias, M. C.; Vieira, A. O. S.; Nakajima, J. N.; Pimenta, J. A. and Lobo, P. C. (1998), Composição florística e fitossociológia do componente arbóreo das floresta ciliares do Rio Iapó, na bacia do Rio Tibagi, Tibagi, PR. Revista Brasileira de Botânica, 21: (2), 183-195.
Durigan, G.; Franco, G. A. D. C.; Saito, M. and Baitello, J. B. (2000), Estrutura e diversidade do componente arbóreo da floresta na Estação Ecológica dos Caetetus, Gália, SP. Revista Brasileira de Botânica, 23: (4), 371-383.
Eletrosul (1986), Ilha Grande - a vegetação da área de influência do reservatório da Usina Hidrelétrica de Ilha Grande (PR/MS). - (Levantamento na escala
1:250.000). Florianópolis. 52 pp.
Embrapa (1984), Levantamento e reconhecimento dos solos do Estado do Paraná. Londrina. EMBRAPA;
IAPAR.
Embrapa (1997), Manual de métodos de análise de solos. Rio de Janeiro.
Embrapa (1999), Sistema brasileiro de classificação de solos. Brasília: SPI. 412 pp.
Fonseca, R. C. B. and Rodrigues, R.R. (2000), Análise estrutural e aspectos do mosaico sucessional de uma floresta semidecídua em Botucatu, SP. Scientia Forestalis, 57, 27-43.
Gandolfi, S.; Leitão-Filho, H. F. and Bezerra, C. L. (1995), Levantamento florístico e caráter sucessional das espécies arbustivo-arbóreas de uma floresta mesófila semidecidua no Município de Guarulhos, SP. Revista Brasileira de Biologia, 55: (4), 753-767.
Goetzke, S. (1990), Estudo fitossocilógico de uma sucessão secundária no noroeste do Paraná, proposta para recuperação de áreas degradadas.
Tese (Mestrado) Universidade Federal do Paraná, Curitiba, Paraná, Brasil.
Härdtle, W.; von Oheimb, G. and Westphal, C. (2003), The effects of light and soil considitons on the species richness of the ground vegetation of deciduous forest in orthern Germany (Schelswig-Holstein). Forest Ecology and Management, 182, 327-338.
Hill, M. O. and Gauch Jr., H. G. (1980), Detrended corresponde analysis: an improved ordination technique. Vegetatio, 42, 47-58.
Instituto Ambiental do Paraná. (1997), Plano de manejo da Estação Ecológica do Caiuá, Diamante do Norte - PR.Paranavaí: IAP.
Fundação Instituto Brasileiro de Geografia e Estatística (1992), Manual técnico da vegetação brasileira.Rio
de Janeiro, IBGE. 92 pp. (Manuais Técnicos em Geociências; 1).
Ivanauskas, N. M.; Rodrigues, R. R. and Nave, A. G. (1999), Fitossociologia de um Trecho de Floresta Estacional Semidecidual em Itatinga, São Paulo, Brasil.Scientia Florestalis, 56, 83-99.
Jacomine, P. K. T. (2000), Solos Sob Matas Ciliares. In: Rodrigues, R. R. and Leitão Filho, H. F. (Eds.).
Matas ciliares, conservação e recuperação. São
Paulo: EDUSP. pp. 27-31.
Kramer, P. J. (1975), Plant and soil water relationships - a modern synthesis. 2. ed. New Delhi:
McGraw-Hill. 482 pp.
Lewilson, T. M. and Prado, P. I. K. L. [19--], O uso de análises multivariadas ecológicas em estudos ambientais interdisciplinares. FAPESP - Projeto
Temático. Processo 93/3510-4. Disponível em: http://nepam.unicamp.br/publicacoes/material/cadern o5.pdf. Acesso em: 23 abr. 2004.
Maack, R. (2002), Geografia física do Estado do Paraná. 3. ed. Curitiba: Imprensa Oficial do Paraná.
438 pp.
Martins, F. R. (1993), Estrutura de uma floresta mesófila. Campinas: Unicamp. 246 pp.
Muller-Dombois, D. and Ellenberg, H. (1974), Aims and methods of vegetation ecology. New York: John
Willey and Sons. 547 pp.
Nanni, M. R. (2000), Capítulo I. Caracterização do meio físico. In: Instituto de Tecnologia e Ciência
Ambiental. Zoneamento ecológico econômico da APA do Rio Paraná. Maringá: ITCA. pp. 1-73.
(Relatório Técnico).
Nanni, M. R. (1995), Delimitação de unidades fisiográficas para estudo de solos utilizando análise multivariada e técnicas de sensoriamento remoto.,
Dissertação (Mestrado) - Universidade Federal do Paraná, Curitiba, Paraná, Brasil.
Neiff, J. J. (1986), Las grandes unidades de vegetacion y ambiente insular del rio Paraná em el tramo Candelária - Ita Itabe. Revista de la associcion de ciencias naturales del litoral. Argentina, 17: (11), 7-13.
Odum, E. P. (1988), Ecologia. Rio de Janeiro:
Guanabara Koogan. pp. 434.
Palmer, M. W. [19--], Ordination methods for ecologists. Botany Department, Oklahoma State
University. Disponível em: http://www.okstate.edu/ artsci/botany/ordinate/overview.htm#Correspondence %20Analysis. Acesso em: 23 abr. 2004.
Reichardt, K. (1989), Relações água - solo - planta em mata ciliar. In Barbosa, L. M. (Coord.) Simpósio sobre Mata Ciliar. Anais... Campinas. Fundação
Cargill. pp. 20-24.
Resende, M.; Curi, N.; Rezende, S. B. and Corrêa, G. F. (2002), Pedologia: base para distinção de ambientes.
4. ed. Viçosa: Neput. 338 pp.
Richard, P. W. (1998), The Tropical Rain Forest - an Ecological Study. 2. ed. Cambridge: Cambridge
University Press. 575 pp.
Roderjan, C. V.; Galvão, F.; Kuniyoshi, Y. S. and Hatschbach, G. G. (2002), As unidades fitogeográficas do Estado do Paraná. Ciência e Ambiente, 24, 75-92.
Rodrigues, R. R. (1991), Análise de um remanescente de vegetação natural as margens do rio Passa Cinco Ipeuna, SP.Tese (Doutorado) - Instituto de Biologia,
Universidade Estadual de Campinas, São Paulo, Brasil.
Shariff, A. H. M.; Miller, H. G. and Appanah, S. (1990), Soil fertility and tree species diversity in two malaysian forests.Journal of Tropical Forest Sciense, 3: (4), 308-317.
Soares, P. R. B. and Perez-Filho, A (1997), Recomposição de mata ciliar em planícies de inundação - proposta metodológica. In: Simpósio Nacional de Recuperação de Áreas Degradadas, 3., Ouro Preto. Anais ... Ouro Preto. pp. 14-26.
Soares-Silva, L. H. (1990), Fitossociologia arbórea da porção norte do Parque Estadual Mata dos Godoys, Londrina - PR. Dissertação (Mestrado em Ciências
Biológicas) - Universidade Federal do Paraná, Curitiba, Paraná, Brasil.
Soares-Silva, L. H.; Kita, K. K. and Silva, F. C. (1998), Fitossociologia de um trecho de Floresta de Galeria no Parque Estadual Mata dos Godoys, Londrina, PR, Brasil. Boletim do Herbário Ezechias Paulo Heringer, 3, 46-62.
Souza, M. C. (1998), Estrutura e composição florística da vegetação de um remanescente florestal da margem esquerda do Rio Paraná (Mata do Araldo, Município de Porto Rico, PR). Tese (Doutorado)
-Instituto de Biociências do Campus de Rio Claro, Universidade Paulista, Rio Claro, São Paulo, Brasil. Souza, M. C.; Cilinski J. and Romagnolo, M. B. [19--],
Levantamento Florístico. In: Vazzoler, A. E. A. M.; Agostinho, A. A. and Hahn, N.S. (Eds.). A planície de inundação do Alto Rio Paraná: aspectos físicos, biológicos e socioecômicos. Maringá: EDUEM.
pp. 344-368.