* Corresponding author:
E-mail: johanna.santamaria@ utadeo.edu.co
Received: January 17, 2017
Approved: August 21, 2017
How to cite: Santamaría J, Parrado CA, López L. Soil microbial community structure
and diversity in cut flower
cultures under conventional and ecological management. Rev Bras Cienc Solo. 2018;42:e0170016. https://doi.org/10.1590/18069657rbcs20170016
Copyright: This is an open-access article distributed under the terms of the Creative Commons
Attribution License, which permits
unrestricted use, distribution, and reproduction in any medium, provided that the original author and source are credited.
Soil Microbial Community Structure
and Diversity in Cut Flower
Cultures Under Conventional and
Ecological Management
Johanna Santamaría(1)*
, Carmen Alicia Parrado(1)
and Liliana López(1)
(1)
University Jorge Tadeo Lozano, Department of Biology and Environmental Sciences, Bogotá, Colombia.
ABSTRACT: Microorganisms are excellent soil quality indicators because their properties
within the soil community change quickly in response to changes in the surrounding environment. The aim of this study was to determine if the structure and diversity of soil bacterial and fungal communities were useful for discriminating cut flower cultures
under conventional (CM), ecological (EM), and intermediate (IM) management practices.
Results obtained by PCR-DGGE revealed that bacteria had lower similarity in structure and higher diversity under EM than under CM. Sites under IM showed greater similarities in structure and diversity to the site under CM, although there were still significant differences between them. Fungal structure showed higher similarity among sites, with differences in diversity only between EM and CM. In the sites studied, bacteria, rather than fungi, were good indicators of changes in soil quality. The results of this study confirmed that EM and IM promote soil bacteria diversity.
Keywords: soil microbial indicators, ecological agriculture, Colombian Andes.
INTRODUCTION
The cut flower industry is a major agricultural activity in Colombia, South America, occupying 7,087 ha, being the world’s second largest flower exporting country (after
the Netherlands). This industry generates revenue of more than US$ 1 billion annually, bringing jobs and income to people in the productive regions, especially in La Sabana
de Bogotá, where 72 % of the production area is located (Asocolflores, 2015).
Approximately 5,407 ha of the land used for flower production in La Sabana de Bogotá relies heavily on conventional soil management (Parrado et al., 2011), which threatens soil quality. As a strategy for soil restoration and deceleration of soil damage, flower growers
are implementing ecological land management practices aimed at maintaining soil physical properties, optimizing nutrient cycling, minimizing fertilizer and pesticide applications, and
maximizing their use efficiency (Magdoff, 2007). Nearly 1,680 ha of cut flower farms have at least partially implemented ecological management practices (Colombia, 2004), which
means that these sites use intermediate management that includes both conventional and ecological management strategies. Even though ecological management began ten years
ago, the impact these practices have had on soil quality is not known. The soil was not previously monitored at La Sabana de Bogotá, and soil quality indicators were not measured. Microorganisms inherently affect soil functioning and play a significant role in maintaining
the micropore-macropore soil structure, organic matter decomposition, and biogeochemical cycles (Tate III, 2000). They are excellent indicators of soil quality because their activity
rates, biomass, community structure, and diversity change quickly, even before changes
are detected in physicochemical soil properties (Sharma et al., 2010). Microbial diversity has been suggested as one of the best indicators of soil quality, since diversity is related to suppression of plant diseases and to soil fertility (Wagg, 2014). Thus, management that favors greater diversity increases the probability of maintaining a community structure that ensures soil functionality.
It is important to confirm the effects of ecological management because, although
strategies of organic and ecological management are considered similar, they are not the same. In organic agriculture, one of the main purposes is to replace agrochemicals
with botanical products, whereas in ecological practices, the main objective is to increase and maintain the functionality of energy flow in the ecosystem. Considering microbial soil communities respond positively to organic management (Stagnari et al., 2014) whose
practices are very similar to those used in ecological management, our hypothesizes is that soils under ecological and intermediate management exhibit greater microbial
diversity and a different microbial community structure compared to communities in
soils under conventional management.
The objectives of this study were: to determine if EM and IM promote a different microbial
structure and higher microbial diversity in comparison to CM; and to determine if the
structure and diversity of bacterial and fungal communities can be used as the first potential indicators of soil quality to evaluate sites under different management practices
(conventional, intermediate, and ecological).
MATERIALS AND METHODS
This study was conducted at flower farms in the Eastern Cordillera of the Colombian Andes in an area known as La Sabana de Bogotá. Sites with similar Inceptisol (Soil Survey Staff, 2014), soils with sandy loam texture, and present in relatively flat relief (with slopes from 1 to 12 %) were selected for this study to mitigate the influence of these variables on microbial communities. The farms sampled are in a cold humid climate with an average annual temperature of 14 °C and rainfall between 1,000 and 2,000 mm. All of them work
The first sampling site, Farm 1 (F1), is now the only flower farm in Colombia completely under EM since 1998, with ISO 14000 certification of clean production. This site is
managed as an agro-ecosystem that has a continued presence of organic matter on the soil surface and proper use of agrochemicals (application frequency and applied
amounts are based on the agronomic recommendations). The second and third sites, Farm 2 (F2) and Farm 3 (F3), are under IM, which is characterized primarily by a significant
reduction in pesticide application rates in comparison to the rates applied in CM, and also by the application of organic fertilizers, such as compost. Nevertheless, under IM, as in CM, high rates of inorganic fertilizers are applied, and liming continues to be a
regular practice. Farm 2 and F3 began to be used for flower production in 1985 and 1981, respectively, under the CM scheme. The IM was gradually implemented in 2001 at F2 and in 1995 at F3. The last site included in this study, Farm 4 (F4), started as a flower growing area in 1977 and has always been under CM, with excessive use of inorganic
fertilizers and pesticides, liming as a regular practice, and no supply of organic matter
to the surface. Under EM, IM, and CM, fungicides and insecticides are used; however, application rates and frequencies are different for the three types of management. Under EM, biological pest control has also been implemented. The main differences in
management practices among the farms, locations and soil physicochemical properties are summarized in tables 1 and 2.
Since organic matter is one of the most important properties determining soil quality, given
its deep influence on soil physicochemical and biological properties, and considering the
yield/amount of agrochemicals applied relation as a soil quality indicator (Cambardella et al.,
2004), F1 is considered to be the site with the best soil quality, followed in order by F3, F2, and F4 (Table 1). All the sites sampled are dedicated to growing alstroemerias
(Alstroemerias sp.).
Straight line distance between F1, F2, and F3 is about 28 km, 15 km between F1 and F4, 6.8 km between F2 and F3, 12.3 km between F2 and F4, and, finally, 16.6 km between F3 and F4.
A 100 m2 plot was established on each farm for soil sampling, except in F1, where two
plots were set up. One of these plots was located in an area known as Block 1 (B1), whose history of land use includes flower production under CM from 1979 to 1997 and flower production under EM from 1998 to the present. In 1982 and 1985, 80 kg ha-1 yr-1 of pesticides with high toxicity levels, such as DI-TRAPEX and VAPAN, were applied in B1
to control Fusarium oxysporum and weeds. After 1997, the application of pesticides has never exceeded 2.2 kg ha-1 yr-1, and instead of applying them to the whole crop, as is usually done in CM and IM sites, pesticides in B1 (F1) are applied to the infected plants only. The second plot in F1, located in Block 5 (B5), has been used for flower production since 1986 and has always been under EM.
Collection and processing of soil samples were the same for all sampling sites. In each plot, three composite soil samples were collected from three transects, approximately 5 m apart and 10 m long, arranged from north to south. Each composite sample was the result of pooling four soil cores randomly taken from the surface (0.00-0.05 m) along each transect. Soil cores were obtained using a stainless steel soil sampler with 23 mm outside diameter. Samples were stored in a refrigerated cooler, transported to the laboratory, and processed within 24 h. Soil was sampled on each farm during the second week of April in 2016.
Structure and diversity of microbial communities
Differences in soil bacterial and fungal communities were evaluated by the 16S rDNA and the 18S rDNA genes, respectively, using molecular markers obtained by PCR-DGGE
(Polymerase Chain Reaction-Denaturing Gradient Gel Electrophoresis). Total DNA
reproducibility of the banding patterns obtained by the PCR-DGGE analysis. The DNA
isolation was performed using the Ultra Clean DNA kit from Mo Bio Laboratories Inc. according to manufacturer’s instructions with modifications. Briefly, 500 µL of phenol was
added to remove the excess organic matter present in the samples previously treated
with the protein precipitation reagent. After separating the phenol/aqueous phases by centrifugation, the aqueous phase was mixed with the kit´s DNA-binding salt solution. The following steps were as indicated in the instructions.
Amplification reactions were performed with a Multigene Thermal Cycler (Labnet International, Inc., USA) in a final reaction volume of 50 µL. The reaction mixtures contained 1X PCR reaction buffer, 2 mmol L-1 MgCl
2, 200 µmol L
-1 of each dNTP, 200 nmol L-1 of forward and reverse primers, 1U Taq polymerase (Promega), 400 ng µL-1 of BSA (Bioline), and 1 µL of the DNA solution. Amplicons of 566 bp were obtained from the 16S rDNA Table 1. Characteristics and management practices at the sampling sites
Characteristics/ management practices
Management system
Ecological Intermediate Conventional
F1
F2 F3 F4
Bock 1 Block 5
Location W 73° 58.049’N 4° 49.200’ W 73° 58.049’N 4°49.200’ W 74° 15.815’N 4° 50.308’ W 74° 10.765’N 4° 50.968’ W 74° 5.159’N 4° 47.505’
Soil Class Inceptisol Inceptisol Inceptisol Inceptisol Inceptisol
Topography Slightly flat relief (slopes from 3 to
12 %)
Slightly flat relief (slopes from 3 to
12 %)
Slightly flat relief
(slopes from 1 to
4 %)
Slightly flat relief
(slopes from 1 to
4 %) Slightly flat relief
Yield (stem ha-1 yr-1
) 132 132 98 112 105
Irrigation (m3 ha-1 yr-1
) 6,700 6,700 11,808 14,077 13,227
Liming (CaO) No application No application 180 55 200
Fertilization (kg ha-1 yr-1
)
Inorganic fertilizers 180.4 156 487.17 345.32 538.65
Organic fertilizers(1)
10,000*
10,000*
0 0 0
Organic fertilizers(2)
9,450 9,450 150**
200**
0
Fertilizers inputs (kg ha-1 yr-1)
Ntot 156 156 388 300 427
P 9.8 9.8 0 16.6 6.7
K 10.3 10.3 33.5 25.5 0.1
Ca 3.72 3.72 0.57 0 28.15
Mg 0.51 0.51 65.1 3.22 76.7
Chemical application for pest control (kg ha-1 yr-1)
Pesticides with high
toxicity levels 8.9 8.9 238.37 331.37 714.06
Pesticides applied
Fungicides Imidacloprid Imidacloprid Imidacloprid
Captan Imidacloprid
Imidacloprid Pyriethanil
Insecticides Clothianidin
Cyantraliniprole
Clothianidin Cyantraliniprole
Clothianidin Cyantraliniprole
Lufenuron Cyantraliniprole
Acetamiprid Cyantraliniprole Biological control
Acaricides Citric extracts Citric extracts No application No application No application
Insecticides B. thuringiensisA. californicus B. thuringiensisA. californicus No application No application No application
(1)
Such as composted horse manure. (2)
gene using primers 341 F-GC: 5´-cgcc ccg ccg cgc gcg gcg ggc ggg gcg ggg gca cgg ggg gcc tac ggg agg cag cag-3´ and 907 R: 5´-ccg tca att ctt ttg agt tt-3´ (Ishii and Fukui, 2001). A region of 350 bp from the 18S rDNA gene was amplified by the primers NS1 F: 5´-GTA GTC ATA TGC TTG TCT C3´- and GC-FUNG: 5´-CGC CCG CCG CGC CCC GCG CCC GGC CCG CCG CCC CCG CCC CAT TCC CCG TTA CCC GTT G-3´ (Hoshino and Marimoto, 2008). The following basic thermocycling program was used for all the PCR reactions: 94 °C for 3 min (1 cycle); 94 °C for 50 s, 58-49 °C for 30 s, and 72 °C for 30 s (10 cycles, decreasing one grade each cycle); 94 °C for 50 s, 48 °C for 30 s, 72 °C for 30 s, and
72 °C for 4 min (20 cycles).
A mutation detection system (D-Code Universal Mutation System, Bio-Rad, Hercules, California, USA) was used to analyze rDNA polymorphism by loading 300 ng of PCR product on a 6 % polyacrylamide/bis acrylamide 37.5:1 gel in 1X TAE. The denaturing gradient used for the 16S rDNA products was 35 to 70 %, and electrophoresis was performed for 24 h at 40 V and 60 °C. The denaturing gradient used to analyze the 18S rDNA products was 25 to 40 %, and electrophoresis was performed for 15 h at 40 V and 60 °C. For both the 16S rDNA and 18S rDNA analyses, 100 % denaturing acrylamide solution was defined as 7M urea and 40 % (v/v) deionized formamide. To visualize the DNA, the gels were stained in an ethidium bromide solution (5 µg mL-1
), and digital images were taken
using an imaging system (Gel Doc-Ittm system, UVP, Upland, California, USA).
The DGGE profiles were analyzed by Gel Compare II 5.0, Applied Maths NV software
(Sint-Martens-Latem, Belgium) to obtain a binary presence/absence table to calculate similarities
among sampling sites. To identify the samples with similar patterns, a similarity matrix was generated using the Jaccard index (Duarte et al., 2012), which was represented in a UPGMA dendrogram. This method was also used to evaluate the repetitiveness of the DGGE profiles among the composite soil samples collected from the three transects set
up in each plot sampled.
Analysis of similarity (Anosim) was used to determine if differences between DGGE profiles from different management practices were greater than differences within a particular management type. An R value greater than 0 indicates that differences are greater between management types.
A multidimensional scaling map (MDS) was generated to represent the sites sampled in two dimensions, with dissimilar farms apart from and similar farms close to one another in
the ordination space. The ability of the MDS to provide a good representation of similarity
data in a two-dimensional space was evaluated based on Kruskal´s stress values. Stress values <0.15 indicate that the ordination plots presented were useful representations of the DGGE data. Pearson correlation analysis was used to assess associations between
the MDS axis scores and data from management practices in table 1 (inorganic fertilizers, organic fertilizers such as composted plant residue, pesticides, and irrigation). This
correlation analysis was also used to test the effect of the physical properties measured in the composite soil samples in table 2 (pH, soil moisture).
Because of differences in the efficiency with which the same set of primers amplify different
templates in the PCR mixture, regular PCR-DGGE is not a proper technique to measure
RESULTS
Both the 16S and the 18S rDNA amplified products display bands with different intensities ranging from strong to weak, and they exhibit arrangements of noteworthy diversity among sampling sites that consistently affected the clustering of the profiles. The molecular patterns in technical duplicate DNA samples were reproducible (data not shown). The DGGE profiles were quite similar among the three composite soil samples collected from each plot. The similarity coefficients of the DGGE profiles obtained from the three
composite samples collected in one site ranged from 0.76 to 1.00 for the 16S rDNA
profiles and from 0.78 to 1.00 for the 18S rDNA profiles.
Effect of management on the structure and diversity of the
bacterial community
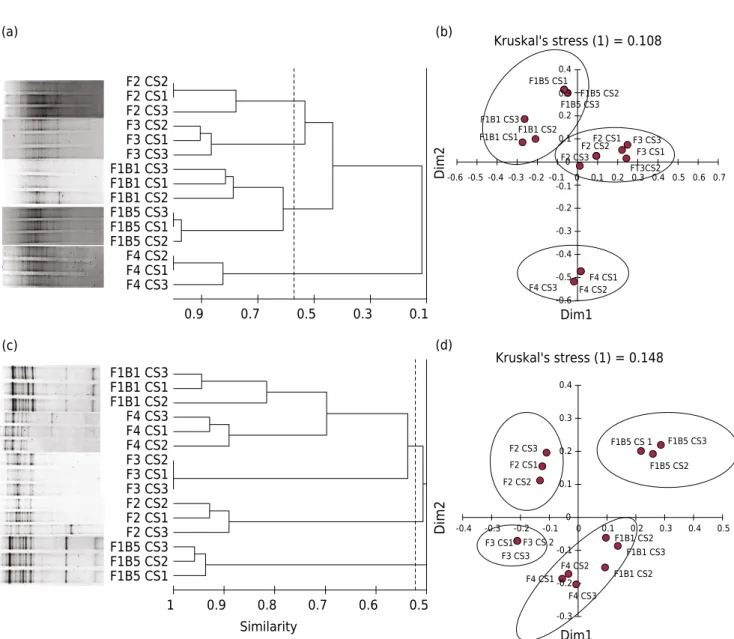
A cluster analysis based on the genetic polymorphism detected by PCR-DGGE segregated
the bacteria into three different groups corresponding to the management types evaluated (Figure 1a). Bacterial communities in soils from B5 and F4 under EM and CM, respectively, showed the greatest contrast, both in structure and diversity. The bacterial community of F4, under CM, was distinguished as a separate group, indicating that its genetic structure
is least related to that observed for the bacterial communities in the other sites. The
similarity of this site to the bacteria in soils under IM, F2 and F3, ranged from 0.1-0.2. Its similarity to the bacteria in soils from B5 and B1 under EM is lower, between 0.05 and 0.1 (Figure 1a). The similarity between sites under EM and IM was higher, ranging from 0.32 to 0.57. Anosim analysis confirmed a strong difference between the bacterial
community structures in soils under EM and IM (R =0.97, p< 0.001), soils under EM and
CM (R =1, p<0.01), and soils under IM and CM (R =1, p<0.01). Ordination of the data using MDS revealed the same three groups observed in cluster analysis (Figure 1b), and when correlation analysis is used to assess the association between axis scores and management practices, results show that practices governing the dispersion of
sampling sites along axis one include gravimetric soil moisture (R =0.95, p<0.05), irrigation (R =0.94, p<0.05), organic fertilization (R =-0.91, p<0.05), pesticides (R= 0.9,
p<0.05), and inorganic fertilization (R =-0.77, p<0.05). The dispersion along axis two is mainly explained by pH (R =0.72, p<0.05), organic fertilization (R =0.67, p<0.05), and
inorganic fertilization (R =0.58, p<0.05).
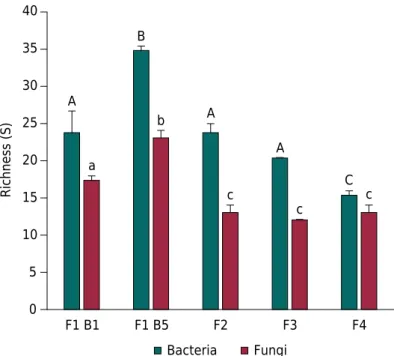
Bacterial community diversity from soils in B5 had the highest richness index (34.7 ± 0.6), and bacteria from F4 had the lowest (15.3 ± 1.2) (Figure 2). There were differences Table 2. Main soil physicochemical properties at the sampling sites
Soil properties(1)
Management system
Ecological Intermediate Conventional F1
F2 F3 F4
Bock 1 Block 5
Soil bulk density (Mg m-3) 0.99 0.99 1.11 0.98 1.09
Gravimetric moisture (%) 29.2 ± 9.5 30.3 ± 3.8 89.4 ± 4.7 84.3 ± 6.6 66.7 ± 7.8
pH 6.9 ± 0.1 7.1 ± 0.4 6.0 ± 0.3 6.5 ± 0.2 7.0 ± 0.3
Organic Carbon (g kg-1
) 92 87 2.9 79.7 13
Extractable N (mg kg-1
) 213.4 160.4 173 121.6 176.2
Extractable P (mg kg-1
) 604 346 310 158 258
Extractable K (mg kg-1
) 748 1,214 237 142 1213
EC (ds m-1
) 1.91 1.44 2.17 2.21 2.34
CEC (cmolc kg -1
) 20.5 19.3 61.0 65.3 71.5
(1)
when comparing the bacterial communities from B5 and F4 to the other sampling sites. The richness of B5 was higher than that calculated for B1, F2, F3, and F4 (p<0.05), and the diversity calculated for F4 was lower than the diversity in B5, B1, F2, and F3 (p<0.05). Bacterial communities from B1, F2, and F3 did not exhibit differences among
themselves (p>0.05).
Effect of management on the structure and diversity of the
fungal community
The collected data suggest a lower impact of the management system on the genetic
structure and diversity of the fungal community. An analysis of the 18S rDNA fragments
shows that the similarities calculated among genetic structures of the fungi from soils under CM, IM, and EM are higher than that observed for bacteria (Figure 1c). In spite of B5 being discriminated as a separate group in the cluster analysis, the similarity with
the sites under IM and CM range from 0.4 to 0.6, results that are higher than those
observed for bacteria. The B1, F2, and F3 have a higher similarity to F4, from 0.5 to 0.8. Anosim analysis confirmed differences among the fungal community structures under EM and IM (R =0.63, p<0.004), under EM and CM (R =0.48, p<0.01), and under IM and
F1B5 CS1 F1B5 CS2 F1B5 CS3 F2 CS3 F2 CS1 F2 CS2 F3 CS3 F3 CS1 F3 CS2 F4 CS2 F4 CS1 F4 CS3 F1B1 CS2 F1B1 CS1 F1B1 CS3 0.5 0.6 0.7 0.8 0.9 1 Similarity F4 CS3 F4 CS1 F4 CS2 F1B5 CS2 F1B5 CS1 F1B5 CS3 F1B1 CS2 F1B1 CS1 F1B1 CS3 F3 CS3 F3 CS1 F3 CS2 F2 CS3 F2 CS1 F2 CS2 0.1 0.3 0.5 0.7 0.9 F1B1 CS2 F1B1 CS2 F1B1 CS3 F1B5 CS 1 F1B5 CS3
F1B5 CS2 F4 CS2 F4 CS1 F4 CS3 F2 CS1 F2 CS3 F2 CS2 F3 CS3 F3 CS1 F3 CS 2
-0.3 -0.2 -0.1 0 0.1 0.2 0.3 0.4
-0.4 -0.3 -0.2 -0.1 0 0.1 0.2 0.3 0.4 0.5
Dim2
Dim1
Kruskal's stress (1) = 0.148 F1B1 CS1F1B1 CS2
F1B1 CS3 F1B5 CS1 F1B5 CS2 F1B5 CS3 F4 CS1 F4 CS2 F4 CS3 F2 CS1 F2 CS2
F2 CS3 F3 CS1
FT3CS2 F3 CS3 -0.6 -0.5 -0.4 -0.3 -0.2 -0.1 0 0.1 0.2 0.3 0.4
-0.6 -0.5 -0.4 -0.3 -0.2 -0.1 0 0.1 0.2 0.3 0.4 0.5 0.6 0.7
Dim2
Dim1
Kruskal's stress (1) = 0.108
(a) (b)
(c) (d)
CM (R =0.18, p<0.03). These differences were not as strong as for bacteria though, which is consistent with the higher similarity values observed in the cluster analysis. Ordination of the data using MDS agree with the groups observed in the cluster analysis (Figure 1d), and correlation analysis indicates that practices governing the dispersion
of sampling sites along axis one are organic fertilization (R =0.77, p<0.05), pesticides
(R =0.7, p<0.05), and irrigation (R =0.77, p<0.05). The dispersion along axis two is mainly explained by inorganic fertilization (R =0.7, p<0.05) and pH.
Richness of diversity was highest in the site under EM with no previous history of conventional management. The fungi in B5 showed a higher richness (23 ± 1) than that calculated for B1 (17.3 ± 0.6), F2 (13 ± 1), F3 (12 ± 0), and F4 (13 ± 1) (p<0.05) (Figure 2). Unlike what was observed in bacteria, there were richness differences between B1 and sites under IM, F2, and F3 (p<0.05), and also between B1 (F1) and F4 under CM (p>0.05).
DISCUSSION
Differences among the sites under CM and EM that have to do with fertilization and
irrigation, might explain much of the variation seen in the structure and diversity of
the bacteria under these two types of management. Organic materials enhance the growth, activity, and diversity of soil microorganisms, whereas mineral fertilizers do not (Tanaka et al., 2014). Indeed, previous published data have demonstrated that organic and inorganic fertilization have a differential input of carbon to the soil, which, in turn, is strongly correlated with most microbial parameters (Sradnick et al., 2013). Soils in F1 (B1 and B5) are amended with both compost and inorganic fertilizers, they remain covered with a layer of crop residue, and drip irrigation is limited to a few hours per week (Table 1). In F4, there is no compost amendment, the soil surface is devoid of crop residue,
and drip irrigation containing inorganic fertilizers is regular. It has been observed that the
combination of organic and inorganic fertilization, as seen in F1, changes the microbial
0 5 10 15 20 25 30 35 40
F1 B1 F1 B5 F2 F3 F4
Richness (S)
Bacteria Fungi
A
B
A
A
C a
b
c c
c
community structure and promotes diversity (Hartmann et al., 2015). In contrast, soil amendments with only inorganic fertilizers produce a decline in microbial populations
(Ge et al., 2010). Changes in bacteria under organic fertilization may be the result of
increases in copiotrophic microorganisms, whose growth rates are limited by the lack of available C substrates, even in soils with high C/N ratios, and which comprise the first
group of microorganisms to assimilate most of the readily available organic substrates
after they are added to the soil (Demoling et al., 2007; Kuzyakov, 2010). Changes in bacterial communities may also be due to the effects of organic fertilizer on soil structure. Zhang et al. (2014) showed that long-term applications of organic fertilizers accelerated the formation of soil aggregates, while simultaneously decreasing the oxygen diffusion coefficient, making microhabitats more suitable for anaerobes. The soil water content may
also be driving shifts in the genetic structure and diversity of the bacterial communities
under CM and EM. As the soils in F4 become more water saturated (Table 1) as a result of
constant irrigation, soil oxygen levels are reduced, restricting the type of microorganisms that are able to live under these anoxic conditions. The anaerobic environmental soil conditions in sites under CM must be reducing diversity by favoring a bacterial community formed mainly by facultative and obligate anaerobes (Ma et al., 2015).
Differences in the bacterial community structure and diversity between B1 and B5 located in F1 seem to indicate changes in the soil produced by different land use histories. These two blocks only account for 0.6 similarity between them, indicating larger differences in their
community structure than expected, despite currently being under the same management
system. The scientific literature reports that pesticides applied at recommended rates have no deleterious effects on microbial populations (Roger et al., 1994). However, when the application rates are higher than those recommended, it has been shown
that the microbial population structure changes, and its metabolic activity decreases
(Moorman, 1988). Therefore, differences between B1 and B5 might be the result of excessive pesticide applications in B1 back in the early 1980s, while B1 was still under
CM, compared to the rates that have been applied to B5. This may have caused negative
effects on the soil microbial community in B1, and although after 1997 there was no
more excess of pesticide applications, the soils in B1 have not recovered their original
microbial structure and diversity. Although the pesticide was only applied twice, there was apparently a long-term effect. Closer similarities between bacterial communities from F2 and F3 may be explained not only by the similarities in their fertilization regimes and their soil water content but also by soil pH. It is well known that pH strongly influences nutrient availability and the solubility of metals (Kemmit et al., 2006). Thus, pH has an important effect on microbial populations, especially on bacteria, which reduce their growth rates, biomass, and diversity as pH decreases (Rousk et al., 2009). Farm 2 and F3 had lower pH values than F1, probably because of their higher inputs of inorganic fertilizers (Table 1) (Heinze et al., 2010).
Practices associated with the type of management also seem to have a differential effect on the structure and richness of the fungal communities. However, although organic and inorganic fertilization practices seem to be associated with the differences among the sampling sites, this effect is not as strong as for bacteria.
Although fungal communities do not exhibit differences in diversity between sites under IM and CM, fungi show differences between the two sites under EM with different land use history. It is likely that the use of pesticides in B1 in the past also had a long-term effect on fungal communities.
CONCLUSIONS
IM, and CM. Moreover, bacterial richness distinguished soils under EM vs. CM and soils
under IM vs. CM. The results observed confirmed that ecological and intermediate (to a
lesser extent) management practices promote soil bacteria diversity.
This study did not discriminate between the bacterial richness in a soil under EM with a
previous history of excess application of pesticides vs. the soils under IM. This may be
indicating that high application rates of pesticides have had a long-term negative effect
on the bacterial communities of the sites studied.
Ecological management also favors fungal communities; however, changes in structure and richness under different management practices or different land use histories are
not as noticeable as those for bacteria.
REFERENCES
Asocolflores. Boletín estadístico - Dirección económica y logística [internet]. Bogotá: Asociación Colombiana de Exportadores de Flores; 2015. [accessed on 10 oct. 2017]. Available at: http:// asocolflores.org/aym_images/files/CENTRO_DE_DOCUMENTACION/ECONOMIA%20Y%20 LOGISTICA/BOLETINES%20ESTADISTICOS/Boletin%20Estadistico%202014%20Asocolflores.pdf Cambardella CA, Moorman TB, Andrews SS, Karlen DL. Watershed-scale assessment
of soil quality in the loess hills of southwest Iowa. Soil Tillage Res. 2004;78:237-47.
https://doi.org/10.1016/j.still.2004.02.015
Colombia. Ministerio de Medio Ambiente Vivienda y Desarrollo Territorial. Utilización de bioinsumos en Colombia: estudio de caso en flores de corte [internet]. Bogotá: Asocolflores – Cecodes; 2004 [accessed on 22 nov 2016]. Available at: http://biblovirtual.minambiente.gov. co:3000/DOCS/MEMORIA/MAVDT-0034/MAVDT-0034.pdf
Demoling F, Figueroa D, Bååth E. Comparison of factors limiting bacterial growth in different soils. Soil Biol Biochem. 2007;39:2485-95. https://doi.org/10.1016/j.soilbio.2007.05.002 Duarte S, Cássio F, Pascoal C. Denaturing gradient gel electrophoresis (DGGE) in microbial ecology - insights from freshwaters. In: Magdeldin S, editor. Gel electrophoresis - principles and basics. Rijeka: InTech; 2012 p.173-96.
Ge G, Li Z, Fan F, Chu G, Hou Z, Liang Y. Soil biological activity and their seasonal variations
in response to long-term application of organic and inorganic fertilizers. Plant Soil.
2010;326:31-44. https://doi.org/10.1007/s11104-009-0186-8
Hartmann M, Frey B, Mayer J, Mäder P, Widmer F. Distinct soil microbial diversity under long-term organic and conventional farming. ISME J. 2015;9:1177-94. https://doi.org/10.1038/ismej.2014.210 Heinze S, Raupp J, Joergensen RG. Effects of fertilizer and spatial heterogeneity in soil pH on microbial biomass indices in a long-term field trial of organic agriculture. Plant Soil. 2010;328:203-15. https://doi.org/10.1007/s11104-009-0102-2
Hoshino YT, Morimoto S. Comparison of 18S rDNA primers for estimating fungal diversity in
agricultural soils using polymerase chain reaction-denaturing gradient gel electrophoresis. Soil Sci Plant Nutr. 2008;54:701-10. https://doi.org/10.1111/j.1747-0765.2008.00289.x
Ishii K, Fukui M. Optimization of annealing temperature to reduce bias caused by a primer mismatch in multitemplate PCR. Appl Environ Microb. 2001;67:3753-5. https://doi.org/10.1128/AEM.67.8.3753-3755.2001
Kemmitt SJ, Wright D, Goulding KWT, Jones DL. pH regulation of carbon and nitrogen dynamics in two agricultural soils. Soil Biol Biochem. 2006;38:898-911.
https://doi.org/10.1016/j.soilbio.2005.08.006
Kuzyakov Y. Priming effects: interactions between living and dead organic matter. Soil Biol Biochem. 2010;42:1363-71. https://doi.org/10.1016/j.soilbio.2010.04.003
Ma L, Guo C, Lü X, Yuan S, Wang R. Soil moisture and land use are major determinants of soil
Magdoff F. Ecological agriculture: principles, practices, and constraints. Renew Agr Food Syst.
2007;22:109-17. https://doi.org/10.1017/S1742170507001846
Moorman TB. A review of pesticide effects on microorganisms and microbial processes related to soil fertility. J Prod Agric. 1988;2:14-23. https://doi.org/10.2134/jpa1989.0014
Parrado CA, Bojacá CR, Schrevens E. Exploring more sustainable technological alternatives
for the greenhouse cut flowers industry in Colombia. Acta Hort. 2011;893:1125-32. https://doi.org/10.17660/ActaHortic.2011.893.129
Roger PA, Simpson I, Oficial R, Ardales S, Jimenez R. Effects of pesticides on soil and water microflora and mesofauna in wetland ricefields: a summary of current knowledge and extrapolation to temperate environments. Aust J Exp Agr. 1994;34:1057-68.
https://doi.org/10.1071/EA9941057
Rousk J, Brookes PC, Bååth E. Contrasting soil pH effects on fungal and bacterial growth
suggest functional redundancy in carbon mineralization. Appl Environ Microb. 2009;75:1589-96. https://doi.org/10.1128/AEM.02775-08
Sharma SK, Ramesh A, Sharma MP, Joshi OP, Govaerts B, Steenwerth KL, Karlen DL. Microbial
community structure and diversity as indicators for evaluating soil quality. In: Lichtfouse E, editor. Biodiversity, biofuels, agroforestry and conservation agriculture (Sustainable Agriculture
Reviews 5). New York: Springer; 2010. p.317-58.
Soil Survey Staff. Keys to soil taxonomy. 12th ed. Washington, DC: United States Department of
Agriculture, Natural Resources Conservation Service; 2014.
Sradnick A, Murugan R, Oltmanns M, Raupp J, Joergensen RG. Changes in functional
diversity of the soil microbial community in a heterogeneous sandy soil after long-term
fertilization with cattle manure and mineral fertilizer. Appl Soil Ecol. 2013;63:23-8.
https://doi.org/10.1016/j.apsoil.2012.09.011
Stagnari F, Perpetuini G, Tofalo R, Campanelli G, Leteo F, Della Vella U, Schirone M, Suzzi
G, Pisante M. Long-term impact of farm management and crops on soil microorganisms
assessed by combined DGGE and PLFA analyses. Front Microbiol. 2014;5:644. https://doi.org/10.3389/fmicb.2014.00644
Tanaka H, Katsuta A, Toyota K, Sawada K. Soil fertility and soil microorganisms. In: Tojo S, Hirasawa T, editors. Research approaches to sustainable biomass systems. New York: Academic
Press; 2014. p.107-42
Tate III RL. Soil Microbiology. 2nd ed. New York: John Wiley and Sons; 2000.
Weller DM, Raaijmakers JM, Gardener BBM, Thomashow LS. Microbial populations responsible for specific soil suppressiveness to plant pathogens. Annu Rev Phytopathol. 2002;40:309-48. https://doi.org/10.1146/annurev.phyto.40.030402.110010
Wagg C, Bender SF, Widmer F, van der Heijden MGA. Soil biodiversity and soil community
composition determine ecosystem multifunctionality. PNAS. 2014;111:5266-70.
https://doi.org/10.1073/pnas.1320054111
Zhang H, Ding W, He X, Yu H, Fan J, Liu D. Influence of 20–year organic and inorganic
fertilization on organic carbon accumulation and microbial community structure of