The impact of eggshell colour and spot area in Japanese quails: I. eggshell
temperature during incubation and hatching results
Sema Alasahan1, Gulsen Copur Akpinar2, Sibel Canogullari3, Mikail Baylan4 1 Mustafa Kemal University, Veterinary Faculty, Department of Animal Science, Hatay, Turkey.
2 Mustafa Kemal University, Agriculture Faculty, Department of Animal Science, Hatay, Turkey.
3Nigde University, Agricultural Science and Technologies Faculty, Department of Animal Production and Technologies, Nigde, Turkey. 4 Cukurova University, Agriculture Faculty, Department of Animal Science, Adana, Turkey.
ABSTRACT - This study was carried out to investigate the effects of eggshell colour and spot properties (colour and size of the spot area) on eggshell incubation temperature and hatching outcomes of Japanese quail eggs (Coturnix coturnix japonica). Study material was allocated to five groups according to their eggshell and spot colours: black spots on greyish white coloured eggshell (I), blue spots on greyish white coloured eggshell (II), diffuse brown spots on greyish brown coloured eggshell (III), brown spots on light green coloured eggshell (IV), and small brown spots on greyish brown coloured eggshell (V). The size of the spotted area was determined in each egg group using digital image analysis. Mean relative weight losses of hatched and unhatched eggs between days 0-10 and 0-14 of embryonic development were 4.76% and 10.48% and 9.17% and 15.46%, respectively. The mean eggshell temperatures of hatched and unhatched eggs measured at the equatorial region on days 10 and 14 during embryonic development were 36.92 and 37.79 ºC and 36.84 and 37.18 ºC, respectively. Eggshell temperatures at the equatorial region on days 10 (36.89 ºC) and 14 (37.57 ºC) of embryonic development were lower than the fixed temperature of the incubator (37.6 ºC). Fertility, hatchability of fertile eggs, and hatchability and embryonic mortality ratesdo not vary in relation to eggshell colour or the size of the spotted area.
Key Words: quail, spot colour
ISSN 1806-9290
www.sbz.org.br R. Bras. Zootec., 45(5):219-229, 2016
Received January 13, 2016 and accepted February 16, 2016. Corresponding author: gulsenankara@gmail.com
http://dx.doi.org/10.1590/S1806-92902016000500003
Copyright © 2016 Sociedade Brasileira de Zootecnia. This is an Open Access article distributed under the terms of the Creative Commons Attribution License (http://creativecommons.org/licenses/by/4.0/), which permits unrestricted use, distribution, and reproduction in any medium, provided the original work is properly cited.
Introduction
Eggshell colour, which has an effect on hatching results, is one of the eggshell traits. Literature reports indicate that in various bird species, eggshell pigmentation serves as an indicator for the selection of females as well as for genetic advance achieved by means of effective mating (Stoddard et al., 2012). Eggshell pigmentation has also been reported to have an effect on the egg nutrient content and on the protection of the embryo from solar radiation during natural incubation (Moreno and Osorno, 2003; Lahti, 2008; Riehl, 2011; Cassey et al., 2012). Eggshell colour is formed by pigments that are secreted by the shell gland (Liu and Cheng, 2010).
The major pigments in bird eggs are protoporphyrin-IX, biliverdin protoporphyrin-IX, and zinc chelate. It is suggested that eggshell pigments are derived from the disintegration of erythrocytes found in the mucous layer of the shell gland.
Blood and the shell gland are considered to be the site of the biosynthesis of eggshell porphyrin (Liu and Cheng, 2010). Biliverdin, a green pigment formed during the breakdown of haemoglobin, gives the eggshell a blue or green colour, whilst protoporphyrin, an immediate precursor of heme molecule, gives the eggshell a reddish or brown colour (Miksik et al., 1994; Liu and Cheng, 2010). It has been reported that, of these pigments, biliverdin, which is found in blue-green coloured eggshells, has antioxidant properties (Moreno and Osorno, 2003; Soler et al., 2005; Siefferman et al., 2006; Zhao et al., 2006; Liu and Cheng, 2010; Morales et al., 2011; Duval et al., 2013), whilst protoporphyrin increases the resistance of the eggshell to breakage (Mikšik et al., 1996; Gosler et al., 2011; Cassey et al., 2012). Furthermore, Moreno and Osorno (2003), Liu and Cheng (2010), and Holveck et al. (2012) have reported the protoporphyrin pigment to have a pro-oxidant effect.
were correlated with each other. Richards and Deeming (2001) suggested that eggs with blue eggshell colour are structurally defective eggs with a thin eggshell. These researchers explained the low hatchability of blue coloured eggs as being due to the high weight loss resulting from their structural defection. In pheasant (ring-necked) eggs, aiming to determine the effect of eggshell colour on egg quality, hatching results, egg shape, and eggshell quality, eggs were grouped as dark brown, light brown, olive, and blue (Krystianiak et al., 2005; Kożuszek et al., 2009b; Nowaczewski et al., 2011; Nowaczewski et al., 2013). In an investigation conducted by Ristić et al. (2013) aiming to determine the effects of eggshell colour on hatching results, pheasant eggs were classified as dark brown, light brown, brown-green, and blue-green. In research on fertility, hatchability, embryonic mortality, malposition, and egg quality traits in quail eggs, eggs were classified as brown pigmented, black stained, white, spotted, and blue pigmented, according to the eggshell colour (Taha, 2011). The correlation between 12 eggshell pigmentation patterns and breeder live weight, laying interval, mean egg weight, and hatching results was investigated in quail eggs, on the basis of region of interest (ROI) images (Fayeye et al., 2013). In research carried out in quail eggs on the effect of eggshell colour on various traits, eggs were classified as white, spotted violet, and spotted brown (Farghly et al., 2015); and sienna, rich brown, and chocolate (Idahor et al., 2015).
The direct measurement of embryo temperature, which has a significant role in embryonic development, is not possible. For this reason, eggshell temperature is used as an indicator of embryo temperature (van der Pol et al., 2013). The temperature of the developing embryo depends on the temperature of the setter, heat transfer between the embryo and the setter, and heat production by the embryo (French, 1997).
This study aimed to determine the effect of eggshell colour and spot properties (colour and size of spot area) on eggshell temperature during incubation and hatching results in eggs of Japanese quail (Coturnix coturnix japonica).
Material and Methods
Hatching eggs, collected within a three-day period from a private holding raising Japanese quails, constituted the material of the study. The eggs underwent macroscopic examination at the laboratory, and broken, cracked, abnormally shaped, and soiled eggs were excluded from the study. The experiment involved 1,062 eggs from 16-wk-old Japanese quail (Coturnix coturnix japonica), which reached 95% egg production.
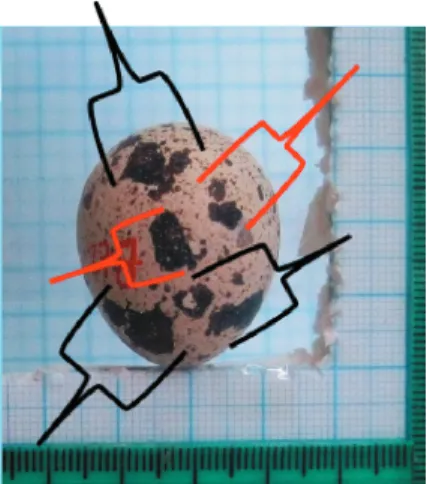
After being macroscopically examined prior to incubation, the eggs constituting the study material were allocated to five groups according to their eggshell and spot colours, and were individually numbered. The size of the spotted area was determined in each egg in all groups using the digital image analysis method (Table 1). A mechanism with a measurement scale was set up for the imaging process. The individually numbered eggs were placed in the mechanism and were imaged at an approximate distance of 20 cm. Each egg was photographed from one side, and then turned 180º to the other side to be photographed again (Figures 1 and 2). A total of 4,248 (1,062 × 4) images were taken and stored in a flash memory. Digital images were analyzed using the UTHSCSA Image Tool software at the laboratory of the Faculty of Engineering. The measurement unit used for the size of the spotted area was cm2.
No photo-manipulation was made to the images stored in the flash memory, prior to incubation. Digital images were analyzed using the sharpest images. Egg length and egg width were determined by digital image analysis, and these values were used for the calculation of the egg shape index (Figures 3 and 4). The formula given below was used for the calculation of the egg shape index:
Egg shape index (%) = (Egg width/Egg length) × 100 Prior to incubation, all eggs included in each group were individually weighed to determine egg initial weight. The eggs were randomly placed in the setter with 3 repeats, such that each tray provided for one repeat. In the setter, the temperature was set at 37.6 ºC and the relative humidity was
Table 1 - Distribution of eggs according to trial group (cm2)
Group Total Spotted area values determined by digital image
Spotted area-1 Spotted area-2 Total spotted area1
Black spots on greyish white coloured eggshell (I) 213 1.74±0.03d 1.20±0.05d 2.94±0.10d
Blue spots on greyish white coloured eggshell (II) 215 2.90±0.09c 1.98±0.07c 4.87±0.14c
Diffuse brown spots on greyish brown coloured eggshell (III) 213 4.01±0.10a 3.39±0.10a 7.40±0.10a
Brown spots on light green coloured eggshell (IV) 210 3.62±0.10b 2.78±0.09b 6.41±0.17b
Small brown spots on greyish brown coloured eggshell (V) 210 1.08±0.05e 0.92±0.04e 2.00±0.09e
1Sum of spotted area-1 and spotted area-2.
adjusted to 60-65%. On day 14 of embryonic development, individual compartments were established for the each egg included in the same group, and the hatching period was initiated by placing eggs of the same group in an individual compartment. In the hatching machine, the temperature was set at 37.2 ºC and the relative humidity was adjusted to 65-70%.
Egg weight loss was calculated using the initial egg weight and the egg weights measured on days 10 and 14 of the incubation period. Egg weight measurements were performed separately for each egg. The formulae used for egg weight measurements are shown next:
Relative egg weight loss (%) =100 × ((W0 − W1)/W0),
in which W0 = initial egg weight; and W1 = egg weight on
day of measurement.
On days 10 and 14 of embryonic development, eggshell temperature was measured in all eggs included in
each group at three different regions of the eggs, including the pointed end, blunt end, and the centre. Measurements were performed using a thermometer (Braun Thermoscan meter). During the measurement of eggshell temperature, the temperature of the room, where the setting machine was placed, was set to a temperature equal to that of the setter. Eggshell temperature was measured at the pointed and blunt ends and centre of the eggs, and the arithmetic mean of these three measurements was calculated as the regional temperature (pointed end, blunt end, and centre) of the eggshell. The average temperature of the whole egg was calculated using the formula given below:
General eggshell temperature (ºC) = (Average eggshell temperature at pointed end + Average eggshell temperature at centre + Average eggshell temperature at blunt end)/3
Eggshell thickness was calculated according to the formula given below, using the egg weight.
Figure 1 - Measurement of the size of spotted area-1.
x = 2460 y = 1418 v = [84,156,142]; area = 0.49 cm2
Figure 2 - Measurement of the size of spotted area-2.
x = 2020 y = 926 v = [138,144,164]; area = 0.74 cm2
Figure 3 - Measurement of egg length.
x = 2460 y = 1418 v = [84,156,142]; area = 0.49 cm2
Figure 4 - Measurement of egg width.
Eggshell thickness (mm) = 0.0546 × (Egg weight)0.441
(Rahn and Paganelli, 1989).
The hatching weights of the chicks were determined for all eggs included in each group. During these measurements, the eggshell weight of each hatched egg was also determined. In each group, the unhatched eggs were separated for the determination of fertilization, and fertilized eggs were examined for embryonic mortality between days 0-6 of embryonic development (black eye and conspicuous beak), days 6-17 of embryonic development (embryo with feathers and embryo with yolk out), and days 17-18 of embryonic development (full-grown embryo dead and with yolk subtracted and pipped eggs) (Aygun and Sert, 2013). These data were used for the calculation of the hatching results given below:
Fertility (%) = (Number of fertilized eggs/Number of eggs placed in the setter) × 100
Hatchability of fertile eggs (%) = (Number of hatched chicks/Number of fertilized eggs) × 100
Hatchability (%) = (Number of hatched chicks/Number of eggs placed in the setter) × 100
Relative weight loss in unhatched eggs (%) = 100 × ((W0 – W2)/W0),
in which W0 = initial egg weight; and W2 = weight of
unhatched eggs.
The statistical analysis of the data was performed using the SPSS software. The chi-square test was used to determine the effect of the eggshell colour of hatching eggs on hatchability, fertility, hatchability of fertile eggs, and embryonic mortality during incubation. The other data were compared using analysis of variance, and the groups differing from each other were determined by Duncan’s multiple comparison test.
Results
The eggs with the same eggshell colour (Groups I and II and Groups III and V) demonstrated that egg weight was higher in the groups with a larger size of spotted area (P<0.001) (Table 2). Thus, of the groups with a greyish white eggshell colour, Group I (a spotted area of 2.94 cm2)
presented an egg weight of 12.15 g, whilst Group II (a spotted area of 4.87 cm2) presented an egg weight of
12.42 g. Similarly, of the groups with a greyish brown eggshell colour, Group III (a spotted area of 7.40 cm2)
presented an egg weight of 12.35 g, whilst Group V (a spotted
area of 2.00 cm2) presented an egg weight of 11.98 g, and
thus displayed higher egg weight with larger spotted area. Egg shape index values were highest in Groups I (78.10%) and II (78.17%), and the difference between
these two groups was statistically insignificant. On the other hand, egg shape index values were lowest in Groups III (77.38%) and V (77.47%), which had a greyish brown eggshell colour, and these two groups were determined to significantly differ from each other (P<0.05).
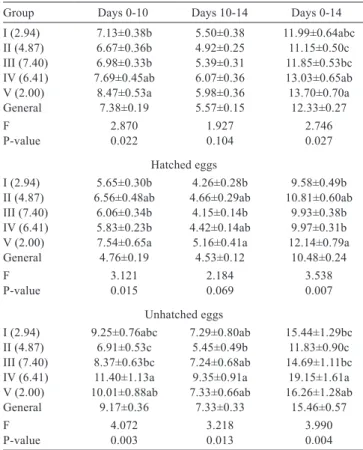
The differences between groups for the relative weight losses between days 0-10 and 0-14 of embryonic development were statistically significant (P<0.05) (Table 3). The mean relative weight losses of the groups between days 0-10 and 0-14 of embryonic development were determined
Group Initial egg weight (g) Egg length (mm) Egg width (mm) Shape index (%)
I (2.94 ) 12.15±0.07bc 32.88±0.09c 25.65±0.06b 78.10±0.21a II (4.87) 12.42±0.07a 33.10±0.09bc 25.85±0.06a 78.17±0.21a III (7.40) 12.35±0.08ab 33.42±0.11a 25.82±0.07ab 77.38±0.24b IV (6.41) 12.29±0.07ab 33.32±0.11ab 25.81±0.06ab 77.60±0.26ab V (2.00) 11.98±0.09c 32.94±0.11c 25.47±0.07c 77.47±0.26ab
General 12.24±0.03 33.13±0.05 25.72±0.03 77.74±0.11
F 5.469 5.155 6.237 2.487
P-value 0.000 0.000 0.000 0.042
Table 2 - Properties of hatching eggs
a-c - differences between mean values with different letters in the same column are statistically significant (P<0.05; P<0.001).
F - ANOVA; P-value - significance level (α = 0.05).
Group Days 0-10 Days 10-14 Days 0-14
I (2.94) 7.13±0.38b 5.50±0.38 11.99±0.64abc
II (4.87) 6.67±0.36b 4.92±0.25 11.15±0.50c
III (7.40) 6.98±0.33b 5.39±0.31 11.85±0.53bc
IV (6.41) 7.69±0.45ab 6.07±0.36 13.03±0.65ab
V (2.00) 8.47±0.53a 5.98±0.36 13.70±0.70a
General 7.38±0.19 5.57±0.15 12.33±0.27
F 2.870 1.927 2.746
P-value 0.022 0.104 0.027
Hatched eggs
I (2.94) 5.65±0.30b 4.26±0.28b 9.58±0.49b
II (4.87) 6.56±0.48ab 4.66±0.29ab 10.81±0.60ab
III (7.40) 6.06±0.34b 4.15±0.14b 9.93±0.38b
IV (6.41) 5.83±0.23b 4.42±0.14ab 9.97±0.31b
V (2.00) 7.54±0.65a 5.16±0.41a 12.14±0.79a
General 4.76±0.19 4.53±0.12 10.48±0.24
F 3.121 2.184 3.538
P-value 0.015 0.069 0.007
Unhatched eggs
I (2.94) 9.25±0.76abc 7.29±0.80ab 15.44±1.29bc
II (4.87) 6.91±0.53c 5.45±0.49b 11.83±0.90c
III (7.40) 8.37±0.63bc 7.24±0.68ab 14.69±1.11bc
IV (6.41) 11.40±1.13a 9.35±0.91a 19.15±1.61a
V (2.00) 10.01±0.88ab 7.33±0.66ab 16.26±1.28ab
General 9.17±0.36 7.33±0.33 15.46±0.57
F 4.072 3.218 3.990
P-value 0.003 0.013 0.004
Table 3 - Relative weight loss during the incubation period (%)
a-c - differences between mean values with different letters in the same column are statistically significant (P<0.05; P<0.001).
as 7.38% and 12.33%, respectively. Relative weight loss between days 0-10 and 0-14 of embryonic development was highest in Group V and lowest in Group II.
Mean relative weight losses of hatched eggs between days 0-10 and 0-14 of embryonic development were 4.76% and 10.48%, respectively. Throughout the investigated periods, egg weight loss in the hatched eggs was highest in Group V. The lowest relative weight losses were determined in Group I between days 0-10 and 0-14 of embryonic development.
In the unhatched eggs, mean relative weight losses between days 0-10 and 0-14 of embryonic development were 9.17% and 15.46%, respectively. Egg weight losses between days 0-10 and 0-14 of embryonic development were highest in Group IV (19.15%) and lowest in Group II (11.83%).
The mean eggshell temperature measured at the equatorial region on days 10 and 14 during incubation in all groups was 36.89 ºC and 37.57 ºC, respectively (Table 4) and the differences between groups were statistically significant (P<0.001). The lowest eggshell temperatures at equatorial region on days 10 and 14 during embryonic development were 35.92 ºC in Group IV and 36.95 ºC in Group III.
In the hatched eggs (Table 5), the mean eggshell temperatures measured at the equatorial region on days 10 and 14 during embryonic development were 36.92 ºC and 37.79 ºC, respectively. The differences between groups were statistically significant (P<0.001).
In the unhatched eggs (Table 6), the equatorial eggshell temperatures on days 10 and 14 during embryonic development differed significantly between the groups (P<0.001). The highest equatorial eggshell temperatures on days 10 and 14 during the incubation period were 37.32 ºC in Group II and 37.68 ºC in Group I.
In the present study, the differences observed between the groups for fertility rates, hatchability rates, and the hatchability of fertile eggs were found to be statistically insignificant (P>0.05) (Table 7). The highest fertility rate was determined as 84.7% in Group II, whereas the lowest fertility rate was determined as 79.2% in Group V. The hatchability of fertile eggs was highest in Group IV (82.6%), followed by Groups V (77.8%), II (77.3%), III (74.7%), and I (71.3%).
The effect of eggshell colour on embryonic mortality was insignificant (P>0.05). Embryonic mortality between days 1-6 was highest in Group I (18.7%) and lowest in Group V (9.5%). Embryonic mortality between days 7-17 was highest in Groups V (10.8%) and followed by Groups III (9.4%), I (7.6%), II (5.8%), and IV (5.6%). Embryonic mortality ranged from 1.8% to 2.9% between days 17 and 18.
The shell weight of hatched eggs was higher in Groups II (0.97 g) and I (0.95 g), which had the same eggshell colour, than in other groups (Table 8). The chick weight/ egg weight ratio was highest in Groups I (70.55%) and V (70.33%), followed by Groups IV (68.88%), III (68.80%), and II (68.45%) (P<0.001).
Group n Eggshell thickness (mm) Blunt end (oC) Equatorial (oC) Pointed end (oC) Mean eggshell
temperature (oC)
Eggshell temperature on day 10
I (2.94) 202 0.159±0.00b 36.67±0.03c 36.61±0.04b 36.64±0.17b 36.64±0.07b
II (4.87) 198 0.161±0.00a 37.30±0.04a 37.34±0.04a 37.51±0.04a 37.39±0.04a
III (7.40) 201 0.160±0.00ab 37.11±0.06b 37.30±0.07a 37.38±0.06a 37.26±0.06a
IV (6.41) 198 0.159±0.00b 36.08±0.04d 35.92±0.04c 35.99±0.03c 36.00±0.04c
V (2.00) 193 0.156±0.00c 37.17±0.06ab 37.30±0.07a 37.43±0.06a 37.30±0.06a
General 992 0.159±0.00 36.86±0.03 36.89±0.03 36.99±0.05 36.91±0.03
F 8.506 115.633 145.506 52.156 119.180
P-value 0.000 0.000 0.000 0.000 0.000
Eggshell temperature on day 14
I (2.94) 202 0.155±0.00b 37.50±0.03a 37.96±0.04a 37.91±0.03a 37.79±0.03a
II (4.87) 198 0.157±0.00a 37.36±0.04b 37.73±0.05b 37.68±0.04b 37.59±0.04b
III (7.40) 201 0.156±0.00ab 36.82±0.06d 36.95±0.07d 36.93±0.07d 36.90±0.06d
IV (6.41) 198 0.155±0.00b 37.31±0.04b 37.66±0.05bc 37.61±0.05bc 37.52±0.05b
V (2.00) 193 0.152±0.00c 37.14±0.03c 37.53±0.34c 37.51±0.03c 37.39±0.03c
General 992 0.155±0.00 37.23±0.02 37.57±0.03 37.53±0.02 37.44±0.02
F 6.968 46.155 59.265 63.862 59.912
P-value 0.000 0.000 0.000 0.000 0.000
a-d - differences between mean values with different letters in the same column are statistically significant (P<0.001). F - ANOVA; P-value - significance level (α = 0.05).
Discussion
The demonstration of eggshell colour having an effect on egg weight, egg length, and egg width in the present study was in agreement with the report of Taha (2011), indicating eggshell colour to have a significant effect on egg weight, egg length, and egg width in quails (Table 2). Egg weight and egg width values were determined to be highest in the blue spotted eggs and lowest in the black
spotted eggs. Taha (2011) reported that egg weight, egg length, and egg width were higher in black spotted eggs when compared with blue spotted eggs. The different results obtained in these studies are attributed to differences in the trial groups established. In another study carried out in quails (Farghly et al., 2015), eggshell colour (white, spotted violet, spotted brown) was reported to have no effect on egg weight. Other studies conducted in different avian species suggest that eggshell colour has an effect
Group n Eggshell thickness (mm) Blunt end (oC) Equatorial (oC) Pointed end (oC) Mean eggshell
temperature (oC)
Eggshell temperature on day 10
I (2.94) 83 0.157±0.00bc 36.68±0.05c 36.59±0.07b 36.78±0.08b 36.68±0.06b
II (4.87) 66 0.161±0.00a 37.21±0.07a 37.32±0.08a 37.47±0.07a 37.34±0.07a
III (7.40) 81 0.159±0.00ab 37.01±0.09ab 37.27±0.10a 37.34±0.10a 37.20±0.10a
IV (6.41) 66 0.155±0.00c 35.98±0.08d 35.81±0.08c 35.90±0.08c 35.90±0.08c
V (2.00) 73 0.154±0.00c 36.98±0.10b 37.15±0.11a 37.29±0.10a 37.14±0.10a
General 369 0.157±0.00 36.78±0.04 36.84±0.05 36.97±0.05 36.86±0.05
F 7.695 36.204 48.170 50.498 47.666
P-value 0.000 0.000 0.000 0.000 0.000
Eggshell temperature on day 14
I (2.94) 83 0.152±0.00bc 37,35±0.04a 37.68±0.05a 37.77±0.05a 37.60±0.04a
II (4.87) 66 0.157±0.00a 37.04±0.05b 37.27±0.07b 37.36±0.08b 37.22±0.06b
III (7.40) 81 0.154±0.00ab 36.56±0.09c 36.59±0.11c 36.62±0.12c 36.59±0.11c
IV (6.41) 66 0.149±0.00c 37.09±0.06b 37.16±0.08b 37.21±0.08b 37.12±0.07b
V (2.00) 73 0.149±0.00c 36.94±0.04b 37.20±0.05b 37.30±0.05b 37.15±0.04b
General 369 0.152±0.00 36.98±0.03 37.18±0.04 37.25±0.04 37.14±0.04
F 6.310 23.418 28.728 29.351 29.158
P-value 0.000 0.000 0.000 0.000 0.000
a-c - differences between mean values with different letters in the same column are statistically significant (P<0.001). F - ANOVA; P-value - significance level (α = 0.05).
Table 6 - Eggshell temperatures measured during the incubation period (unhatched eggs)
Group n Eggshell thickness (mm) Blunt end (oC) Equatorial (oC) Pointed end (oC) Mean eggshell
temperature (oC)
Eggshell temperature on day 10
I (2.94) 119 0.160±0.00a 36.67±0.05c 36.62±0.05b 36.34±0.029b 36.61±0.10b
II (4.87) 132 0.161±0.00a 37.34±0.04a 37.35±0.05a 37.53±0.05a 37.41±0.05a
III (7.40) 120 0.161±0.00a 37.17±0.07b 37.32±0.08a 37.40±0.08a 37.29±0.08a
IV (6.41) 132 0.161±0.00a 36.13±0.04d 35.97±0.05c 36.04±0.05c 36.05±0.04c
V (2.00) 120 0.158±0.00b 37.29±0.08ab 37.39±0.08a 37.52±0.09a 37.40±0.08a
General 623 0.160±0.00 36.91±0.03 36.92±0.04 37.00±0.07 36.94±0.04
F 4.258 83.322 99.844 25.764 73.979
P-value 0.002 0.000 0.000 0.000 0.000
Eggshell temperature on day 14
I (2.94) 119 0.157±0.00a 37.60±0.03a 38.16±0.05a 38.01±0.04a 37.92±0.04a
II (4.87) 132 0.157±0.00a 37.51±0.04ab 37.96±0.05b 37.85±0.04b 37.77±0.04b
III (7.40) 120 0.158±0.00a 37.00±0.07d 37.19±0.08d 37.14±0.07d 37.11±0.07d
IV (6.41) 132 0.158±0.00a 37.46±0.04b 37.90±0.06b 37.80±0.05b 37.72±0.05b
V (2.00) 120 0.154±0.00b 37.26±0.03c 37.74±0.04c 37.64±0.03c 37.54±0.03c
General 623 0.157±0.00 37.37±0.02 37.79±0.03 37.69±0.03 37.62±0.02
F 4.612 28.662 42.406 42.605 40.239
P-value 0.001 0.000 0.000 0.000 0.000
a-d - differences between mean values with different letters in the same column are statistically significant (P<0.001). F - ANOVA; P-value - significance level (α = 0.05).
on egg weight. In research conducted on pheasant eggs of varying eggshell colour (Kırıkcı et al., 2005; Kożuszek et al., 2009a), eggshell colour was determined to have a significant effect on egg weight. On the other hand, Kożuszek et al. (2009b) and Nowaczewski et al. (2013) reported that the impact of eggshell colour on egg weight was statistically insignificant. While reports by Shafey et al. (2004) and Shafey et al. (2005) suggest that the effect of the pigment density of brown chicken eggs on egg weight is statistically insignificant, Yang et al. (2009) suggested the effect of pigment density to be significant.
In the present study, while egg shape index was the same in blue spotted (Group II, 78.17%) and black spotted (Group I, 78.10%) eggs of the same eggshell colour, the differences observed between these two groups and the brown spotted groups (Groups III, IV and V) were statistically significant. This result, suggesting egg shape index to vary with spot colour, disagrees with the reports of Taha (2011) and Farghyl et al. (2015) suggesting egg shape index not to vary with eggshell colour. In the present
study, egg shape index values were highest in the blue coloured eggs, whilst Taha (2011) and Farghyl et al. (2015) reported these values to be highest in brown and spotted violet quail eggs. While Kirikci et al. (2005) and Kozuszek et al. (2009b) reported that eggshell colour had a significant effect on egg shape index in pheasants, Nowaczewski et al. (2013) suggested that egg shape index did not vary with eggshell colour.
Egg weight loss during the incubation period is a major parameter, which affects hatching results. In the present study, the highest egg weight loss between days 0-14 of embryonic development was determined at 13.70% in Group V, whilst the lowest loss that occurred in the same period was determined at 11.15% in Group II. This difference observed between the groups for egg weight loss was attributed to the eggs included in Group V having a thinner eggshell and a spotted area of smaller size, and the eggs included in Group II having a thicker eggshell and a spotted area of medium size. These results are in support of the reports of Ar et al. (1974) and Rahn and Ar (1974) suggesting that eggs with a thicker eggshell have lower gas permeability. In an investigation carried out in meat-type and egg-type quails, Romao et al. (2008) reported egg weight losses in the embryonic development period to have occurred at the rates of 8.27 and 9.31%, respectively. Furthermore, egg weight loss during incubation was reported as 9.72% in meat-type Pharaoh quails (Genchev, 2009). In another study conducted by Nowaczewski (2010) in groups of varying egg weight (small: 10.5 g, medium: 10.51-11.50 g, large: 11.51-12.50 g, and extra large: 12.51 g), egg weight losses were reported to have occurred at the rates of 11.0, 10.4, 9.9, and 9.5%, respectively, between days 0-15 of embryonic development. In an investigation on the effects of varying propolis concentrations and storage periods on microbial load and hatching results in hatching quail eggs, Aygun and Sert (2013) reported egg weight loss to have occurred at a rate of 10.59% between days 0-14 of embryonic development in the control group. Nowaczewski et al. (2012) reported the weight loss (0-14 days of embryonic development) of quail eggs at the upper levels in the setter at 9.07% (P>0.05). In another study on the effect of eggshell colour in quail eggs (Farghly et al., 2015), weight loss was reported as 15.70% in eggs with white coloured eggshell, 15.42% in eggs with spotted brown eggshell, and 14.04% in eggs with spotted violet eggshell. The weight losses determined in the present study are higher than those reported for quail eggs by Romao et al. (2008), Genchev (2009), Nowaczewski et al. (2010), Nowaczewski et al. (2012), and Aygun and Sert (2013) and lower than those reported by Farghly et al. (2015). The differences between the results of these studies Group Fertility rate Hatchability rate of fertile eggs Hatchability rate
I (2.94) 82.2 71.3 58.7
II (4.87) 84.7 77.3 65.5
III (7.40) 80.2 74.7 59.9
IV (6.41) 80.5 82.6 66.5
V (2.00) 79.2 77.8 62.1
X2 2.227 6.418 4.087
P-value 0.694 0.170 0.394
Embryonic mortality (% of fertile eggs)
Group Days 1-6 Days 7-17 Days 17-18
I (2.94) 18.7 7.6 2.3
II (4.87) 14.0 5.8 2.9
III (7.40) 14.1 9.4 1.8
IV (6.41) 9.9 5.6 1.9
V (2.00) 9.5 10.8 1.9
X2 8.049 4.577 0.723
P-value 0.090 0.333 0.949
Table 7 - Effect of egg shape index on hatching parameters (%)
X2 - Pearson Chi Square; P-value - significance level (α = 0.05).
Group weight (g)Initial egg weight (g)Eggshell Chick hatching weight (g) weight (%)Chick
I (2.94) 12.21±0.09ab 0.95±0.01ab 8.61±0.08 70.55±0.41a
II (4.87) 12.41±0.09a 0.97±0.01a 8.50±0.08 68.45±0.37b
III (7.40) 12.31±0.09a 0.93±0.01bc 8.47±0.08 68.80±0.35b
IV (6.41) 12.35±0.09a 0.91±0.01c 8.50±0.07 68.88±0.38b
V (2.00) 11.99±0.10b 0.90±0.01c 8.43±0.08 70.33±0.43a
General 12.26±0.04 0.93±0.01 8.50±0.04 69.37±0.18
F 3.108 6.388 0.719 6.148
P-value 0.015 0.000 0.579 0.000
Table 8 - Properties of hatched eggs and chick weight percentage
a-c - differences between mean values with different letters in the same column are statistically significant (P<0.05; P<0.001).
were attributed to the use of hatching eggs from animals of varying genotypes and ages, the use of different setters for embryonic development, and different environmental conditions having been adjusted in the setters.
In the present study, weight losses that occurred between days 0-14 of embryonic development in the hatched eggs with a greyish white eggshell colour were determined as 9.58% in Group I and 10.81% in Group II. Weight losses that occurred in the same period in the eggs with a greyish brown eggshell colour were determined as 12.14% in Group V and 9.93% in Group III (P<0.05) (Table 3). These values demonstrated that, in Groups III and V, egg weight loss had decreased with an increased size of spotted area on the same eggshell background colour. This result was in agreement with that reported by Higham and Gosler (2006) for eggs of tit (Parus major) suggesting an increased spotted area of hatched eggs to be associated with increased resistance of the eggshell to breakage and decreased eggshell permeability. However, the results obtained in Groups I and II, which included eggs of the same eggshell colour, differed from those reported by Higham and Gosler (2006). In the present study, the eggs included in Group I being black spotted and the eggs included in Group II being blue spotted demonstrated that egg weight loss was affected by spot colour rather than by the size of the spotted area. Furthermore, in an investigation on eggs of Houbara bustard (Chlamydotis undulata macqueennii), Baggott et al. (2002) reported that light and very light coloured eggs had a thinner eggshell with a greater number of pores and greater water permeability, when compared with medium-coloured and dark medium-coloured eggs.
Fertility rates having been determined not to differ with eggshell colour were in agreement with the report of Hassan et al. (2013) suggesting light, dotted, spotted, and dark eggshell colour not to have any effect on fertility, but diverged from the results of Taha (2011) suggesting that fertility varied among eggs with black, blue, brown, spotted, and white eggshell colour. In research carried out in pheasant eggs, while Hulet et al. (1985) reported that olive, dark brown, grey-white, tan, and blue eggshell colour had no effect on fertility rate, Krystianiak et al. (2005) and Kożuszek et al. (2009a) reported that fertility rate varied with dark brown, light brown, olive, and blue eggshell colour.
In the present study, the effect of eggshell colour on hatchability and the hatchability of fertile eggs having been determined to be statistically insignificant was in agreement with the report of Fayeye et al. (2013) suggesting that pigment density has no effect on the hatchability of fertile eggs in quails. On the other hand, the results obtained
for hatchability and the hatchability of fertile eggs in the present study diverged from those reported by Farghly et al. (2015) and Hassan et al. (2013) suggesting eggshell colour to have an effect on both hatchability and hatchability of fertile eggs. In research conducted by Hulet et al. (1985) and Richards and Deeming (2001) on pheasant eggs, it was ascertained that blue and tan coloured eggs had a thinner eggshell and presented a lower hatchability, in comparison with green, dark brown, and grey/white eggs. Furthermore, Kożuszek et al. (2009a) reported that the hatchability of fertile eggs was lower in blue eggs compared with dark brown eggs.
In the present study, it was determined that the effect of eggshell colour on embryonic mortality was statistically insignificant, which was in agreement with the report of Farghly et al. (2015) suggesting that in white, spotted violet, and spotted brown quail eggs, eggshell colour had no effect on embryonic mortality. On the contrary, Taha (2011) and Hassan et al. (2013) reported that eggshell colour has an impact on embryonic mortality rates. In their research on pheasant eggs, Hulet et al. (1985) and Ristić et al. (2013) determined that eggshell colour had no effect on embryonic mortality.
The mean eggshell temperatures measured at the equatorial region of the eggs on days 10 and 14 of embryonic development, in all of the eggs incubated in the present study, were 36.89 and 37.57 ºC, respectively, and were found to be approximately 0.7 and 0.3 ºC lower than the temperature of the incubator, respectively (Table 4). These results are in support of the results reported by French (1997) suggesting that during early embryonic development, embryo temperature is lower than the temperature of the incubator due to evaporative cooling. Nowaczewski et al. (2012) determined that, in quail eggs, while eggshell temperature increased between days 2-12 of incubation, it decreased on the 14th day of incubation. The results of the present study, which demonstrated that the eggshell temperatures measured until days 10 and 14 of incubation were lower than the fixed incubator temperature, are in agreement with the results reported by Nowaczewski et al. (2012) for eggshell temperature change on day 14 of incubation. In a study carried out in chicken eggs, Romijn and Lokhorst (1956) determined that eggshell temperature was 0.2-0.1 ºC lower than the temperature of the setter (38.0 ºC) during the first half of the incubation period, but was higher than the setter temperature during the second half of the incubation period.
While the chick weight/egg weight ratio determined in the present study (69.37%) (Table 8) fell within the range (62-78%) reported by Wilson (1991) for chickens, it was higher than the ratios reported for turkeys (63.5%), ducks (57.8%), geese (58.9%), and pheasants (61.9%) (Shanaway, 1987). Furthermore, the results obtained for chick weight/egg weight ratio in the present study were in agreement with those reported by Uddin (1994) for quail eggs suggesting the chick weight percentage of small (8.59 g), medium (9.52 g), and large (10.56 g) eggs to be 68.77, 70.28, and 69.64%, respectively. The results obtained in the present study were also in agreement with those reported by Moraes et al. (2008) (69.90%) and Genchev (2009) (70.84%). These results were also similar to those reported by Sadeghi et al. (2013) indicating the chick weight percentage of eggs weighing 14.19, 12.02, and 10.20 g to be 76.4, 74.8, and 70.5%, respectively. The mean chick weight/egg weight ratio determined in the present study was higher than the ratios reported by Islam et al. (2014) as 62.68, 62.85, 58.23, and 46.35% for Japanese, white, brown, and black quails, respectively.
In the present study, in Groups I and II, which were of the same eggshell colour, chick weight/egg weight ratio was higher in Group I (70.55%) than Group II (68.45%). This difference was attributed to differences in eggshell weight. Eggshell weight was greater in Group II (0.97 g) in comparison with Group I (0.95 g). Similarly, in Groups III and V, which were of the same eggshell colour, the group with a higher eggshell weight presented a lower chick
weight/egg weight ratio. Hassan et al. (2013) determined
that in light coloured (66.51%), dotted (68.73%), spotted (68.62%), and dark coloured (66.51%) quail eggs stored at room temperature, eggshell colour and egg shape had a significant effect on chick weight (%). Similarly, in the present study, it was determined that in the groups of the same eggshell colour (Groups I/II and Groups III/V), the chick weight/egg weight ratio was lower in the eggs with a larger spotted area, such that this ratio was 70.55, 68.45, 68.80, and 70.33% in Groups I, II, III and V, respectively.
In the present study, while egg shape index did not differ with spot colour in eggs of the same eggshell colour, it differed with the size of the spotted area in eggs of the same eggshell and spot colour. Egg weight loss between days 0-14 of incubation decreased with an increased spotted area in eggs of the same eggshell colour. Fertility, hatchability of fertile eggs, and hatchability and embryonic mortality rates did not vary with eggshell colour or the size of the spotted area. Eggshell temperatures measured on days 10 (36.89 ºC) and 14 (37.57 ºC) of embryonic development were lower than the fixed temperature of the
incubator (37.6 ºC). Chick weight/egg weight ratios varied with eggshell weight in the groups with the same eggshell colour.
Conclusions
Fertility, hatchability of fertile eggs, and hatchability and embryonic mortality rates do not vary in relation to eggshell colour or the size of the spotted area.
Acknowledgments
This study was conducted between February and April, 2013. Present study was supported by the Scientific Research Project Unit of Mustafa Kemal University, Turkey (Project number: 1206 M0117).
References
Ar, A.; Paganelli, C. V.; Reeves, R. B.; Greene, D. G. and Rahn, H. 1974. The avian egg: water vapor conductance, shell thickness, and functional pore area. The Condor 76:153-158.
Aygun, A. and Sert, D. 2013. Effects of prestorage application of propolis and storage time on eggshell microbial activity, hatchability, and chick performance in Japanese quail (Coturnix coturnix japonica) eggs. Poultry Science 92:3330-3337.
Baggott, G. K.; Deeming, D. C.; Hemon, S. and Paillat, P. 2002. Relationships between eggshell pigmentation, ultrastructure and water vapour conductance in the houbara bustard (Chlamydotis undulata macqueennii). Avian and poultry Biology Reviews 13:234-235.
Cassey, P.; Thomas, G. H.; Portugal, S. J.; Maurer, G.; Hauber, M. E.; Grim, T.; Lovell, P. G. and Mikšík, I. 2012. Why are birds’ eggs colourful? Eggshell pigments co-vary with life-history and nesting ecology among British breeding non-passerine birds. Biological Journal of the Linnean Society 106:657-672.
Duval, C.; Cassey, P.; Mikšík, I.; Reynolds, S. J. and Spencer, K. A. 2013. Condition-dependent strategies of eggshell pigmentation: an experimental study of Japanese quail (Coturnix coturnix japonica). The Journal of Experimental Biology 216:700-708. Farghly, M. F. A.; Mahrose, Kh. M. A. and Abou-Kassem, D. E. 2015.
Pre and post hatch performance of different japanese quail egg colors incubated under photostimulation. Asian Journal of Poultry Science 9:19-30.
Fayeye, T. R.; Ojo, V.; Alli, O. I. and Adebayo, B. K. 2013. Egg pigment pattern and association between hen body weight, oviposition interval, egg-weight and hatchability in Japanese quail. Niseb Journal 13:1-4.
French, N. A. 1997. Modeling incubation temperature: the effects of incubator design, embryonic development, and egg size. Poultry Science 76:124-133.
Genchev, A. 2009. Influence of hatching eggs storage period upon the incubation parameters in Japanese quails. Journal Central European Agriculture 10:167-174.
Hassan, H. A.; El-Nesr, S. S.; Osman, A. M. R. and Arram, G. A. 2013. Ultrastructure of eggshell, egg weight loss and hatching traits of Japanese quail varding in eggshell color and pattern using image analysis. Egyptian Poultry Science 34:1-17.
Higham, J. P. and Gosler, A. G. 2006. Speckled eggs: water-loss and incubation behaviour in the great tit Parus majör. Oecologia 149:561-570.
Holveck, M. J.; Grégoire, A.; Staszewski, V.; Guerreiro, R.; Perret, P.; Boulinier, T. and Doutrelant, C. 2012. Eggshell spottiness reflects maternally transferred antibodies in blue tits. Plos One 7:1-12. Hulet, R. M.; Marquez, B. J.; Molle, S. and Flegal, C. J. 1978.
Relationship of pheasant egg color and hatchability. Poultry Science 57:1146-1148.
Hulet, R. M.; Flegal, C. J.; Carpenter, G. H. and Champion, L. R. 1985. Effect of eggshell color and thickness on hatchability in Chinese ring-necked pheasants. Poultry Science 64:235-237. Idahor, K. O.; Akinola, L. A. F. and Chia, S. S. 2015. Predetermination
of quail chick sex using egg indices in North Central Nigeria. Journal of Animal Production Advances 5:599-605.
Islam, M. S.; Faruque, S.; Khatun, H. and Islam, M. N. 2014. Effects of quail genotypes on hatchability traits, body weight and egg production. Journal of Bangladesh Academy of Sciences 38:219-224.
Kirikci, K.; Gunlu, A. and Garip, M. 2005. Some quality characteristics of pheasant (Phasianus colchicus) eggs with different shell colors. Turkish Journal of Veterinary and Animal Sciences 29:315-318.
Kożuszek, R.; Kontecka, H.; Nowaczewski, S. and Rosiński, A. 2009a. Storage time and eggshell colour of pheasant eggs vs. the number of blastodermal cells and hatchability results. Folia Biologica 57:121-130.
Kożuszek, R.; Kontecka, H.; Nowaczewski, S.; Leśnierowski, G.; Kijowski, J. and Rosiński, A. 2009b. Quality of pheasant (Phasianus colchicus L.) eggs with different shell colour. Archiv Für Geflügelkunde 73:201-207.
Krystianiak, S.; Kożuszek, R.; Kontecka, H. and Nowaczewski, S. 2005. Quality and ultrastructure of eggshell and hatchability of eggs in relation to eggshell colour in pheasants. Animal Science Papers and Reports 23:5-14.
Kumar, A.; Das, K.; Mukherjee, K.; Bharti, A. and Singh, A. K. 2012. Frequency of different shell color and its effect on the fertility and hatchability in black rock, gramapriya and vanaraja breeds of chicken. Veterinary World 5:594-598.
Lahti, D. C. 2008. Population differentiation and rapid evolution of egg color in accordance with solar radiation. The Auk 125:796-802.
Liu, H. S. and Cheng, W. T. 2010. Eggshell pigmentatoin: a review. Journal of the Chinese Society of Animal Science 39:75-89. Mikšík, I.; Holáň, V. and Deyl, Z. 1994. Quantification and variability
of eggshell pigment content. Comparative Biochemistry Physiology 109A:769-772.
Mikšík, I.; Holáň, V. and Deyl, Z. 1996. Avian eggshell pigments and their variability. Comparative Biochemistry Physiology 113B:607-612.
Moraes, T. G. V.; Romao, J. M.; Teixeira, R. S. C. and Cardoso, W. M. 2008. Effects of egg position in artificial incubation of Japanese quail eggs (Coturnix japonica). Animal Reproduction 5:50-54. Morales, J.; Velando, A. and Torres, R. 2011. Biliverdin-based egg
coloration is enhanced by carotenoid supplementation. Behavioral Ecology Sociobiology 65:197-203.
Moreno, J. and Osorno, J. L. 2003. Avian egg colour and sexual selection: does eggshell pigmentation reflect female condition and genetic quality? Ecology Letters 6:803-806.
Nowaczewski, S.; Witkiewicz, K.; Kontecka, H.; Krystianiak, S. and Rosiński, A. 2010. Eggs weight of Japanese quail vs. eggs quality after storage time and hatchability results. Archiv Tierzucht 53:720-730.
Nowaczewski, S.; Stuper, K.; Szablewski, T. and Kontecka, H. 2011. Microscopic fungi in eggs of ring-necked pheasants kept in aviaries. Poultry Science 90:2467-2470.
Nowaczewski, S.; Kontecka, H. and Rosiński, A. 2012. Effect of Japanese quail eggs location in the setter on their weight loss and eggshell temperature during incubation as well as hatchability results. Archiv Für Geflügelkunde 76:168-175.
Nowaczewski, S.; Szablewski, T.; Cegielska-Radziejewska, R. and Kontecka, H. 2013. Egg morphometry and eggshell quality in ring-necked pheasants kept in cages. Annals of Animal Science 13:531-541.
Rahn, H. and Ar, A. 1974. The avian egg: incubation time and water loss. The Condor 76:147-152.
Rahn, H. and Paganelli, C. V. 1989. Shell mass, thickness and density of avian eggs derived from the tables of Schönwetter. Journal of Ornithology 130:59-68.
Richards, P. D. G. and Deeming, D. C. 2001. Correlation between Shell colour and ultrastructure in pheasant eggs. British Poultry Science 42:338-343.
Riehl, C. 2011. Paternal investment and the ‘sexually selected hypothesis’ fort he evolution of eggshell coloration: revisiting the assumptions. The Auk 128:175-179.
Ristić, Z. A.; Marković, V.; Kovaćević, M.; Nad, I.; Matejević, M. and Jovanović, T. 2013. The significance of egg shell color on the pheasant hatching production results. Pakistan Journal of Zoology 45:1549-1553.
Romao, J. M.; Moraes, T. G. V.; Teixeira, R. S. C.; Cardoso, W. M. and Buxade, C. C. 2008. Effect of egg storage length on hatchability and weight loss in incubation of egg and meat type Japanese quails. Brazilian Journal of Poultry Science 10:143-147.
Romijn, C. and Lokhorst, W. 1956. The caloric equilibrium of the chicken embryo. Poultry Science 35:829-834.
Sadeghi, R.; Pakdel, A. and Shahrbabak, M. M. 2013. Effects of divergent selection and egg status in artificial incubator on reproductive trait in Japanese quail. World Applied Sciences Journal 24:463-466.
Shafey, T. M.; Ghannam, M. M.; Al-Batshan, H. A. and Al-Ayed, M. S. 2004. Effect of pigment intensity and region of eggshell on the spectral transmission of light that passes the eggshell of chickens. International Journal of Poultry Science 3:228-233.
Shafey, T. M.; Al-Batshan, H. A.; Ghannam, M. M. and Al-Ayed, M. S. 2005. Effect of intensity of eggshell pigment and illuminated incubation on hatchability of brown eggs. British Poultry Science 46:190-198.
Shanawany, M. M. 1987. Hatching weight in relation to egg weight in domestic birds. World’s Poultry Science Journal 43:107-115. Siefferman, L.; Navara, K. J. and Hill, G. E. 2006. Egg coloration
is correlated with female condition in eastern blue birds (Sialia sialis). Behavioral Ecology Sociobiology 59:651-656.
Soler, J. J.; Moreno, J.; Avilés, J. M. and Møller, A. P. 2005. Blue and green egg-color intensity is associated with parental effort and mating system in passerines: support for the sexual selection hypothesis. Evolution 59:636-644.
Stoddard, M. C.; Fayet, A. L.; Kilner, R. M.; Hinde, C. A. 2012. Egg speckling patterns do not advertise offspring quality or influence male provisioning in Great Tits. Plos One 7:1-12.
Uddin, M. S.; Paul, D. C. and Huque, Q. M. E. 1994. Effect of egg weight and pre-incubation holding periods on hatchability of Japanese quail eggs in different seasons. Asian-Australasian Journal of Animal Sciences 7:499-503.
Van Der Pol, C. W.; Van Roovert-Reijrink, I. A. M.; Maatjens, C. M.; Van Der Brand, H. and Molenaar, R. 2013. Effect of relative humidity during incubation at a set eggshell temperature and brooding temperature posthatch on embryonic mortality and chick quality. Poultry Science 92:2145-2155.
Wilson, H. R. 1991. Interrelationships of egg size, chick size, posthatching growth and hatchability. World’s Poultry Science Journal 47:5-20.
Yang, H. M.; Wang, Z. Y. and Lu, J. 2009. Study on the relationship between eggshell colors and egg quality as well as shell ultrastructure in yangzhou chicken. African Journal of Biotechnology 8:2898-2902.