The impact of eggshell colour and spot area in Japanese quails:
II. Slaughter and carcass characteristic
Sema Alasahan
1, Gulsen Copur Akpinar
2, Sibel Canogullari
3, Mikail Baylan
4 1 Mustafa Kemal University, Veterinary Faculty, Department of Animal Science, Hatay, Turkey.2 Mustafa Kemal University, Agriculture Faculty, Department of Animal Science, Hatay, Turkey.
3 Nigde University, Agricultural Sciences and Technologies Faculty, Department of Animal Production and Technologies, Nigde, Turkey. 4 Cukurova University, Agriculture Faculty, Department of Animal Science, Adana, Turkey.
ABSTRACT - This study was carried out to investigate the effects of eggshell colour and spot properties (colour and size of the spot area) on growth performance and carcass traits of Japanese quail (Coturnix coturnix japonica) eggs. Study material were allocated to five groups according to their eggshell and spot colours: black spots on greyish white coloured eggshell (I), blue spots on greyish white coloured eggshell (II), diffuse brown spots on greyish brown coloured eggshell (III), brown spots on light green colored eggshell (IV), and small brown spots on greyish brown coloured eggshell (V). The size of the spotted area was determined in each egg group using digital image analysis. The groups did not differ for body weight and length of the shank at the end of the growth period. However, the groups differed significantly for carcass yield after slaughter (not eviscerated) and carcass yield.These parameters were highest in Group I (82.08 and 76.09%) and lowest in Group III (80.20 and 73.86%). Digital image analysis demonstrated that heart length, cardiac fat area, gizzard width, and intestine length varied between the groups. Cardiac fat area was largest in Group III (0.86 cm2) and smallest in Group V (0.65 cm2). Gizzard width
was greatest in Group I (2.63 cm) and smallest in Group V (2.47 cm). Intestine length was greatest in Group V (78.45 cm) and smallest in Group IV (72.39 cm). Body weight, shank length, and slaughter and carcass weight do not vary in relation to eggshell colour or the size of the spotted area. The lengths of intestine and heart, gizzard width, and cardiac fat area do vary in relation to eggshell colour or the size of the spotted area.
Key Words: digital image, growth performance, quail, spot colour
ISSN 1806-9290
www.sbz.org.br R. Bras. Zootec., 45(9):509-517, 2016
Received April 18, 2016 and accepted May 24, 2016. Corresponding author: [email protected] http://dx.doi.org/10.1590/S1806-92902016000900002
Copyright © 2016 Sociedade Brasileira de Zootecnia. This is an Open Access article distributed under the terms of the Creative Commons Attribution License (http://creativecommons.org/licenses/by/4.0/), which permits unrestricted use, distribution, and reproduction in any medium, provided the original work is properly cited.
Introduction
The eggshell provides mechanic protection for the
egg content and the developing embryo. It also serves as a
barrier against microorganisms and as a source of calcium
for the embryo. The eggshell has other important functions
such as enabling gas exchange between the egg and the
environment by avoiding excessive dehydration, by means
of the permeable pores on its surface.
In nature, the colour of the eggshell camouflages the
egg. In quail eggs, both the background colour and spot
colour of the eggshell vary. The background colour of the
eggshell varies from white to light tan and light brown.
In quail eggs, the colour of the spots can be blue, black,
or brown (Narahari et al., 1988). While the blue-green
coloured biliverdin is an antioxidant eggshell pigment, the
brown coloured protoporphyrin is a pro-oxidative eggshell
deposited in the parts of the eggshell characterized by less
calcium deposition. García-Navas et al. (2011) reported that
in eggs of blue tit (
Cyanistes caeruleus
), the level of the
protoporphyrin pigment in the eggshell is partly correlated
with eggshell thickness.
The hatching weight of the chick is an important
indicator of its future body weight. The egg weight,
eggshell weight, eggshell thickness, and egg yolk and egg
white weights are significant traits, which have an effect
on the egg quality, hatchling weight, and hatching results
(Khurshid et al., 2003; Seker et al., 2004). The effect of
eggshell colour on the hatching weight of chicks has been
investigated in previous research. Hassan et al. (2013)
determined that, in quail eggs, four different eggshell
colours (light, dotted, spotted, and dark) had a significant
effect on the chick weight and the proportion of the chick
weight to the egg weight (chick weight/egg weight). It
has been reported that eggshell colour, in relation to egg
quality, may affect late stage embryonic development as
well as chick development from hatching to the start of feed
consumption (Farghly et al., 2012). Furthermore, Farghly
et al. (2015) determined that the hatching weight differed
among chicks that hatched from white, spotted violet, and
spotted brown quail eggs.
This study aimed to investigate the impact of eggshell
colour and maculation (spot colour and size of spotted
area) on chick hatching weight, weekly body weights, and
slaughter and carcass traits, and to determine the variance of
these traits by sex. The digital image analysis method was
used to determine the differences between the study groups
for the area and length measurements of some visceral organs
(heart, gizzard, and intestine).
Material and Methods
Hatching eggs, collected within a three-day period
from a private holding raising Japanese quails, constituted
the material of the study. The eggs underwent macroscopic
examination at the laboratory, and broken, cracked,
abnormally shaped, and soiled eggs were excluded from the
study. The experiment involved 1,062 eggs from 16-wk-old
Japanese quail (
Coturnix coturnix japonica
), which reached
95% egg production.
Prior to being incubated, the hatching eggs were
macroscopically examined and allocated to five groups
according to their eggshell and spot colour. Each egg was
numbered individually. The size of the spotted eggshell
area of each egg included in all groups was determined
by digital image analysis (Table 1). A mechanism with
a measurement scale was set up for the digital imaging
process. The individually numbered eggs were placed in the
mechanism and were imaged at an approximate distance of
20 cm. Each egg was photographed from one side, and then
turned 180º to the other side to be photographed again.
The size of the spotted area was expressed in cm
2.
Prior to incubation, all eggs included in each group
were weighed individually to determine egg initial weight.
The eggs were randomly placed in the setter with three
repeats, such that each tray provided for one repeat. In the
setter, the temperature was set at 37.6
oC and the relative
humidity was adjusted to 60-65%. On day 14 of embryonic
development, individual compartments were established
for each egg included in the same group, and the hatching
period was initiated by placing eggs of the same group in
an individual compartment. In the hatching machine, the
temperature was set at 37.2
oC and the relative humidity
was adjusted to 65-70%.
The chicks, which hatched from the incubated eggs
included in each study group, were weighed individually
and identified using wing bands. To determine their body
weights, the individually identified chicks were transferred
to growth cages. During the first two weeks of the growth
period, 638 quail chicks were raised. The chicks included
in each group were individually weighed on a weekly
basis so as to determine and record their weekly body
weights. Following the weight measurement performed in
the second week, the chicks were sexed. Quails were sexed
at three weeks of age, according to the appearance of the
breast feathers (feather sexing). Subsequently, 80 (4 × 20;
4 = number of repeats, 20 = number of animal in each
Group Total Spotted area values determined by digital image
Spotted area-1 Spotted area-2 Total spotted area1
Black spots on greyish white coloured eggshell (I) 213 1.74±0.03d 1.20±0.05d 2.94±0.10d
Blue spots on greyish white coloured eggshell (II) 215 2.90±0.09c 1.98±0.07c 4.87±0.14c
Diffuse brown spots on greyish brown coloured eggshell (III) 213 4.01±0.10a 3.39±0.10a 7.40±0.10a
Brown spots on light green coloured eggshell (IV) 210 3.62±0.10b 2.78±0.09b 6.41±0.17b
Small brown spots on greyish brown coloured eggshell (V) 210 1.08±0.05e 0.92±0.04e 2.00±0.09e
1 Sum of spotted area-1 and spotted area-2.
a-e - means followed by different letters in the same column are statistically different.
repeat) animals of each sex were assigned to each group.
The weekly body weights of 80 chicks from each group,
and in total 400 chicks from five groups, were determined.
Furthermore, in the 5th week, the shank length of each chick
was measured on an individual basis. A digital calliper
was used to measure the shank length. Shank length was
expressed in mm as the distance between the proximal and
distal ends of the tarsometatarsal bone.
During the five-week growth period, the animals
received a diet containing 3000 kcal energy/kg and 22%
crude protein.
In the 5th week, a total of 400 animals (80 × 5) from five
groups were weighed to determine their body weights. The
quails with body weights closest to the mean value (either
above or below the mean value) were chosen for slaughter.
In each group, 200 quails were selected for slaughter (5 × 40;
20 females and 20 males). The selected animals were
weighed one more time prior to being slaughtered, and their
weights were recorded together with their sex.
Before the abdomen was cut open, the carcass
weight after slaughter (not eviscerated) was determined.
Subsequently, the abdomen was cut open, and the visceral
organs except for the kidneys were removed, aiming
to determine the weight of the eviscerated carcass. The
carcasses were cut into the breast, wings, right thigh, left
thigh and back, and the weights of these cut-up parts were
measured. Of the edible visceral organs, the heart, liver,
and gizzard (full) were weighed. Of the inedible visceral
organs, the full intestine was also weighed.
Following the slaughter of the animals and the
cutting-up of their carcasses, of the visceral organs, the heart,
gizzard, and intestine were placed into separate storage
bags together with the wing number of the animals showing
their individual identification number and group. Before
being imaged for digital image analysis, the visceral organs
were stored in a deep freezer at −18
oC for approximately
a week. Subsequently, the visceral organs were imaged
and their images were stored in a flash memory device.
The length, width, and surface area measurements of the
visceral organs were performed using 399 of these images
with a favourable resolution for digital image analysis.
The definition of the measurement areas of the
visceral organs and images of these measurement areas
are presented below (McLelland, 1990):
Gizzard area-1 and Gizzard area-2 (cm
2): the size of
the area of the lateral surfaces (left and right surfaces) of
the muscular stomach (gaster); Gizzard length (cm): the
distance between the thin craniodorsal muscle (m.
tenuis
craniodorsalis
) and the thin caudoventral muscle (m.
tenuis
caudoventralis
); Gizzard width (cm): the distance between
the thick caudodorsal muscle (m.
crassus caudodorsalis
) and
the thick cranioventral muscle (m.
crassus cranioventralis
).
Cardiac fat area (cm
2): image of the fat-filled groove
visible on the auricular surface of the heart; Heart length
(cm): the distance between the base of the heart (basis cordis)
and the apex of the heart (apex cordis); Heart width (cm):
the width of the heart at the atrioventricular level.
Intestine length (cm): total length of the small intestines
(duodenum, jejunum, and ileum), the large intestine (colon),
and the cloaca.
The SPSS package was used for the statistical analysis
of the data obtained in this study. Group data pertaining
to the characteristics determined were compared by
analysis of variance, and groups that differed were detected
by Duncan’s multiple comparison test. To determine
whether sex had any impact on each of the characteristics
investigated, the data was analysed by the two-sample t test
to determine the significance of the difference between two
mean values.
Results
Although the hatching weights of the chicks, their
body weights in the 3th, 4th, and 5th weeks, and their
shank lengths in the 5th week were similar in all of the
study groups, the body weights of the chicks in the 1st and
2nd weeks differed significantly between the study groups
(P<0.001) (Table 2).
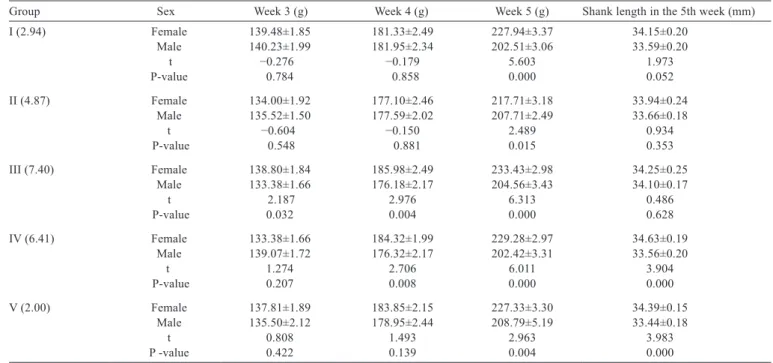
In all of the study groups, the body weights of the
female quails in the 5th week were greater than those of
the males (Table 3), and this difference between the sexes
was statistically significant (P<0.05, P<0.01, P<0.001).
Furthermore, statistically significant differences were also
determined between the male and female quails in Groups
I (2.94), IV (6.41), and V (2.00) for shank length in the 5th
week (P≤0.05, P<0.001).
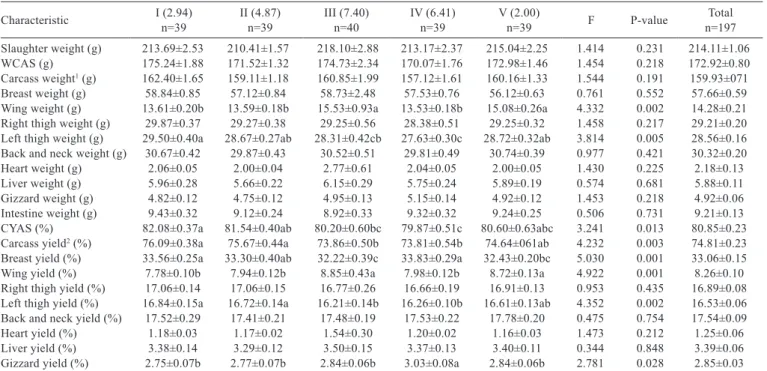
The differences observed between the study groups for
the wing and left thigh weights (Table 4) were statistically
significant (P<0.01). Carcass yield after slaughter (not
eviscerated) (P<0.05), carcass yield (P<0.01), breast yield
(P<0.01), wing yield (P<0.01), left thigh yield (P<0.01), and
gizzard yield (P<0.05) varied between the study groups.
difference between the sexes was statistically significant
(P<0.001) (Table 6).
The study groups differed significantly for heart
length (P<0.001), cardiac fat area (P<0.01), gizzard width
(P<0.01), and intestine length (P<0.01) (Figures 1, 2, and 3)
(Table 7). The heart length and gizzard width were highest
in Group I (2.94), the cardiac fat area was largest in Group
III (7.40), and the intestine length was greatest in Group V
(2.00).
Discussion
The mean hatchling weight calculated for all of the study
groups was 8.50 g. The hatching weight of the chicks was
highest in Group I (8.61 g) and lowest in Group V (8.43 g). The
chick weights determined for the quail chicks in the present
study were lower than the hatchling weight (10.02 g) reported
by Obregón et al. (2012) and higher than the hatching weight
(7.80 g) reported by Caglayan and Seker (2013) for quail
Group Sex Week 3 (g) Week 4 (g) Week 5 (g) Shank length in the 5th week (mm)
I (2.94) Female 139.48±1.85 181.33±2.49 227.94±3.37 34.15±0.20
Male 140.23±1.99 181.95±2.34 202.51±3.06 33.59±0.20
t −0.276 −0.179 5.603 1.973
P-value 0.784 0.858 0.000 0.052
II (4.87) Female 134.00±1.92 177.10±2.46 217.71±3.18 33.94±0.24
Male 135.52±1.50 177.59±2.02 207.71±2.49 33.66±0.18
t −0.604 −0.150 2.489 0.934
P-value 0.548 0.881 0.015 0.353
III (7.40) Female 138.80±1.84 185.98±2.49 233.43±2.98 34.25±0.25
Male 133.38±1.66 176.18±2.17 204.56±3.43 34.10±0.17
t 2.187 2.976 6.313 0.486
P-value 0.032 0.004 0.000 0.628
IV (6.41) Female 133.38±1.66 184.32±1.99 229.28±2.97 34.63±0.19
Male 139.07±1.72 176.32±2.17 202.42±3.31 33.56±0.20
t 1.274 2.706 6.011 3.904
P-value 0.207 0.008 0.000 0.000
V (2.00) Female 137.81±1.89 183.85±2.15 227.33±3.30 34.39±0.15
Male 135.50±2.12 178.95±2.44 208.79±5.19 33.44±0.18
t 0.808 1.493 2.963 3.983
P -value 0.422 0.139 0.004 0.000
t - independent samples (t test); P-value - significance level (α = 0.05).
Table 3 - Body weights of animals included in each study group with respect to sex
Group Chick weight (g) Week 1 Week 2 Week 3 Week 4 Week 5 Shank length in the 5th week (mm)
I (2.94) 8.61±0.08 37.15±0.47a 86.13±0.87a 139.87±1.35 181.65±1.69 214.74±2.67 33.86±0.14 n=122 n=109 n=105 n=79 n=79 n=79 n=79 II (4.87) 8.50±0.08 33.72±0.39c 79.64±0.78c 134.69±1.25 177.32±1.62 212.58±2.07 33.79±0.15 n=133 n=132 n=121 n=78 n=78 n=78 n=78 III (7.40) 8.47±0.08 35.10±0.35b 81.53±0.71bc 136.06±1.27 181.01±1.73 218.45±2.80 34.17±0.15 n=127 n=120 n=117 n=79 n=79 n=79 n=79 IV (6.41) 8.50±0.07 35.05±0.47b 83.50±0.78b 137.47±1.21 180.17±1.54 215.34±2.69 34.07±0.15 n=133 n=111 n=106 n=79 n=79 n=79 n=79 V (2.00) 8.43±0.08 36.09±0.42ab 80.65±0.96c 136.59±1.43 181.28±1.65 217.71±3.28 33.90±0.13 n=123 n=111 n=109 n=80 n=80 n=79 n=79 Overall 8.50±0.04 35.35±0.20 82.19±0.38 136.94±0.59 180.30±0.74 215.77±1.22 33.96±0.07 n=638 n=583 n=558 n=395 n=395 n=394 n=394 F 0.719 9.666 9.693 2.175 1.113 0.746 1.175 P-value 0.579 0.000 0.000 0.071 0.350 0.561 0.321
a-c - differences between mean values with different letters in the same column are statistically significant (P<0.001). F - ANOVA; P-value - significance level (α = 0.05).
Characteristic I (2.94)n=39 II (4.87)n=39 III (7.40)n=40 IV (6.41)n=39 V (2.00)n=39 F P-value n=197Total
Slaughter weight (g) 213.69±2.53 210.41±1.57 218.10±2.88 213.17±2.37 215.04±2.25 1.414 0.231 214.11±1.06
WCAS (g) 175.24±1.88 171.52±1.32 174.73±2.34 170.07±1.76 172.98±1.46 1.454 0.218 172.92±0.80
Carcass weight1 (g) 162.40±1.65 159.11±1.18 160.85±1.99 157.12±1.61 160.16±1.33 1.544 0.191 159.93±071 Breast weight (g) 58.84±0.85 57.12±0.84 58.73±2.48 57.53±0.76 56.12±0.63 0.761 0.552 57.66±0.59 Wing weight (g) 13.61±0.20b 13.59±0.18b 15.53±0.93a 13.53±0.18b 15.08±0.26a 4.332 0.002 14.28±0.21 Right thigh weight (g) 29.87±0.37 29.27±0.38 29.25±0.56 28.38±0.51 29.25±0.32 1.458 0.217 29.21±0.20 Left thigh weight (g) 29.50±0.40a 28.67±0.27ab 28.31±0.42cb 27.63±0.30c 28.72±0.32ab 3.814 0.005 28.56±0.16 Back and neck weight (g) 30.67±0.42 29.87±0.43 30.52±0.51 29.81±0.49 30.74±0.39 0.977 0.421 30.32±0.20
Heart weight (g) 2.06±0.05 2.00±0.04 2.77±0.61 2.04±0.05 2.00±0.05 1.430 0.225 2.18±0.13
Liver weight (g) 5.96±0.28 5.66±0.22 6.15±0.29 5.75±0.24 5.89±0.19 0.574 0.681 5.88±0.11
Gizzard weight (g) 4.82±0.12 4.75±0.12 4.95±0.13 5.15±0.14 4.92±0.12 1.453 0.218 4.92±0.06
Intestine weight (g) 9.43±0.32 9.12±0.24 8.92±0.33 9.32±0.32 9.24±0.25 0.506 0.731 9.21±0.13
CYAS (%) 82.08±0.37a 81.54±0.40ab 80.20±0.60bc 79.87±0.51c 80.60±0.63abc 3.241 0.013 80.85±0.23 Carcass yield2 (%) 76.09±0.38a 75.67±0.44a 73.86±0.50b 73.81±0.54b 74.64±061ab 4.232 0.003 74.81±0.23 Breast yield (%) 33.56±0.25a 33.30±0.40ab 32.22±0.39c 33.83±0.29a 32.43±0.20bc 5.030 0.001 33.06±0.15
Wing yield (%) 7.78±0.10b 7.94±0.12b 8.85±0.43a 7.98±0.12b 8.72±0.13a 4.922 0.001 8.26±0.10
Right thigh yield (%) 17.06±0.14 17.06±0.15 16.77±0.26 16.66±0.19 16.91±0.13 0.953 0.435 16.89±0.08 Left thigh yield (%) 16.84±0.15a 16.72±0.14a 16.21±0.14b 16.26±0.10b 16.61±0.13ab 4.352 0.002 16.53±0.06 Back and neck yield (%) 17.52±0.29 17.41±0.21 17.48±0.19 17.53±0.22 17.78±0.20 0.475 0.754 17.54±0.09
Heart yield (%) 1.18±0.03 1.17±0.02 1.54±0.30 1.20±0.02 1.16±0.03 1.473 0.212 1.25±0.06
Liver yield (%) 3.38±0.14 3.29±0.12 3.50±0.15 3.37±0.13 3.40±0.11 0.344 0.848 3.39±0.06
Gizzard yield (%) 2.75±0.07b 2.77±0.07b 2.84±0.06b 3.03±0.08a 2.84±0.06b 2.781 0.028 2.85±0.03
Table 4 - Slaughter and carcass characteristics of the study groups
a-c - differences between mean values with different letters in the same row are statistically significant (P<0.001). F - ANOVA, P-value - significance level (α = 0.05).
WCAS - carcass weight after slaughter (not eviscerated); CYAS - carcass yield after slaughter (not eviscerated). 1 Excluding the weight of all visceral organs, except for the kidneys.
2 Calculated on the basis of the carcass weight.
A - left lateral surface-1; B - right lateral surface-2; C - length; D - width.
Figure 1 - Gizzard measurements.
A - length; B - width; C - cardiac fat area.
chicks. The mean hatching weight calculated for all of the
study groups was similar to the mean hatching weights
reported by Nowaczewski et al. (2010) (8.4 g) and Seker
et al. (2004) (8.10 g).
The body weight of the female quails measured in
the 5th week being greater than that of the males was in
agreement with previous reports made for Japanese quails
by Yalcın et al. (1996), Aytac and Karabayir (2012), and
Caglayan and Seker (2015). In the 5th week, the highest
body weight for the female quails was 233.43 g in Group III,
whilst the highest body weight for the male quails was
208.79 g in Group V. These values were higher than the
198.06 g for females and 163.28 g for males reported by
Alkan et al. (2010) and 139.56 g for females and 137.54 g
for males by Karadavut and Taşkın (2014).
In the present study, the mean shank length was 33.96
mm. This value was reported as 3.7 cm for five-week-old
animals by Wilkanowska et al. (2013) and as 3.93 cm for
six-week-old animals by Momoh et al. (2014). The results
of the present study demonstrated that the shank length of
five-week-old quail chicks ranged between 33.94-34.63 mm
in females and between 33.44-34.10 mm in males. The shank
lengths measured in the 5th week in the present study were
higher than the shank lengths reported by Caglayan and
Seker (2015) for females (28.38 mm) and males (27.78 mm).
The slaughter weights of the animals in Groups I, II,
III, IV, and V (213.69, 210.41, 218.10, 213.17, and 215.04 g,
respectively) were higher than the slaughter weights of
Japanese quails measured by Bonos et al. (2010), Hassan
et al. (2015), and Caglayan and Seker (2013) as 154.6 g,
168.29 g, and 116.53 g, respectively. While the slaughter
weights measured in all of the study groups in the present
study were similar to the slaughter weight (213.58 g) reported
by Obregón et al. (2012), the carcass weight determined in
the present study (159.93 g) was higher than that reported
by the same researchers (128.97 g). The carcass yields
determined in Group I (76.09%) and Group II (75.67%)
were similar to the carcass yield previously reported by
Bonos et al. (2010) (76.37%). The carcass yields determined
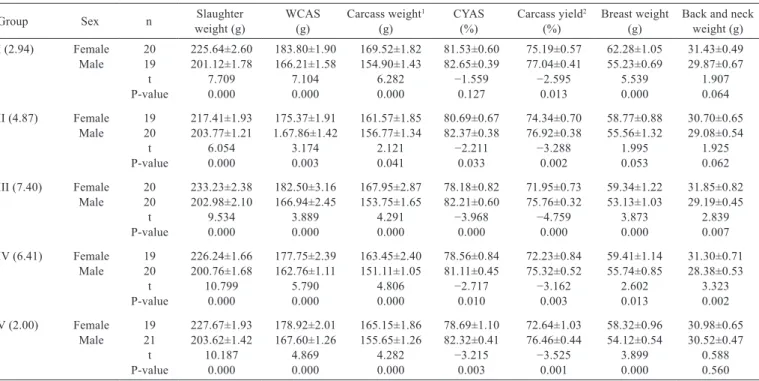
Table 5 - Slaughter and carcass characteristics of the study groups with respect to sex
Group Sex n weight (g)Slaughter WCAS (g) Carcass weight(g) 1 CYAS (%) Carcass yield(%) 2 Breast weight (g) Back and neck weight (g)
I (2.94) Female 20 225.64±2.60 183.80±1.90 169.52±1.82 81.53±0.60 75.19±0.57 62.28±1.05 31.43±0.49 Male 19 201.12±1.78 166.21±1.58 154.90±1.43 82.65±0.39 77.04±0.41 55.23±0.69 29.87±0.67
t 7.709 7.104 6.282 −1.559 −2.595 5.539 1.907
P-value 0.000 0.000 0.000 0.127 0.013 0.000 0.064
II (4.87) Female 19 217.41±1.93 175.37±1.91 161.57±1.85 80.69±0.67 74.34±0.70 58.77±0.88 30.70±0.65 Male 20 203.77±1.21 1.67.86±1.42 156.77±1.34 82.37±0.38 76.92±0.38 55.56±1.32 29.08±0.54
t 6.054 3.174 2.121 −2.211 −3.288 1.995 1.925
P-value 0.000 0.003 0.041 0.033 0.002 0.053 0.062
III (7.40) Female 20 233.23±2.38 182.50±3.16 167.95±2.87 78.18±0.82 71.95±0.73 59.34±1.22 31.85±0.82 Male 20 202.98±2.10 166.94±2.45 153.75±1.65 82.21±0.60 75.76±0.32 53.13±1.03 29.19±0.45
t 9.534 3.889 4.291 −3.968 −4.759 3.873 2.839
P-value 0.000 0.000 0.000 0.000 0.000 0.000 0.007
IV (6.41) Female 19 226.24±1.66 177.75±2.39 163.45±2.40 78.56±0.84 72.23±0.84 59.41±1.14 31.30±0.71 Male 20 200.76±1.68 162.76±1.11 151.11±1.05 81.11±0.45 75.32±0.52 55.74±0.85 28.38±0.53
t 10.799 5.790 4.806 −2.717 −3.162 2.602 3.323
P-value 0.000 0.000 0.000 0.010 0.003 0.013 0.002
V (2.00) Female 19 227.67±1.93 178.92±2.01 165.15±1.86 78.69±1.10 72.64±1.03 58.32±0.96 30.98±0.65 Male 21 203.62±1.42 167.60±1.26 155.65±1.26 82.32±0.41 76.46±0.44 54.12±0.54 30.52±0.47
t 10.187 4.869 4.282 −3.215 −3.525 3.899 0.588
P-value 0.000 0.000 0.000 0.003 0.001 0.000 0.560
WCAS - carcass weight after slaughter (not eviscerated); CYAS - carcass yield after slaughter (not eviscerated); t - independent samples (t test); P-value - significance level (α = 0.05). 1 Excluding the weight of all visceral organs except for the kidneys.
2 Calculated on the basis of the carcass weight.
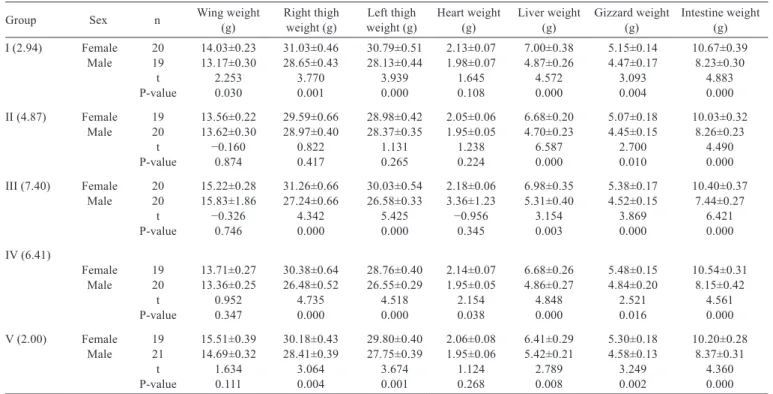
Table 6 - Slaughter and carcass characteristics of the study groups with respect to sex
Group Sex n Wing weight(g) Right thigh weight (g) weight (g)Left thigh Heart weight (g) Liver weight (g) Gizzard weight (g) Intestine weight (g)
I (2.94) Female 20 14.03±0.23 31.03±0.46 30.79±0.51 2.13±0.07 7.00±0.38 5.15±0.14 10.67±0.39
Male 19 13.17±0.30 28.65±0.43 28.13±0.44 1.98±0.07 4.87±0.26 4.47±0.17 8.23±0.30
t 2.253 3.770 3.939 1.645 4.572 3.093 4.883
P-value 0.030 0.001 0.000 0.108 0.000 0.004 0.000
II (4.87) Female 19 13.56±0.22 29.59±0.66 28.98±0.42 2.05±0.06 6.68±0.20 5.07±0.18 10.03±0.32
Male 20 13.62±0.30 28.97±0.40 28.37±0.35 1.95±0.05 4.70±0.23 4.45±0.15 8.26±0.23
t −0.160 0.822 1.131 1.238 6.587 2.700 4.490
P-value 0.874 0.417 0.265 0.224 0.000 0.010 0.000
III (7.40) Female 20 15.22±0.28 31.26±0.66 30.03±0.54 2.18±0.06 6.98±0.35 5.38±0.17 10.40±0.37
Male 20 15.83±1.86 27.24±0.66 26.58±0.33 3.36±1.23 5.31±0.40 4.52±0.15 7.44±0.27
t −0.326 4.342 5.425 −0.956 3.154 3.869 6.421
P-value 0.746 0.000 0.000 0.345 0.003 0.000 0.000
IV (6.41)
Female 19 13.71±0.27 30.38±0.64 28.76±0.40 2.14±0.07 6.68±0.26 5.48±0.15 10.54±0.31
Male 20 13.36±0.25 26.48±0.52 26.55±0.29 1.95±0.05 4.86±0.27 4.84±0.20 8.15±0.42
t 0.952 4.735 4.518 2.154 4.848 2.521 4.561
P-value 0.347 0.000 0.000 0.038 0.000 0.016 0.000
V (2.00) Female 19 15.51±0.39 30.18±0.43 29.80±0.40 2.06±0.08 6.41±0.29 5.30±0.18 10.20±0.28
Male 21 14.69±0.32 28.41±0.39 27.75±0.39 1.95±0.06 5.42±0.21 4.58±0.13 8.37±0.31
t 1.634 3.064 3.674 1.124 2.789 3.249 4.360
P-value 0.111 0.004 0.001 0.268 0.008 0.002 0.000
t - independent samples (t test); P-value - significance level (α = 0.05).
in all of the study groups in the present study were higher
than the carcass yields reported by Obregón et al. (2012)
(61.14%) and Caglayan and Seker (2013) (58.65%).
In the present study, the slaughter weights being greater
in female quails in comparison with males in all of the
study groups was in agreement with the results of several
literature reports (Alkan et al., 2010; Bonos et al., 2010;
Aytac and Karabayir, 2012; Kosshak et al., 2014; Ojedapo
and Amao, 2014; Hassan et al., 2015; Karadavut and
Taşkın, 2014; Caglayan and Seker, 2015), but differed from
the report of Caglayan and Seker (2013). Furthermore, the
carcass yields of the males being higher than those of the
females in all of the study groups was in agreement with the
results reported by Alkan et al. (2010), Kosshak et al. (2014),
and Hassan et al. (2015).
The mean values determined in the present study for
the heart weight and cardiac fat area (2.18 g and 0.78 cm
2)
were higher than the values reported by Caglayan and Seker
(2013) (0.99 g) and Hassan et al. (2015) (1.5 g) and lower
than the value reported by Guluwa et al. (2014) (4.05 g).
Average gizzard length and gizzard width (2.84 and
2.55 cm) were higher than those determined by Omonona
et al. (2014) as 2.10 and 1.83 cm, respectively.
In the present study, the mean intestine length and
intestine weight values calculated for all of the study
groups were 74.76 cm and 9.21 g, respectively. While the
Table 7 - Digital image analysis measurements of the length, width, and surface area of some visceral organs for the different studygroups
Characteristic n I (2.94) III (7.40) IV (6.41) V (2.00) F P-value Overall
Heart length (cm) 39 1.91±0.03a 1.73±0.03b 1.69±0.04b 1.77±0.05b 8.153 0.000 1.78±0.02
Heart width (cm) 40 1.47±0.02 1.43±0.02 1.44±0.02 1.43±0.03 1.243 0.297 1.44±0.01
Heart surface area (cm2) 29 2.75±0.05 2.74±0.04 2.67±0.05 2.69±0.09 0.528 0.664 2.72±0.03
Cardiac fat area (cm2) 19 0.74±0.04bc 0.86±0.03a 0.82±0.03ab 0.65±0.06c 4.725 0.004 0.78±0.02
Gizzard length (cm) 39 2.89±0.32 2.84±0.04 2.76±0.05 2.87±0.05 1.494 0.220 2.84±0.02
Gizzard width (cm) 40 2.63±0.03a 2.55±0.03ab 2.49±0.04b 2.47±0.05b 4.377 0.006 2.55±0.02
Gizzard area-1 (cm2) 29 5.60±0.10 5.34±0.09 5.21±0.12 5.40±0.14 2.375 0.073 5.40±0.06
Gizzard area-2 (cm2) 21 5.65±0.09 5.38±0.09 5.27±0.11 5.43±0.16 2.531 0.060 5.44±0.05
Intestine length (cm) 74.09±1.04b 73.90±1.14b 72.39±1.47b 78.45±1.25a 4.397 0.005 74.76±0.12 n=39 n=40 n=29 n=35 n=143
mean intestine length determined in this study was similar
to that reported by Wilkanowska et al. (2013) for
five-week-old Japanese quails (73.3 cm), this value was higher than that
reported by Hassan et al. (2015) for six-week-old animals
(54.86 cm). Furthermore, the total length (63.44 cm) of the
small (55.6 cm) and large (7.84 cm) intestines and the
intestine weight (5.35 g) reported by Hena et al. (2012);
the total length (56.41) of the small (50.02 cm) and large
(6.39 cm) intestines and the intestine weight (3.86 g)
reported by Guluwa et al. (2014); and the total intestine
length (61.93 cm) and intestine weight (7.69 g) reported
by Samadi and Sahneh (2015) were lower than the results
obtained in the present study.
Conclusions
Body weight, shank length, and slaughter and carcass
weight do not vary in relation to eggshell colour or the size
of the spotted area. The eggshell colour or the size of the
spotted area affect wing weight, left thigh weight, yield of
the carcass after slaughter (not eviscerated), carcass yield,
breast yield, wing yield, and gizzard yield. The lengths of
intestine and heart, gizzard width, and cardiac fat area vary
in relation to eggshell colour or the size of the spotted area.
Acknowledgments
The present study was supported by the Scientific
Research Project Unit of Mustafa Kemal University, Turkey
(Project no. 1206 M 0117).
References
Alkan, S.; Karabağ, K.; Galiç, A.; Karslı, T. and Balcıoğlu, M. S. 2010. Determination of body weight and some carcass traits in Japanese quails (Coturnix coturnix japonica) of different lines. Journal of the Faculty of Veterinary Medicine, Kafkas University 16:277-280.
Aytac, S. and Karabayir, A. 2012. The effect of floor differences in cages on the incubation results and live weight of Japanese quails. Journal of Animal and Veterinary Advances 11:1204-1207. Bonos, E. M.; Christaki, E. V. and Florou-Paner, P. C. 2010. Performance
and carcass characteristics of Japanese quail as affected by sex or mannan oligosaccharides and calcium propionate. South African Journal of Animal Science 40:173-184.
Caglayan, T. and Seker, E. 2013. Effect of Mentha caucasica on growth performance and carcass characteristics of Japanese quail (Coturnix coturnix japonica). Journal of Animal and Veterinary Advances 12:909-913.
Caglayan, T. and Seker, E. 2015. Dağ nanesinin (Mentha caucasica) japon bıldırcınlarının (Coturnix coturnix japonica) performans, bazı vücut ölçüleri ve canlı ağırlık arasındaki ilişkilerine etkisi. Eurasian Journal of Veterinary Sciences 31:33-42.
Duval, C.; Cassey, P.; Mikšík, I.; Reynolds, S. J. and Spencer, K. A. 2013. Condition-dependent strategies of eggshell pigmentation: an
experimental study of Japanese quail (Coturnix coturnix japonica). The Journal of Experimental Biology 216:700-708.
Farghly, M. F. A. 2012. Effect of light pulses during incubation on hatch performance in different eggs size of Japanese quail. In: Proceedings of the 3rd Mediterranean Poultry Summit of WPSA and The International Poultry Conference, Alexandria, Egypt. Farghly, M. F. A.; Mahrose, Kh. M. A. and Abou-Kassem, D. E. 2015.
Pre and post hatch performance of different Japanese quail egg colors incubated under photostimulation. Asian Journal of Poultry Science 9:19-30.
García-Navas, V.; Sanz, J. J.; Merino, S.; Martínez-de la Puente, J.; Lobato, E.; del Cerro, S.; Rivero, J.; Ruiz de Castañeda, R. and Moreno, J. 2011. Experimental evidence for the role of calcium in eggshell pigmentation pattern and breeding performance in Blue Tits Cyanistes caeruleus. Journal of Ornithology 152:71-82. Guluwa, L. Y.; Madaki, Y. A.; Machido, H.; Dantayi, R. J. and
Kulokom, S. 2014. Growth performance and carcass evaluation of quails fed graded levels of water soaked sweet orange peel meal (SOPM). Advances in Life Science and Technology 20:2224-7181. Hargitai, R.; Herényi, M. and Török, J. 2008. Eggshell coloration in
relation to male ornamentation, female condition and egg quality in the collared flycatcher Ficedula albicollis. Journal Avian Biology 39:413-422.
Hassan, H. A.; El-Nesr, S. S.; Osman A. M. R. and Arram G. A. 2013. Ultrastructure of eggshell, egg weight loss and hatching traits of Japanese quail varying in eggshell color and pattern using image analysis. Egyptian Poultry Science Journal 34:1-17.
Hassan, K. H.; Abd-Alsattar, A. R.; Yassen, H. A. A.; Abed, H. T. and Abdul Wahab, D. A. A. 2015. Effect of variety, age and sex in some productive traits in Japanese quail in Iraq. American Journal of Bio Science 3:55-58.
Hena, S. A.; Sonfada, M. L.; Danmaigoro, A.; Bello, A. and Umar, A. A. 2012. Some comparative gross and morphometrical studies on the gastrointestinal tract in pigeon (columbia livia) and Japanese quail (coturnix japonica). Scientific Journal of Veterinary Advances 1:57-64.
Karadavut, U. and Taşkın, A. 2014. Estimation of heritability of weight gain of Japanese quail by using analysis of variance, maximum and restricted Likelihood tests. Turkish Journal of Agricultural and Natural Sciences 1:59-63.
Khurshid, A.; Farooq, M.; Durrani, F. R.; Sarbiland, K. and Chand, N. 2003. Predicting egg weight, shell weight, shell thickness and hatching chick weight of Japanese quails using various egg traits as regressors. International Journal Poultry Science 2:164-167. Kosshak, A. S.; Dim, N. I.; Momoh, O. M. and Gambo, D. 2014.
Effect of sex on carcass characteristics and correlation of body weight and blood component in Japanese quails. IOSR Journal of Agriculture and Veterinary Science 7:72-76.
Krist, M. and Grim, T. 2007. Are blue eggs a sexually selected signal of female collared flycatchers? A cross-fostering experiment. Behavioral Ecology and Sociobiology 61:863-876.
McLelland, J. 1990. A colour atlas of avian anatomy. BPCC Hazell Books Ltd, Aylesbury, England.
Momoh, O. M.; Gambo, D. and Dim, N. I. 2014. Genetic parameters of growth, body, and egg traits in Japanese quails (Cotournix cotournix japonica) reared in southern guinea savannah of Nigeria. Journal of Applied Biosciences 79:6947-6954.
Moreno, J. and Osorno, J. L. 2003. Avian egg colour and sexual selection: does eggshell pigmentation reflect female condition and genetic quality? Ecology Letters 6:803-806.
Moreno, J.; Osorno, J. L.; Morales, J.; Merino, S. and Tomás, G. 2004. Egg colouration and male parental effort in the Pied Flycatcher Ficedula Hypoleuca. Journal of Avian Biology 35:300-304. Moreno, J.; Morales, J.; Lobato, E.; Merino, S.; Tomás, G. and
of egg color in the pied flycatcher Ficedula hypoleuca. Behavioral Ecology 16:931-937.
Moreno, J.; Lobato, E.; Morales, J.; Merino, S.; Tomás, G.; Martínez-de la Puente, J.; Sanz, J. J.; Mateo, R. and Soler, J. J. 2006. Experimental evidence that egg color indicates female condition at laying in a songbird. Behavioral Ecology 17:651-655.
Narahari, D.; Mujeer, K. A.; Thangavel, A.; Ramamurthy, N.; Viswanathan, S.; Mohan, B.; Muruganandan, B. and Sundararasu, V. 1988. Traits influencing the hatching performance of Japanese quail eggs. British Poultry Science 29:101-112.
Nowaczewski, S.; Witkiewicz, K.; Kontecka, H.; Krystianiak S. and Rosıński A. 2010. Eggs weight of Japanese quail vs. eggs quality after storage time and hatchability results. Archiv Tierzucht 53:720-730.
Obregón, J. F.; Bell, C.; Elenes, I.; Estrada, A.; Portillo J. J. and Ríos F. G. 2012. Effect of discarded chickpea (Cicer arietinum L.) cooking on the productive response and carcass yield of Japanese quail (Coturnix coturnix japonica) at the fattening stage. Cuban Journal of Agricultural Science 46:169-173.
Ojedapo, L. O. and Amao S. R. 2014. Sexual dimorphism on carcass characteristics of Japanese quail (Coturnix coturnix japonica)
reared in derived savanna zone of Nigeria. International Journal Science, Environment and Technology 3:250-257.
Omonona, A. O.; Olukole, S. G. and Fayemi, O. O. 2014. Assessment of the developmental anatomy of the Japanese quail (Coturnix japonica) using the gizzard as a growth indicator. PAT 10:12-21. Samadi, F. and Sahneh, M. 2015. Effects of Artichoke (Cynara
scolymus L.) leaf meal and vitamin E on productive performance: intestinal microflora and morphology in Japanese quail. Poultry Science Journal 3:87-98.
Seker, I.; Kul, S. and Bayraktar, M. 2004. Effects of parental age and hatching egg weight of Japanese quails on hatchability and chick weight. International Journal of Poultry Science 3:259-265. Siefferman, L.; Navara, K. J. and Hill G. E. 2006. Egg coloration
is correlated with female condition in eastern bluebirds (Sialia sialis). Behavioral Ecology and Sociobiology 59:651-656. Wilkanowska, A.; Kokoszyński D. and Cieślińska J. 2013. Body
conformation and morphometry of some internal organs of Pharaoh quail of different ages. Journal of Central European Agriculture 14:358-368.