ISSN 0101-2061 Food Science and Technology
DI:
D http://dx.doi.org/10.1590/1678-457X.16616
1 Introduction
An increasing search of the population for topics related to health, correct nutrition and well-being has been recently observed. These topics are directly reflected in the food industry, with the increasing implementation of higher nutritional value products and redevelopment of products aiming to meet this healthiness trend (São Paulo, 2010).
Smoothies are fruit- and/or vegetable-based products and may be considered as additive-free and sugar free products, being of high nutritional interest and convenience to the consumer. In a market where consumers seek for high quality and suitable products, with a simple composition, minimally processed and at a high organoleptic and nutritional quality, smoothies have a prominent place (Keenan et al., 2012).
The stability or shelf-life of a food is defined as the period of time during which it can be stored under certain temperature, humidity, light, etc. conditions, suffering small changes which are considered as acceptable by the manufacturer, the consumer, and the food legislation in force (Moura & Germer, 2010).
Several changes may occur in food during processing and storage when it is exposed to different environmental conditions that may trigger a series of reactions, leading to its degradation and consequent rejection by consumers. Quality changes in fruit-based drinks involve physicochemical, microbiological and sensory changes usually related to heat treatment, chemical composition and initial quality of the drink, oxygen dissolved and present in free space, storage temperature, package and surface of contact, among others (Singh, 2014).
Measurement of equipment used in food processing, mainly that working with pumping and fluids influenced by temperature, requires precise data of thermal properties (density, thermal conductivity, thermal diffusivity and specific heat), as well as rheological properties specially involved in pumping and fluid transportation during the production line and the way these properties behave during process according to the temperature (Mulvaney et al., 2000).
Natural dyes belong to two main classes: carotenoids and flavonoids, with anthocyanins belonging to the latter. They are liable for a wide range of colors present in fruits, flowers and leaves, varying from bright red to purple and blue, and are found in many dark fruits such as raspberries, blackberries, cherries, grapes, and strawberries (Delgado-Vargas & Paredes-López, 2002).
Anthocyanin color is unstable and susceptible to changes due to several factors, such as: structure and concentration of anthocyanins present in fruits, pH, temperature, light, presence of acids, sugars, phenols, metallic ions, in addition to substances called copigments (Delgado-Vargas & Paredes-López, 2002). The temperature may also be liable for anthocyanins degradation with a consequent reduction of their color, in addition of providing the appearance of mould (Dms-Dliu et al., 2012). In general, extracts stored at low temperatures are more stable in comparison with those stored at room temperature. In addition, exposure to light should also be avoided for these extracts, since UV radiation interacts in extract promoting reactions, such as copigmentation with other compounds, consequently changing
Characterization and evaluation of stability of bioactive compounds in fruit smoothies
Sílvia Cristina Sobottka Rolim de MDURA1*, Fernanda Zaratini VISSDTTD2, Shirley Aparecida Garcia BERBARI1, Elaine de Cássia Guerreiro SDUZA1, Fabíola Guirau Parra TDTI1, Paulo ALVES JÚNIDR3
Received 08 July, 2016 Accepted 15 Nov., 2016
1Centro de Tecnologia de Frutas e Hortaliças – FRUTHOTEC, Instituto de Tecnologia de Alimentos – ITAL, Campinas, SP, Brazil 2Centro de Tecnologia de Cereais e Chocolates – CEREAL CHOCOTEC, Instituto de Tecnologia de Alimentos – ITAL, Campinas, SP, Brazil 3Faculdade de Engenharia de Alimentos, Universidade Estadual de Campinas – UNICAMP, Campinas, SP, Brazil
*Corresponding author: smoura@ital.sp.gov.br Abstract
Smoothies are drinks composed of a mixture of vegetables (fruits, vegetables), which can be added or not by milk or yogurt, being a high creamy, healthy beverage and a good source of energy, vitamins, and minerals. Samples of three commercial smoothies: Yellow Fruits (YF), Red Fruits (RF), and Green Vegetables (GV) stored in a glass packaging (260 mL) were characterized for pH, soluble solids (°Brix), water activity (aw), density, rheology and thermal properties, and stored at controlled temperatures of 10 °C and 25 °C in the absence of light. During the period of 180 days, the samples were evaluated for color, polyphenol and anthocyanin contents, and sensorially monitored by odor, taste, overall quality and color characteristics. The smoothies showed similar physicochemical and thermophysical properties to pulp fruit and juice concentrates. The rheological behavior of the samples followed the power law model and was adjusted to the Arrhenius model. All the samples showed a reduction in bioactive compounds, change in color, taste and odor, with these being more significant at the room temperature.
Keywords: smoothie; rheology; phenolic compounds; shelf-life; sensory evaluation.
the stability of anthocyanins and forming oxidative degradation products which are brown colored (Amr & Al-Tamimi, 2007).
The objective of the study in question was the characterization with respect to physicochemical, thermophysical and rheological properties of fruit smoothies’ samples, considering a growing demand of their consumption. A study of smoothies’ stability as for color, antioxidant compounds and sensory characteristics for 180 days when stored at the temperatures of 10 °C and 25 °C in the absence of light was also conducted.
2 Materials and methods
2.1 Material
Commercial smoothies samples of 03 flavors: YF (yellow color, containing apricot, mango, acerola, passion fruit, and cupuaçu), RF (red color, containing strawberry, plum, cherry, raspberry, apple, cranberry, and pomegranate) and GV (green color, containing kiwi, pineapple, lemon, green tea, mint, and chlorophyll) were stored in 260 g glass bottles, with the label as a plastic coating on the entire bottle. The samples were stored in BDD chambers simulating the storage at room temperature (25 °C) and under refrigeration (10 °C) in the absence of light.
2.2 Methods
Determination of pH
Conducted in a pH meter (Digimed, model DM-20, Brazil) (Instituto Adolfo Lutz, 1985). The mean value was calculated from three measurements from each sample.
Soluble solids (SST)
Determined in an optical refractometer (ATAGD, model PAL-α, Japan) (Instituto Adolfo Lutz, 1985). The mean value was calculated from three measurements from each sample.
Activity of water (Aw)
Analyzed directly in a water activity meter (Aqualab, series 3TE, model cx-2, Brazil), at a constant temperature of 25°C. The mean value was calculated from three measurements from each sample.
Instrumental color
Conducted directly in a instrumental color equipment (Minolta, model CR-400, Japan), by using rectangular coordinates – CieLab: L* representing luminosity, a* representing the green-red axis, and b* representing the yellow-blue axis. The mean value of each parameter was calculated from four measurements from each sample. Dther parameters were also calculated: ΔE (Equation 1), Chroma (Equation 2) and Hue (Equation 3).
2 2 2 2
∆ = ∆E L* * * + ∆a + ∆b (1)
(
)
* *2 *2
Chroma or Saturation =C = a +b (2)
*
* * b
Hue H artan
a
= =
(3)
Total polyphenols
The analysis was conducted according to Folin-Ciocalteu method, with extraction in a single phase using acetone 70% and standard curve calibration with gallic acid. The analytical values are expressed in gallic acid equivalents (Kiralp & Toppare, 2006). The mean value was calculated from three measurements from each sample.
Total anthocyanins
Conducted as DPPH methods, with acidified hydroalcoholic extraction (Association of Dfficial Analytical Chemists, 2006). The mean value was calculated from three measurements from each sample.
Density (ρ)
Conducted as per fluid displacement methodology in pycnometers, described in rule no. 985.19 of ADAC (Williams, 1990) at four different temperatures (10, 30, 60 and 90 °C), kept constant by using ultra thermostatic bath (Marqlabor, model BUT-10, Brazil). The mean value was calculated from three measurements from each sample and compared to a model proposed by Peacock (1995) (Equation 4) with calculation of relative error (Equation 5).
Peacock (1995)
( )
( 20)
(
3)
200
10001 1 0.036 /
54000 160
T SST
SST kg m
T − + = + × − −
ρ (4)
where: SST = soluble solid content (°Brix); T = temperature (°C).
( ) –
Relative error % theoretical value experimental value 100 experimental value
= ×
(5)
Specific heat (Cp)
The determination of specific heat was conducted through an adaptation of Hwang and Hayakawa method described in Rahman (2009) in a mixture calorimeter. The mean value was calculated from three measurements from each sample. For specific heat calculation the Equation 6 is applied, which is obtained through energy balance.
( )
( )
dT dT
Hk Cpw Ww Tfw Tow te Cps Ws Tfw Toc te
dt dt
Cp
dT Wc Toc Tfw te
dt + × × − − + × − − = − + (6)
Thermal diffusivity (α)
The method used to determine the thermal diffusivity is based on the Dickerson method described in Rahman (2009). The mean value was calculated from three measurements from each sample. The thermal diffusivity is calculated by the following Equation 7.
( )
2
4 ext int A R
T T
× =
× −
a (7)
where: α = thermal diffusivity; A = rate of bath temperature increase (°C/s); R = cell radius (m); (Text - Tint) = difference between external and internal temperature of the cell (°C).
Thermal conductivity (k)
Determined after knowing the density (ρ), thermal diffusivity (α) and specific heat (Cp) of the product by using the ratio (Equation 8).
k= ×ρ Cp×a (8)
Rheological behavior
Rheological determinations were made in a rotational programmable rheometer (Brookfield, model DVIII+, USA) by using a small sample adaptor, a cylindrical spindle (S15 specification) coupled into a bath with thermostatic control (Brookfield, TC-500, EUA).
The apparent viscosity behavior was verified at three predetermined temperatures, 25, 50 and 90 °C. The rheometer programming was set to 20 rpm for 120 seconds to each temperature and apparent viscosity data (µ) was collected on each case. The Arrhenius Equation 9 was used to check data adjustment.
0
ln ln Ea
R T
= +
×
µ µ (9)
where: µ0 = initial apparent viscosity (Pa); Ea = activation energy (KJ/mol); R = 8.314 (J/mol.Kelvin); T = temperature (Kelvin).
The rheological behavior of the fluid was verified at three temperatures, 25, 50 and 90 °C, with programming appropriately set for deformation rates from 0 to 50 s-1. Shear stress data were
obtained for each deformation rate applied.
Data obtained in experiments was statistically analyzed by computer programs (STATISTICA, version 10, StatSoft), adjusting to theoretical models of Dstwald-de-Waelle or Power Law (Equation 10) and Herschel-Bulkley (Equation 11).
( )n K =
σ γ (10)
( )
no K
= +
σ σ γ (11)
where: σ = shear stress (Pa); Ƴ = deformation rate (s-1); K = consistency index (Pa.s)n; n = behavior index; σ
o = initial
shear stress (Pa); ƞ = plastic viscosity (Pa).
Sensory evaluation
For sensory evaluation of smoothies and the stability study, a team of 15 trained panelists and the quantitative descriptive analysis method (QDA) were used. Two samples (stored at 10° and 25 °C in the absence of light) of each kind of smoothie were used, in a total of 6 samples. Five evaluations were conducted in a period of 180 days. The evaluations occurred on the 0th, 49th, 91st, 130th and
180th day of storage. 12-point horizontal structured scales were
used to assess the aroma attributes ranging from strong to weak, color ranging from clear to intense, taste ranging from strange to characteristic, and overall quality ranging from bad to good. Samples were given to the tasters in white plastic glasses at a temperature of 10 °C. The results were analyzed through analysis of variance (p < 0.05) and the Tukey’s test (Bender et al., 1982).
3 Results and discussion
3.1 Samples characterization
Table 1 shows data from analyses composing the physicochemical and thermal characterization of the samples.
Low pH values refer to products composed of citric fruits, also being one safety parameter applicable to food products. The heat treatment industrially applied to these products is pasteurization (100 °C for 30 seconds), using a tubular heat exchanger and hot filling in glass bottles. This treatment together with pH characteristics of the product assures microbiological stability at room temperature, even at a high activity of water.
The values of soluble solids (SST) of the samples correspond to those observed by Nunes (2012), who mentions values from 11 to 15 °Brix for samples of products classified as smoothies, with no sugar.
Experimental data collected by Rahman (2009) and Souza (2008) on thermal properties of juices and fruit pulps have shown to be very similar to the values of Table 1. Considering the soluble solid contents, the specific heat values of Table 1 have reached differences between 5 and 15%.
Figure 1 shows the relationship between density and temperature of the three samples analyzed. Data observed demonstrates a decrease of density reaching the linear behavior as the temperature increases.
Table 2 shows that in comparison with the density prediction model proposed by Peacock (1995) (4), density values of the samples evaluated have relative errors (5) not exceeding 0.5%, at a temperature range from 30 to 90 °C. Such fact can be assumed from the contribution of the soluble solids in this property.
Table 1. Physicochemical and thermophysical characteristics of the smoothies.
Sample GV YF RF
pH 3.45 ± 0.01 3.59 ± 0.02 3.56 ± 0.01 Aw 0.987 ± 0.01 0.986 ± 0.01 0.988 ± 0.02 SST (°Brix) 14.07 ± 0.9 13.54 ± 0.4 13.82 ± 0.6 Cp (kJ/Kg.°C) 3.18 ± 0.11 3.11 ± 0.09 3.09 ± 0.15 α .107(m2/s) 1.30 ± 0.08 1.29 ± 0.11 1.31 ± 0.05
By using STATISTIC 10 program, Table 3 shows suitability of shear stress and shear rate to the Dstwald-de-Waelle model or Power Law (10), as well as the parameters related to this model for the three smoothie samples. The Dstwald-de-Waelle model or Power Law have exhibited a good suitability, with coefficient values (R2) higher than 0.94.
It still can be noted that, in all cases, the (n) values are lower than “1”, demonstrating the fluids have a rheological behavior defined as pseudoplastic non-Newtonian one.
The rheological behavior is the classification of the fluid as per its response to a change in the deformation rate (Moura et al., 2008). The pseudoplastic non-Newtonian fluids tend to reduce the apparent viscosity as the deformation rate increases (Mulvaney et al., 2000).
According to Bennet & Myers (2009), the non-Newtonian fluids can be well represented by theoretical models; the pseudoplastic and dilatant ones are generally well represented by the Power Law (equation X), while the Bingham plastics fluids and general Bingham ones are well represented by Herschel-Bulkley (equation XI).
In all samples analyzed, the temperature increase was reflected in a reduction of the consistency index (K), as well as in an increase in the behavior index (n) (Table 3). The same behavior was observed by Zainal et al. (2000) in an assessment of the temperature effect (65 to 85 °C) in the consistency index and behavior index in guava juice (9 to 11 °Brix). These authors found an exponential decrease in the consistency index and an
Figure 1. Density of smoothie samples versus temperature.
Table 2. Experimental and theoretical values of smoothie’s density, at a temperature range from 30 to 90 °C.
Sample SST (°Brix) ρ experimental (Kg/m3) ρ Equation 4 (Kg/m3) Error (%)
T = 30 °C
GV 14.07 1054.73 1052.85 -0.18
RF 13.82 1050.06 1051.80 0.17
YF 13.54 1048.53 1050.63 0.20
T = 60 °C
GV 14.07 1041.82 1040.57 -0.12
RF 13.82 1037.68 1039.53 0.18
YF 13.54 1036.12 1038.37 0.22
T = 90 °C
GV 14.07 1022.17 1017.77 -0.43
RF 13.82 1019.78 1016.75 -0.30
YF 13.54 1017.99 1015.62 -0.23
Table 3. Adjustment to Power Law model for GV, RF, and YF smoothie samples.
GV K(Pa.s)n n R2
25 °C 8.198 0.5836 0.97
50 °C 4.775 0.7771 0.99
90 °C 1.409 0.9045 0.96
RF K(Pa.s)n n R2
25 °C 7.611 0.6076 0.94
50 °C 4.078 0.7932 0.98
90 °C 1.048 0.9496 0.97
YF K(Pa.s)n n R2
25 °C 7.912 0.5912 0.95
50 °C 3.734 0.7881 0.97
exponential growth of the behavior index as the temperature increases.
The rheological behavior observed complies with what has been reported by Diamante & Umemoto (2015) in their evaluation of rheological properties of fruit and vegetable products. The authors have collected and analyzed data from over 30 recent publications on rheological properties of fruit-based products. The Herschel-Bulkley model and the Power Law were used to describe most part of the behavior of products with a pseudoplastic behavior at n < 1.
The evaluation of apparent viscosity behavior of the samples according to a temperature change is represented in Figure 2. Again, a similar behavior of the samples is observed. The initial apparent viscosity of the samples is quite close to the expected values in the production of milk and pulp drinks, demonstrating the texture similarity between both products. The variation of the viscosity as the temperature increases has shown a non-linear behavior.
Apparent viscosity versus temperature data was also adjusted according to the Arrhenius equation (IX). Activation energy values have fallen within the range of 18.7-20.1 KJ/mol. The higher the activation energy, the higher the temperature effect on viscosity (Pereira et al., 2014; Diamante & Umemoto, 2015). The higher the activation energy, the higher the temperature effect on apparent viscosity (Barbosa-Cánovas et al., 1993; Rao & Rizvi, 1995).
Lower activation energy values as those found in fruit topping (Rao & Rizvi, 1995) are reflected in a lower change in fluid viscosity with temperature increase, resulting in heating processes slightly facilitated and with a reduced impact in organoleptic characteristics of the product.
3.2 Evaluation of sample stability
Anthocyanin and polyphenol contents
For total polyphenol values, gallic acid was used as a standard compound for the elaboration of a standard curve with values from 20 µg/mL to 200 µg/mL, resulting in the equation: (y = 0.005x+0.148 – R2 = 0.989). Table 4 shows the
data compilation of total polyphenol analyzes for the samples, considering the 45-day storage time.
A relative degradation with time higher than with storage temperature is observed, even though the variation in storage condition has increased the total polyphenol degradation.
According to data presented by Faller & Fialho (2009), the mean values of polyphenol contents in fruits are 85.1 (mgEAG /100 g) for pineapple, 110.5 (mgEAG /100 g) for mango, 114.6 (mgEAG /100 g) for orange and 15.3 (mgEAG/100 g) for papaya. Considering the smoothies are composed by mixtures of fruits, they have values of polyphenol similar to pineapple (18% lower) when observed at the initial time point (70 mgEAG /100 g).
When assessed as for the total concentration of phenolic compounds, the three samples had a similar behavior, with a higher degradation of such compounds being found at higher temperatures.
Figure 3 is shown as an example of total polyphenols degradation with time for the YF sample. At 45 days of storage, the sample had a reduction in the polyphenol content from 14 to 28% for samples stored at 10 and 25 °C.
Rodríguez-Verástegui et al. (2016) studied the change in polyphenol content of two vegetable smoothies composed of tomato, red pepper, broccoli and carrot when stored at 5 and 20 °C. The initial polyphenol content was from 40.4 to 46.2 mgEAG/100 g and, after 40 days of storage, the polyphenol content had a reduction from 13-18% at 5 and 20 °C, respectively.
Teixeira et al. (2008) report maximum values of anthocyanins in in natura samples of 21.68 (mg/100 g) for strawberry, 12.67 (mg/100 g) for pomegranate and 14.72 (mg/100 g) for acerola.
Figure 2. Apparent viscosity behavior versus temperature of smoothie samples.
Table 4. Result of smoothies’ total polyphenol contents evaluation in mg EAG/100 g.
Sample Time point 0 45 days (10 °C) 45 days (25 °C) GV 73.45 ± 0.11 61.84 ± 0.08 59.31 ± 0.12
By comparison, initial anthocyanin contents present in the drink are slightly lower (40 to 63%) than those present in in natura fruits. Such issue may be transposed by the fragility of these compounds to exposure at high temperatures; therefore, a thermal processing applied to the product can be liable for the reduction in total anthocyanin values in relation to in natura fruits. The thermal treatment applied to these products was 100 °C/30sec, which has also affected the anthocyanin content.
Figure 4 refers to quantification data of total anthocyanins applied to RF smoothie at a 180-day observation period. Anthocyanin degradation was 56% soon in the first 45 days the samples were exposed to non-refrigerated storage conditions.
Rodríguez-Verástegui et al. (2016) have reported a reduction of 56% in antioxidant activity of vegetable smoothies composed of tomato, red pepper, broccoli and carrot when stored at 20 °C after 40 days.
Refrigerated conditions have provided anthocyanin retention in the same period of time up to 95% superior to that stored at room temperature. When stored at room temperature and protected from light after 180 days, the sample shows an anthocyanin quantity relative to less than 1% of the amount present in the original sample.
In the anthocyanin content stability study of traditional and light blackberry jams stored at 10 and 25 °C (Moura et al., 2012), reductions in anthocyanin content were observed in both kinds of jam, with lower contents found in traditional jam stored at 10 °C (reduction of 36%) and higher ones in light jam stored at 25 °C (reduction of 82.6%).
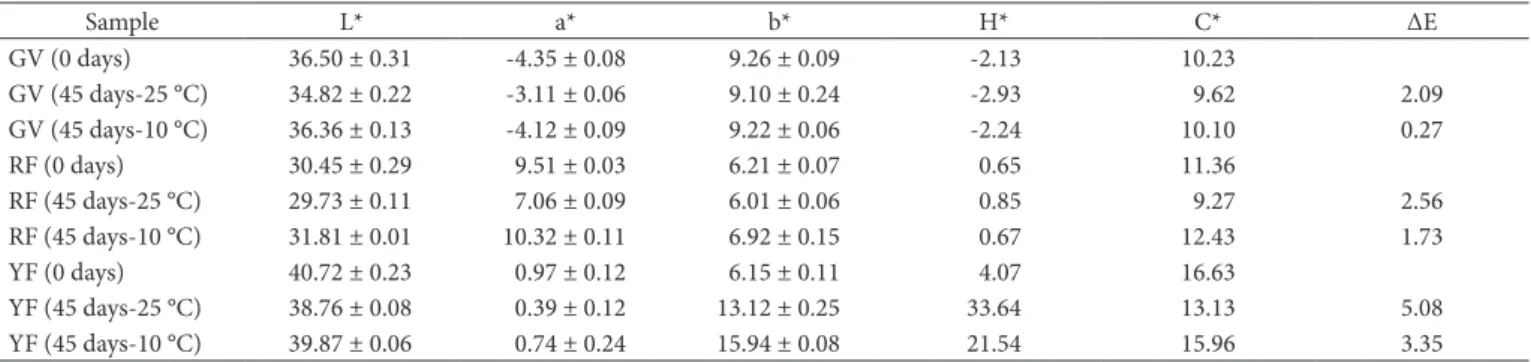
Instrumental color
Table 5 shows the values found in instrumental color measurement of the samples at the time point 0 and having the 45-day storage time.
The instrumental color evaluation has shown there was little change in color parameters (ΔE < 5.1) evaluated after 45 days of storage, and such change was more significant at the highest temperature. It should also be emphasized that the highest color changes, mainly in H* parameter, were found in YF.
Dnce the entire period of instrumental color evaluation has elapsed (180 days), significant differences in color were found in all samples stored at room temperature from the 60th day of
observation, and the first changes among the refrigerated ones were noted on 180 days.
Figure 3. Total polyphenol concentration versus storage time and temperature for the YF sample.
Different physicochemical parameters were evaluated in commercial smoothies having fruits or vegetables (Nunes et al., 2016). The authors have concluded that very little changes in color (L*, chroma and hue) are observed on 21 days of storage at 4°C, in a glass door refrigerator.
The color of the studied samples is inherent to the raw material used in their production. Natural pigments are highly susceptible to degradation and chemical transformation, with elevated reaction kinetics when exposed to light and temperature (Wallace, 2010). The glass bottle used for packaging the smoothies is coated of a plastic film, in an attempt to protect the product from light.
Sensory evaluation
With respect to sensory monitoring of the samples, it was important to highlight the attribute of change in characteristic color noted throughout the observation period, as well as the change in characteristic taste.
Table 6 shows the results of sensory color and characteristic taste of smoothie samples stored at both temperatures, in
which higher values refer to a darkening of the samples and the occurrence of strange or non-characteristic tastes of the drink.
It was observed the samples kept at a temperature of 25°C start to show significant differences (p > 0.05) in color from 91 days of observation, while those stored under refrigeration do not show such differences in the observation window studied (130 days).
Taste deterioration and the occurrence of a strange taste could be substantially observed from 49 days, being extremely pronounced in RF samples. All samples stored at 25°C were rejected in the 180-day observation time point, precluding the conduction of sensory analyses at such time.
4 Conclusions
The results of physicochemical and thermophysical properties have shown good similarity to pulp and juice data found in the literature, since the solids contents are very similar.
The samples analyzed were classified as pseudoplastic as per the Power Law model and making an appropriate adjustment to the Arrhenius equation.
Table 5. Result of instrumental color evaluation of smoothies in time zero and time 45 days.
Sample L* a* b* H* C* ΔE
GV (0 days) 36.50 ± 0.31 -4.35 ± 0.08 9.26 ± 0.09 -2.13 10.23
GV (45 days-25 °C) 34.82 ± 0.22 -3.11 ± 0.06 9.10 ± 0.24 -2.93 9.62 2.09
GV (45 days-10 °C) 36.36 ± 0.13 -4.12 ± 0.09 9.22 ± 0.06 -2.24 10.10 0.27
RF (0 days) 30.45 ± 0.29 9.51 ± 0.03 6.21 ± 0.07 0.65 11.36
RF (45 days-25 °C) 29.73 ± 0.11 7.06 ± 0.09 6.01 ± 0.06 0.85 9.27 2.56
RF (45 days-10 °C) 31.81 ± 0.01 10.32 ± 0.11 6.92 ± 0.15 0.67 12.43 1.73
YF (0 days) 40.72 ± 0.23 0.97 ± 0.12 6.15 ± 0.11 4.07 16.63
YF (45 days-25 °C) 38.76 ± 0.08 0.39 ± 0.12 13.12 ± 0.25 33.64 13.13 5.08
YF (45 days-10 °C) 39.87 ± 0.06 0.74 ± 0.24 15.94 ± 0.08 21.54 15.96 3.35
Table 6. Sensory results of color atribute and characteristic taste of smoothies and statistical analysis of variance and Tukey’s means.
Color
Sample 0 days 49 days 91 days 130 days 180 days
RF 10 °C 7.6 ± 2.4 Aa 8.0 ± 1.5 Aa 7.4 ± 1.9 Aa 7.7 ± 2.6 Aa 7.7 ± 2.7 A
RF 25 °C 7.6 ± 2.4 Aa 8.0 ± 1.9 Aa 9.6 ± 1.2 Bb 10.8 ± 1.7 Cc
-YF 10 °C 7.4 ± 1.7 Aa 6.9 ± 1.3 Aa 7.4 ± 1.4 Aa 7.1 ± 2.1 Aa 7.2 ± 2.2 A
YF 25 °C 7.4 ± 1.7 Aa 7.1 ± 2.1 Aa 8.2 ± 2.3 Bb 8.8 ± 2.1 Bb
-GV 10 °C 7.1 ± 1.6 Aa 7.2 ± 1.2 Aa 6.8 ± 1.5 Aa 6.9 ± 1.5 Aa 7.0 ± 1.6 A
GV 25 °C 7.1 ± 1.6 Aa 6.8 ± 2.2 Aa 7.8 ± 2.9 Bb 7.9 ± 2.4 Bb
-Taste
Sample 0 days 49 days 91 days 130 days 180 days
RF 10 °C 8.4 ± 2.5 Aa 8.1 ± 1.9 Aa 7.9 ± 1.9 Aa 7.4 ± 2.6 Ba 7.5 ± 2.7 B
RF 25 °C 8.4 ± 2.5 Aa 9.3 ± 2.5 Bb 5.8 ± 2.6 Cc 4.6 ± 2.3 Dd
-YF 10 °C 7.7 ± 2.9 Aa 7.6 ± 2.4 Aa 7.1 ± 2.3 Aa 7.1 ± 1.2 Aa 7.2 ± 1.3 A
YF 25 °C 7.7 ± 2.9 Aa 7.9 ± 2.2 Aa 6.7 ± 2.7 Ba 6.9 ± 2.5 Ba
-GV 10 °C 6.6 ± 3.9 Aa 6.8 ± 2.4 Aa 7.0 ± 1.2 Aa 7.0 ± 3.3 Aa 6.9 ± 3.2 A
GV 25 °C 6.6 ± 3.9 Aa 7.7 ± 2.6 Bb 6.4 ± 1.6 Aa 5.6 ± 2.7 Cc
Moura, S. C. S. R., Tavares, P. E. R., Germer, S. P. M., Nisida, A. L. A. C., Alves, A. B., & Kanaan, A. S. (2012). Degradation kinetics of anthocyanin of traditional and low-sugar blackberry jam. Food
Bioprocess Technology, 5(6), 2488-2496. http://dx.doi.org/10.1007/
s11947-011-0578-7.
Moura, S. C. S. R., Vissotto, F. Z., Almeida, M. E. M., & Fefim, D. A. (2008). Comportamento reológico de soluções modelo de geleias e doces em massa light.Brazilian Journal of Biosystems Engineering, 2(2), 165-174.
Mulvaney, S. J., Rizvi, S. S. H., & Sharma, S. K. (2000). Food process
engineering (pp. 20-186). New York: John Wiley & Sons.
Nunes, M. A., Costa, A. S. G., Barreira, J. C. N., Vinha, A. F., Alves, R. C., Rocha, A., & Dliveira, M. B. P. P. (2016). How functional foods endure throughout the shelf storage? Effects of packing materials and formulation on the quality parameters and bioactivity of smoothies. LWT - Food Science and Technology, 65, 70-78. http:// dx.doi.org/10.1016/j.lwt.2015.07.061.
Dms-Dliu, G., Ddriozola-Serrano, I., Soliva-Fortuny, R., Elez-Martínez, P., & Martín-Belloso, D. (2012). Stability of health-related compounds in plant foods through the application of non thermal processes.
Trends in Food Science & Technology, 23(2), 111-123. http://dx.doi.
org/10.1016/j.tifs.2011.10.004.
Peacock, S. (1995). Predicting physical properties of factory juices and syrups. International Sugar Journal, 97(1162), 571-577.
Pereira, C. G., Resende, J. V., & Giarola, T. M. D. (2014). Relationship between the thermal conductivity and rheological behavior of acerola pulp: effect of concentration and temperature. LWT - Food
Science and Technology, 58(2), 446-453. http://dx.doi.org/10.1016/j.
lwt.2014.04.016. </jrn>.
Rahman, S. (2009). Food properties handbook (2nd ed., pp. 861). Boca Raton: CRC Press. http://dx.doi.org/10.1201/9781420003093. Rao, M. A., & Rizvi, A. A. H. (1995). Engineering properties of foods
(2nd ed., pp. 531). New York: Academic Press.
Rodríguez-Verástegui, L. L., Martínez-Hernández, G. B., Castillejo, N., Gómez, P. A., Artés, F., & Artés-Hernández, F. (2016). Bioactive compounds and enzymatic activity of red vegetable smoothies during storage. Food Bioprocess Technology, 9(1), 137-146. http:// dx.doi.org/10.1007/s11947-015-1609-6.
São Paulo, Governo do Estado. (2010). Brasil Food Trends 2020 (173 p.). São Paulo: FIESP/ITAL.
Singh, R. P. (2014). Scientific principles of shelf life evaluation. In C. M. D. Man & A. A. Jones (Eds.), Shelf life evaluation of foods (1st ed., pp. 3-24). London.
Souza, D. (2008). Estudo das propriedades físicas de polpas e néctares
de pequenos frutos (Master’s thesis). Universidade Federal do Rio
Grande do Sul, Porto Alegre.
Teixeira, L. N., Stringheta, P. C., & Dliveira, F. A. (2008). Comparação de métodos para quantificação de antocianinas. Ceres, 55(4), 297-304. Wallace, T. C. (2010). Analysis of procyanidins and anthocyanins in food
products using chromatographic and spectroscopic techniques (Master’s
thesis). Graduate Program in Food Science and Technology, The Dhio State University, Dhio.
Williams, S. (1990). Official methods of analysis of the Association of
Official Analytical Chemists (14th ed., pp. 1141). Arlington: ADAC.
Zainal, B. S., Rahmana, R. A., Ariffa, A. B., Saaria, B. N., & Asbib, B. A. (2000). Effects of temperature on the physical properties of pink guava juice at two different concentrations. Journal of Food Engineering, 43(1), 55-59. http://dx.doi.org/10.1016/S0260-8774(99)00132-6.
During the period observed, a small instrumental change in color of the samples and a significant reduction of total polyphenol and anthocyanin contents were noted.
The temperature had a great influence on stability and degradation kinetics of bioactive compounds, and had an impact in sensory characteristic changes of the products.
Acknowledgements
The authors thank CNPq Institution for granting a fellowship in Scientific Initiation Program.
References
Amr, A., & Al-Tamimi, E. (2007). Stability of the crude extracts of
Ranunnculus asiaticus anthocyanins and their use as food colorants.
International Journal of Food Science & Technology, 42(8), 985-991.
http://dx.doi.org/10.1111/j.1365-2621.2006.01334.x.
Association of Dfficial Analytical Chemists – ADAC. (2006). Official
methods of analysis (20th ed.). Arlington: ADAC.
Barbosa-Cánovas, G. V., Ibarz, A., & Peleg, M. (1993). Propiedades reológicas de alimentos fluidos. Alimentaria, 4, 39-59.
Bender, F. E., Douglas, L. W., & Kramer, A. (1982). Factorial experiments. In F. E. Bender, L. W. Douglas & A. Kramer. Statistical methods for
food agriculture (chap. 9, 345 p.) Westport: Avi Publishing Company.
Bennet, C. D., & Myers, J. E. (2009). Fenômenos de transporte, quantidade de calor e massa. In Z. Berk. Food process engineering and technology
(603 p.) Amsterdam: Academic Press.
Delgado-Vargas, F., & Paredes-López, D. (2002). Natural colorants for
food and nutraceutical uses (328 p.). Coimbra: CRC Press. http://
dx.doi.org/10.1201/9781420031713.
Diamante, L., & Umemoto, M. (2015). Rheological properties of fruits and vegetables: a review. International Journal of Food Properties, 18(6), 1191-1210. http://dx.doi.org/10.1080/10942912.2014.898653. Faller, A. L. K., & Fialho, E. (2009). Polyphenol availability in fruits and vegetables consumed in Brazil. Revista de Saúde Pública, 43(2), 211-218. PMid:19225692. http://dx.doi.org/10.1590/S0034-89102009005000010.
Instituto Adolfo Lutz – IAL. (1985). Normas analíticas do Instituto Adolfo Lutz: métodos químicos e físicos para análises de alimentos
(Vol. 1, 3rd ed., 195 p.). São Paulo: IAL.
Keenan, D. F., Brunton, N. P., Gormley, T. R., Butler, F., Tiwari, B. K., & Patras, A. (2012). Effect of thermal and high hydrostatic pressure processing on antioxidant activity and colour of fruit smoothies.
Innovative Food Science & Emerging Technologies, 11(4), 551-556.
http://dx.doi.org/10.1016/j.ifset.2010.07.003.
Kiralp, S., & Toppare, L. (2006). Polyphenol content in selected turkish wines, an alternative method of detection of phenolics.
Process Biochemistry, 41(1), 236-239. http://dx.doi.org/10.1016/j.
procbio.2005.06.011.
Nunes, M. A. M. (2012). Determinação da capacidade antioxidante e parâmetros físico-químicos em smoothies: estabilidade ao longo do
tempo de armazenamento (Master’s thesis). Faculdade de Ciências,
Universidade do Porto, Porto.
Moura, S. C. S. R., & Germer, S. P. M. (2010). Reações de transformação
e vida-de-prateleira de alimentos processados (Manual Técnico, Vol.