Rev. Caatinga
COWPEA GROWTH AND YIELD IN SOLE CROP AND INTERCROPPED WITH
MILLET
1LEANDRO BARBOSA DE OLIVEIRA2, RODRIGO LUIZ NEVES BARROS2, WELLITON BARROS DE MAGALHÃES2*, LEONARDO OLIVEIRA MEDICI2, CARLOS PIMENTEL2
ABSTRACT -The objective of this work was to evaluate the growth and yield of cowpea grains in different intercropping systems with millet, in wet and dry seasons. The experiments were performed in the experimental field of the Department of Plant Science of the Federal Rural University of Rio de Janeiro, Brazil, using a randomized block design with three replications and five treatments: T1- sole crop of millet; T2- sole crop of
cowpea; T3- intercrop of millet (1 row) and cowpea (1 row) with 0.5 m between rows (1Mx1C-0.50); T4 - intercrop of millet (1 row) and cowpea (1 row) with 0.75 m between rows (1Mx1C-0.75); and T5 - intercrop of millet (1 row) and cowpea (2 rows) with 0.5 m between rows (1Mx2C-0.50). The cowpea
shoot dry weight, root dry weight, number and dry weight of nodules, grain yield and 1000-grain weight, and the millet fresh weight, shoot dry weight, grain yield and 1000-grain weight were evaluated. The land-use efficiency index (LUE) showed significant differences in yield between the sole crop of cowpea and the intercropping system, with greater grain weight in the intercrop 1Mx2C-0.50. On the other hand, the intercrop
1Mx1C-0.75 was not recommended for the study conditions.
Keywords: Vigna unguiculata (L.) Walp. Penisetum glaucum (L.) R. Brown. Yield. Land-use efficiency index.
CRESCIMENTO E PRODUTIVIDADE DE GRÃOS DO FEIJÃO-CAUPI NOS CULTIVOS
SOLTEIRO E CONSORCIADO COM MILHETO
RESUMO - O objetivo do trabalho foi avaliar o crescimento e a produtividade de grãos do feijão-caupi nos
diferentes sistemas de consórcio com o milheto, na época das águas e da seca. Os experimentos foram conduzidos no campo experimental do Departamento de Fitotecnia, da Universidade Federal Rural do Rio de
Janeiro, em delineamento em blocos ao acaso, com três repetições e cinco tratamentos: T1- cultura solteira de milheto; T2- cultura solteira de feijão-caupi; T3- consórcio com uma linha de milheto e uma de feijão-caupi espaçadas de 0,5m (1M x 1C-0,50); T4- consórcio com uma linha de milheto e uma de feijão-caupi espaçadas de 0,75m (1M x 1C-0,75); e T5- consórcio com uma linha de milheto e duas de feijão-caupi espaçadas de 0,5m (1M x 2C-0,50). No feijão-caupi, avaliou-se a massa seca da parte aérea, massa seca de raiz, o número e massa
seca de nódulos, a produtividade de grãos e a massa de 1000 grãos; enquanto no milheto, avaliou-se a massa verde, a massa seca da parte aérea, a produtividade de grãos e a massa de 1000 grãos. Pela comparação do índice de equivalência de área (IEA), se verificou diferenças significativas na produção de feijão-caupi por área explorada, no sistema consorciado em relação ao cultivo solteiro, com a maior massa de grãos no consórcio 1M x 2C-0,50, em relação aos outros. Por outro lado, o consórcio 1M x 1C-0,75 não é recomendável para o local.
Palavras-chave: Vigna unguiculata L.. Penisetum glaucum (L.) R. Brown. Produção. Índice de equivalência de
área.
____________________ *Corresponding author
1Received for publication in 03/11/2015; accepted in 04/04/2016.
Paper extracted from the doctoral thesis of the first author, supported by the Capes.
INTRODUCTION
Cowpea (Vigna unguiculata (L.) Walp.) is known in the Brazilian Northeast as Makassar's beans or string beans. Cowpea crops have great economical and nutritional importance for the agricultural development in this region. It is a staple food in the diet of the poorest populations, with a nutritional function by the supplying their nutrient needs (TORRES et al., 2008). This crop can be
grown in low fertility soils, adapt to high temperatures and drought conditions, and associate
with bacteria of the genus Bradyrhizobium, generating biological N fixation by symbiosis
(ASIWE, 2009).
The intercropping of cowpea and millet (Penisetum glaucum (L.) R. Brown) is a common crop system for small farmers in Africa (SPRENT et al., 2010), which diversify their crops and reduce the risk of losses (AMBROSI et al., 2001). The millet is an adequate crop for the Northeast, as a secondary
crop to the cowpea, since it is one of the most tolerant plants to drought and is grown in semiarid
regions, such as Africa (Sahel), where its grains are used as food and straw for animal feed (PAYNE, 2000). In Brazil, millet has been used as mulch for the no-tillage system, and for soil coverage and grain production for animal feed (COSTA et al., 2005).
The short space between plants benefits the production, since it increases the soil plant coverage, reduces competition with weeds and soil surface evaporation, allowing the crop to save water and have greater growth and yield (PAYNE, 2000). The increase in production per area is one of the most important reasons to adopt intercropping systems, thus, the land-use efficiency index (LUE) is used to evaluate the efficiency of these systems compared with sole crops (VIEIRA, 1989). This index is defined as the relative land area needed in a
sole crop to obtain the same yield than in the intercropping system (FLESCH, 2002). Therefore,
the intercrop of two crops is considered efficient when the LUE is higher than 1.0, and detrimental to the production when lower than 1.0; thus, any value greater than 1.0 indicates an advantageous yield for the intercropping system, a result called overyield (VIEIRA, 1989).
Cowpea intercropped with millet emerges as an alternative to a more viable and competitive agriculture, with less risk of losses, especially for farmers with low income and small crop areas (PIMENTEL, 2006), particularly in the Brazilian Northeast. The objective of this work was to evaluate the growth and yield of cowpea grains in different intercropping systems with millet, in wet and dry seasons, and found the best system for the edaphoclimatic conditions of Seropédica, State of Rio de Janeiro, Brazil.
MATERIAL AND METHODS
Two experiments were performed in the experimental field of the Department of Plant Science of the Federal Rural University of Rio de Janeiro, Brazil (22o45'S, 43o41'W and 40 m of
altitude). The climate of the region is Aw, according to the Koppen classification.
The first experiment was conducted in August 2009, in the wet season, in a Planosol (EMBRAPA, 2013), whose chemical analysis showed water pH of 5.3, 1.5 cmolc.dm-3 of Ca, 0.5 cmol.dm-3 of Mg,
3.5 cmolc dm-3 of H+Al, 0.5% of Al; 4.0 mg L-1 of P,
6.0 mg L-1 of K, 0.9% of organic matter and 37% of
base saturation. The period of the first experiment had total precipitation of 586 mm, total evaporation of 354 mm, maximum average temperature of 31°C and minimum of 21°C.
The second experiment was conducted in March 2010, in the dry season, in a Planosol (EMBRAPA, 2013), whose chemical analysis
showed water pH of 5.7, 2.6 cmolc.dm-3 of Ca,
1.5 cmolc.dm-3 of Mg, 1.3 cmolc.dm-3 of H+Al, 0.0%
of Al, 36.0 mg L-1 of P, 8.0 mg L-1 of K, 1.2% of
organic matter and 68% of base saturation. The period of the second experiment had total precipitation of 246 mm, total evaporation of 262 mm, maximum average temperature of 28°C and
minimum of 19°C.
The treatments were arranged in a randomized block design, with three replications,
consisting of five treatments of cowpea (cultivar EPACE 10) and millet (cultivar ENA 1): T1- sole crop of millet, with 0.50 m between millet rows (1M); T2- sole crop of cowpea, with 0.50 m between cowpea rows (1C); T3- intercrop of millet (1 row) and cowpea (1 row) with 0.5 m between rows (1Mx1C-0.50); T4- intercrop of millet (1 row) and cowpea (1 row) with 0.75 m between rows (1Mx1C-0.75); and T5- intercrop of millet (1 row) and cowpea (2 rows) with 0.5 m between rows (1Mx2C-0.50). Each plot had three meters in length,
and width ranging according to the intercrop treatment, i.e., the plots of sole crops had 9 m2,
intercrop 1Mx1C-0.5 had 15 m2, and intercrops 1Mx2C-0.5 and 1Mx1C-0.75 had 22.5 m2.
Rev. Caatinga
recommendations for the crop (MELO et al., 2005).
The cowpea seeds were inoculated with a Bradyrhizobium-based inoculant (SEMIA 6462, with
1 x 10⁹ viable cells per gram of inoculant), produced
by Embrapa Agrobiology, and dried under shade after inoculation. The experiments were conducted in the wet and dry season without irrigation and weeds were hand-hoed during the crop development.
Three plants per plot of both sole and intercropped cowpea treatments, at the pre-flowering (R5) and pod filling (R8) stages (LEITE; FILHO, 2009) were harvested in rows next to the border of each plot. These samples were used to evaluate the shoot and root dry weight and number and dry weight of nodules. The grain yield and 1000-grain weight were evaluated in each plot on plants collected in the two central rows of 3 m, discarding two plants at the end of each row.
Four plants per plot of both sole and intercropped millet treatments were collected in the central rows of each plot at the flowering stage to evaluate the fresh and dry weight, and at the end of the cycle to evaluate the grain yield and 1000-grain weight. The millet development stages were assessed according to Costa et al. (2005). The samples were fresh weighed, dried in a forced-air circulation oven at 60°C for 48 hours and weighed to assess the dry weight. The land-use efficiency index (LUE) was calculated for both crops, since both crops produce grains, using the formula recommended by Vieira (1989):
Equation 1: Land-use efficiency index (LUE)
LUE= Ci Cs+
Mi Ms
where Cc is the intercropped cowpea grain yield, Cs is the cowpea sole crop grain yield, Mi is the intercropped millet grain yield, Ms is the millet sole crop grain yield, with values expressed in kg ha-1, considering the LUE>1 as efficient and
IEA<1 as inefficient. The data were subjected to analysis of variance and, when significant, the means were compared by the Tukey test at 5% probability, using the statistical software Sisvar (FERREIRA, 2011).
RESULTS AND DISCUSSION
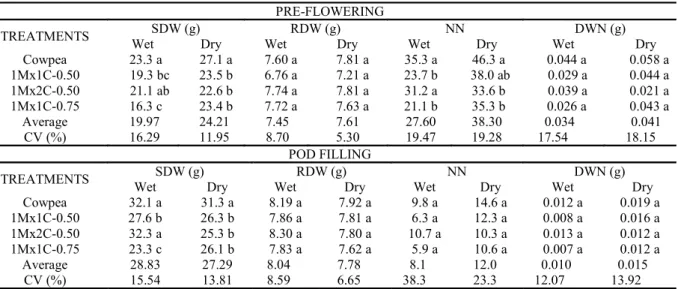
The two evaluations of cowpea in the wet season, at pre-flowering (R5) and pod filling (R8) stages showed significant differences in shoot dry weight (SDW) per plant in the sole crop comparing with the intercrops 1Mx1C-0.50 and 1Mx1C-0.75, however, it was similar to the intercrop 1Mx2C-0.50, which was similar to the 1Mx1C-0.50 in the R5 stage (Table 1).
The sole crop of cowpea in the dry season, at pre-flowering and pod filling, had greater SDW compared with the other intercropping systems, which were similar to each other. The root dry weight (RDW) showed no significant differences in the treatments of both crop seasons (Table 1), indicating no correlation of this variable with the SDW in this experiment, confirming the results of Valadão et al. (2009), who found similar results in common beans.
Table 1. Cowpea shoot dry weight (SDW) and root dry weight (RDW) per plant, number of nodules (NN) and dry weight of nodules (DWN) per plant, at pre-flowering (R5) and pod filling (R8) stages, in wet and dry seasons, in sole crop and
intercropped with millet.
1Mx1C-0.50: millet (1 row) and cowpea (1 row); 1Mx2C-0.50: millet (1 row) and cowpea (2 rows); and 1Mx1C-0.75:
millet (1 row) and cowpea (1 row); means followed by the same letter in the same column do not differ by the Tukey test at 5% probability.
PRE-FLOWERING
TREATMENTS SDW (g) RDW (g) NN DWN (g)
Wet Dry Wet Dry Wet Dry Wet Dry
Cowpea 23.3 a 27.1 a 7.60 a 7.81 a 35.3 a 46.3 a 0.044 a 0.058 a 1Mx1C-0.50 19.3 bc 23.5 b 6.76 a 7.21 a 23.7 b 38.0 ab 0.029 a 0.044 a 1Mx2C-0.50 21.1 ab 22.6 b 7.74 a 7.81 a 31.2 a 33.6 b 0.039 a 0.021 a 1Mx1C-0.75 16.3 c 23.4 b 7.72 a 7.63 a 21.1 b 35.3 b 0.026 a 0.043 a
Average 19.97 24.21 7.45 7.61 27.60 38.30 0.034 0.041
CV (%) 16.29 11.95 8.70 5.30 19.47 19.28 17.54 18.15
POD FILLING
TREATMENTS SDW (g) RDW (g) NN DWN (g)
Wet Dry Wet Dry Wet Dry Wet Dry
Cowpea 32.1 a 31.3 a 8.19 a 7.92 a 9.8 a 14.6 a 0.012 a 0.019 a
1Mx1C-0.50 27.6 b 26.3 b 7.86 a 7.81 a 6.3 a 12.3 a 0.008 a 0.016 a
1Mx2C-0.50 32.3 a 25.3 b 8.30 a 7.80 a 10.7 a 10.3 a 0.013 a 0.012 a
1Mx1C-0.75 23.3 c 26.1 b 7.83 a 7.62 a 5.9 a 10.6 a 0.007 a 0.012 a
Average 28.83 27.29 8.04 7.78 8.1 12.0 0.010 0.015
The number of nodules (NN) showed
statistical differences in the treatments at the pre-flowering stage, in both crop seasons, however,
the dry weight of nodules (DWN) showed no significant differences, with similar values in all treatments, in both stages and seasons (Table 1). The greater NN were found in the wet season, at the pre-flowering stage, in the sole crop system and in the intercrop 1Mx2C-0.50, which also had the greater SDW, significantly differing from the others intercrops. The sole crop in the dry season, at the pre-flowering stage, had NN greater than the intercrops 1Mx2C-0.50 and 1Mx1C-0.75 and similar to the intercrop 1Mx1C-0.50. The NN of the intercrops were similar.
The sole crop and the intercrop 1Mx2C-0.50 in the wet season, at the pre-flowering stage, had SDW and NN greater than the other intercrops; and the sole crop in the dry season in the pre-flowering stage, had SDW and NN greater than the other treatments. This result shows a positive correlation between SDW and NN in the pre-flowering stage
(Table 1). The greater SDW and NN at the pre-flowering stage is probably related to the greater
leaf area, which produce more photo-assimilates, which are essential for the flower pollination stage and maximum nodulation (PIMENTEL, 2006; RUMJANEK, 2005).
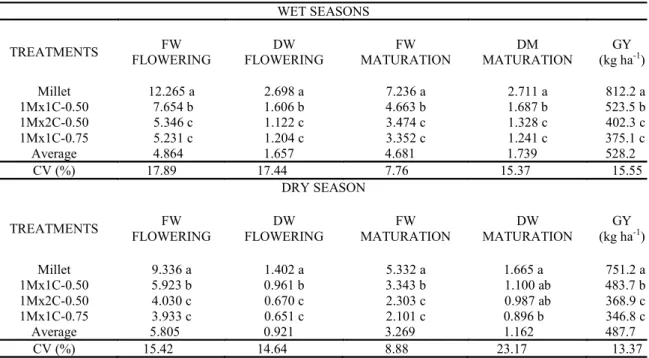
The millet fresh shoot weight (FW) and dry shoot weight (DW) differed significantly in the flowering and maturation stages, in both crop seasons (Table 2). The FW and DW were greater in the sole crop compared with the intercropping systems in both stages in the wet season and at flowering in the dry season. The sole crop had greater FW at the maturation stage in the dry season comparing with the intercropping systems, similar DW to the intercrops 1Mx1C-0.50 and 1Mx2C-0.50 and greater DW comparing with the 1Mx1C-0.75.
The FW was greater at the flowering stage, with a small decrease at grain maturation, i.e., the millet weight increases until flowering, as shown by Geraldo et al. (2002). Despite the FW at the maturation stage has a decreased weight, the harvest at this stage can be an advantage for the farmer, since the FW will still have satisfactory protein contents for animal feed, and will also have the grain production, as shown by Geraldo et al. (2003). The sole crop of millet had the greatest grain yield (GY)
in both seasons, followed by the intercrop 1Mx1C-0.50; and the intercrops 1Mx2C-0.50 and
1Mx1C-0.75 had the lowest GY (Table 3). According Kaushik and Gautam (1994), this result is due to the difference in plant population density, with denser plants populations presenting the greatest yields.
Table 2. Fresh weight (FW) and dry weight (DM), at flowering and maturation stages, and grain yield (GY) of millet in sole crop and intercropped with cowpea, in wet and dry seasons.
1Mx1C-0.50: millet (1 row) and cowpea (1 row); 1Mx2C-0.50: millet (1 row) and cowpea (2 rows); and
1Mx1C-0.75: millet (1 row) and cowpea (1 row); means followed by the same letter in the same column do not differ
by the Tukey test at 5% probability.
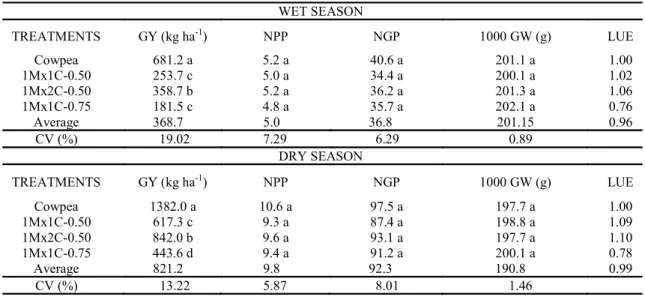
The cowpea grain yield (GY) showed significant differences in the treatments in both seasons (Table 3). The GY of the sole crop was
both seasons. The intercrops 1Mx1C-0.50 and 1Mx1C-0.75 had similar GY in the wet season, but lower than the GY of the 1Mx2C-0.50. The GY of
WET SEASONS
TREATMENTS FW
FLOWERING
DW FLOWERING
FW MATURATION
DM MATURATION
GY (kg ha-1)
Millet 12.265 a 2.698 a 7.236 a 2.711 a 812.2 a
1Mx1C-0.50 7.654 b 1.606 b 4.663 b 1.687 b 523.5 b
1Mx2C-0.50 5.346 c 1.122 c 3.474 c 1.328 c 402.3 c
1Mx1C-0.75 5.231 c 1.204 c 3.352 c 1.241 c 375.1 c
Average 4.864 1.657 4.681 1.739 528.2
CV (%) 17.89 17.44 7.76 15.37 15.55
DRY SEASON
TREATMENTS FW
FLOWERING
DW FLOWERING
FW MATURATION
DW MATURATION
GY (kg ha-1)
Millet 9.336 a 1.402 a 5.332 a 1.665 a 751.2 a
1Mx1C-0.50 5.923 b 0.961 b 3.343 b 1.100 ab 483.7 b
1Mx2C-0.50 4.030 c 0.670 c 2.303 c 0.987 ab 368.9 c
1Mx1C-0.75 3.933 c 0.651 c 2.101 c 0.896 b 346.8 c
Average 5.805 0.921 3.269 1.162 487.7
Rev. Caatinga
greater than the GY of the 1Mx1C-0.50, which was greater than the GY of the 1Mx1C-0.75. The GY of cowpea in the dry season was greater than that found by Santos et al. (2009) (1,200 kg ha-1) in an irrigated
and fertilized crop with the same cultivar. However, the GY found in the wet season was lower than in the dry season (Table 3), due to attacks of Rhizoctonia solani and abiotic stresses caused by long periods of drought followed by high
precipitations, with high temperatures. The precipitation in the first 30 days after planting (DAP) was 127 mm, with 173 mm at 30 to 60 DAP, 74 mm at 60 to 90 DAP and 219 mm at 90 to 120 DAP (193 mm at 10 days before harvest). According to Nechet and Halfeld-Vieira (2007), these combinations of environmental factors favor the Rhizoctonia solani development, causing grain yield losses of up to 50% (POLTRONIERI; TRINDADE; SILVA, 1994).
Table 3. Grain yield (GY), number of pods per plant (NPP), number of grains per plant (NGP), 1000-grain weight
(1000 GW) and land-use efficiency index (LUE) of cowpea in sole crop and intercropped with millet, in wet and dry
seasons.
1Mx1C-0.50: millet (1 row) and cowpea (1 row); 1Mx2C-0.50: millet (1 row) and cowpea (2 rows); and
1Mx1C-0.75: millet (1 row) and cowpea (1 row); means followed by the same letter in the same column do not
differ by the Tukey test at 5% probability.
The greater GY of cowpea in sole crop is due, mainly, to the greater number of plants per area compared with the intercrops, since the other production components evaluated (NPP, NGP and 1000-grain weight) were similar in the treatments, confirming the results found by Mohammed et al. (2008). The GY of sole crop was statistically different than the GY of the intercrops, however, the
LUE were higher than 1.0 in the intercrops 1Mx1C-0.50 and 1Mx2C-0.50, showing a positive
interaction of cowpea with millet in these intercrops and at these experimental conditions (VIEIRA, 1989). The sole crop is more productive individually, however, intercrops in which both crops have LUE value higher than 1.0 is a more advantageous option. These intercrops also allow a better land use by small farmers and, in case of loss in a crop, they will have the production of the other crop (VIEIRA, 1989).
According to the results of the present study, the intercrop 1Mx2C-0.50 is recommended for the study conditions, since it had the second greatest GY (after the sole crop) and LUE higher than 1.0, and the intercrop 1Mx1C-0.75 was not feasible,
presenting LUE lower than 1.0. Mohammed et al. (2008) evaluated cowpea intercropped with millet in Nigeria, and found higher LUE in the intercrop 1Mx2C comparing with 1Mx1C, thus, similar to the results found here. Therefore, these results indicate that, in the experimental conditions evaluated, the intercrop of cowpea with millet with low space between millet and cowpea rows, such as in the 1Mx2C-0.50, is beneficial for improve land use and agricultural diversification, with good yields of cowpea and millet.
CONCLUSIONS
The land-use efficiency index (LUE) indicated advantages in cowpea yield for the intercropping system compared with sole crop, with the intercrop 1Mx2C-0.50 (1.50 m between millet rows and 0.50 m between the two cowpea rows) presenting greater yield than the other intercrops. The intercrop 1Mx1C-0.75 was not recommended for the evaluated conditions, since it presented the lowest cowpea yield and LUE lower than 1.0.
WET SEASON
TREATMENTS GY (kg ha-1) NPP NGP 1000 GW (g) LUE
Cowpea 681.2 a 5.2 a 40.6 a 201.1 a 1.00
1Mx1C-0.50 253.7 c 5.0 a 34.4 a 200.1 a 1.02
1Mx2C-0.50 358.7 b 5.2 a 36.2 a 201.3 a 1.06
1Mx1C-0.75 181.5 c 4.8 a 35.7 a 202.1 a 0.76
Average 368.7 5.0 36.8 201.15 0.96
CV (%) 19.02 7.29 6.29 0.89
DRY SEASON
TREATMENTS GY (kg ha-1) NPP NGP 1000 GW (g) LUE
Cowpea 1382.0 a 10.6 a 97.5 a 197.7 a 1.00
1Mx1C-0.50 617.3 c 9.3 a 87.4 a 198.8 a 1.09
1Mx2C-0.50 842.0 b 9.6 a 93.1 a 197.7 a 1.10
1Mx1C-0.75 443.6 d 9.4 a 91.2 a 200.1 a 0.78
Average 821.2 9.8 92.3 190.8 0.99
REFERENCES
AMBROSI, I. et al. Lucratividade e risco de sistemas de produção de grãos combinados com pastagens de inverno. Pesquisa Agropecuária Brasileira, Brasília, v. 36, n. 10, p. 1213-1219, 2001.
ASIWE, J. A. N. Insect mediated outcrossing and gene flow in cowpea (Vigna unguiculata L. Walp): Implication for seed production and provision of containment structures for genetically transformed cowpea. African Journal of Biotechnology, Nairobi, v. 8, n. 2, p. 226-230, 2009.
COSTA, A. C. T. et al. Unidades térmicas e produtividade de genótipos de milheto semeados em duas épocas. Pesquisa Agropecuária Brasileira, Brasília, v. 40, n. 12, p. 1171-1177, 2005.
EMBRAPA. Centro Nacional de Pesquisa de Solos. Sistema brasileiro de classificação de solos. 3. ed. Brasília, DF: 2013. 353 p.
FERREIRA, D. F. Sisvar: A computer statistical analysis system. Ciência e Agrotecnologia, Lavras, v. 35, n. 6, p. 1039-1042, 2011.
FLESCH, R. D. Efeitos temporais e espaciais no consórcio intercalar de milho e feijão. Pesquisa Agropecuária Brasileira, Brasília, v. 37, n. 1, p. 51-56, 2002.
GERALDO, J. et al. Fenologia e produção de massa seca e de grãos em cultivares de milheto-pérola. Pesquisa Agropecuária Brasileira, Brasília, v. 37, n. 9, p. 1263-1268, 2002.
GERALDO, J. et al. Herdabilidade e correlações genéticas do teor e da aquisição de nitrogênio em milheto pérola. Revista Universidade Rural, Série Ciências da Vida, Seropédica, v. 22, n. 2, p. 61-70,
2003.
KAUSHIK, S. K.; GAUTAM, R. C. Response of rainfed pearl millet (Pennisetum glaucum) to water harvesting. Moisture conservation and plant population in light soils. Indian Journal of Agricultural Sciences, New Delli, v. 64, n. 12, p. 858-860, 1994.
LEITE, M. A.; FILHO, J. S. V. Produção de matéria seca em plantas de caupi (Vigna unguiculata (l.) Walp) submetidas a déficits hídricos. Ciências Exatas e Terra, Ciências Agrária e Engenharias, Ponta Grossa, v. 10, n. 1, p. 43-51, 2004.
MELO, F. B. et al. Fertilidade do solo e adubação. In: FREIRE FILHO, F. R. et al. (Eds.). Feijão
-caupi: avanços tecnológicos. Brasília: Embrapa,
MOHAMMED, I. B. et al. Productivity of Millet / Cowpea Intercrop as Affected by Cowpea Genotype and Row Arrangement. World Journal of Agricultural Sciences, Zaira, v. 4, n. S, p. 818-824, 2008.
NECHET, K. L.; HALFELD-VIEIRA, B. A. Reação de cultivares de feijão-caupi à mela (Rhizoctonia solani) em Roraima. Fitopatologia Brasileira, Brasília, v. 32, n. 5, p. 424-428, 2007.
PAYNE, W. A. Optimizing crop water use in sparse stands of pearl millet. Crop Science, Madison, v. 92, n. 5, p. 808-814, 2000.
PIMENTEL, C. Efficiency of nutrient use by crops for low input agro-environments. In: SINGH, R. P. et al. (Eds.). Focus on plant agriculture: 1 Nitrogen nutrition in plant productivity. Houston: Studium Press, 2006. p. 277-328.
POLTRONIERI, L. S.; TRINDADE, D. R.; SILVA, J. F. A. F et al. Principais doenças do feijão-caupi
(Vigna unguiculata L. Walp.) no Pará e recomendações de controle. 1. ed. Belém, PA: Embrapa CPATU, 1994. 24 p.(Documentos, 75).
RUMJANEK, N. G. et al. Fixação biológica do nitrogênio. In: FREIRE FILHO, F.R. et al. (Eds.). Feijão-caupi: avanços tecnológicos. Brasília:
Embrapa, 2005. p. 281-335.
SANTOS, J. F. et al. Produção e componentes produtivos de variedades de feijão caupi na microregião cariri paraibano. Engenharia
Ambiental, Espírito Santo do Pinhal, v. 6, n. 1, p. 214-222, 2009.
SPRENT, J. I. et al. African legumes: a vital but under-utilized resource. Journal of Experimental Botany, Oxford, v. 61, n. 5, p. 1257–1265, 2010.
TORRES, S. B. et al. Produtividade e morfologia de acessos de caupi, em Mossoró, RN. Horticultura Brasileira, Brasília, v. 26, n. 4, p. 537-539, 2008.
VALADÃO, F. C. A. et al. Inoculação das sementes e adubações nitrogenada e molíbdica do feijoeiro - Comum, em Rolim de Moura, RO. Acta Amazonica, Manaus, v. 39, n. 4, p. 741-748, 2009.