Journal of Eye tracking, Visual Cognition and Emotion Volume 2, Number 1
2012 JETVCE; ISSN 1647-7677
43
Social perception gaze patterns, symptom severity and resting brain
function measured using Arterial Spin Labelling MRI in children with
autism: A preliminary study
L. Diamandis1, A. Saitovitch1,2, H. Lemaitre1, David Grevent1,2, N. Chabane1,3, A. Phillipe2, F. Brunelle1,2, N. Boddaert1,2 & M. Zilbovicius1,2
1
Unité INSERM-CEA 1000 "Imagerie et Psychiatrie"
2
Hôpital Necker Enfants Malades, Paris
3
Hôpital Robert Debré, Paris
1
1
http://www.u1000.idf.inserm.fr/
ABSTRACT
Autistic spectrum disorder (ASD) is characterised by qualitative alterations in reciprocal social interactions. Some recent studies show alterations in gaze patterns during social perception and rest-functional abnormalities in the ‘social brain network’. This study investigated: i) social perception gaze patterns in children with ASD and controls, ii) the relationship between autism clinical severity and social perception gaze patterns, iii) the relationship between resting cerebral blood flow (rCBF) and social perception gaze patterns. Methods: Nine children with ASD and 9 children with typical development were studied. Eye-tracking was used to detect gaze patterns during presentation of stimuli depicting social scenes. Autism clinical severity was established using the Autism Diagnostic Interview Revised (ADI-R). Arterial spin labelling MRI was used to quantify rCBF. Results: The ASD group looked less at social regions and more at non-social regions than controls. No significant correlation was found between ASD clinical severity and social perception gaze patterns. In the ASD group, gaze behaviour was related to rCBF in the temporal lobe regions at trend level. Positive correlations were found between temporal rCBF and gaze to the face region, while negative correlations were found between temporal rCBF and gaze to non-social regions. Conclusions: These preliminary results suggest that social perception gaze patterns are altered in children with ASD, and could be related to temporal rCBF.
1. INTRODUCTION
The term autistic spectrum disorder (ASD) is used to describe a group of disorders characterized by the triad of impairments they hold in common: impaired social interactions, impaired verbal and non-verbal communication, repetitive and stereotyped patterns of behaviour and restricted interests and activities (APA, 2000). One of the most striking features of the disorder lies within the realm of social behaviour, where it has been widely observed that individuals with ASD have atypical eye gaze behaviour during social interactions (Nation & Penny, 2008, Spezio et al., 2007, Neumann et al., 2006). Non-verbal communication using eye gaze is particularly important in human social interactions (Itier & Batty, 2009) and it has been proposed that there may be a link between the way in which social stimuli such as faces, are processed, and the social interaction difficulties observed in ASD (Joseph & Tager-Flusberg, 2004).
Eye-tracking methodology has been used to investigate this hypothesis (Gredeback, Johnson & von Hoffman, 2010, Boraston & Blakemore, 2007), by recording the gaze patterns of adults and children with
ASD during the perception of dynamic and static social stimuli, and comparing them with those of controls. Klin and colleagues (2002) were the first group to publish such a study, describing a tendency for subjects with ASD to look less at social areas (e.g. eyes and faces) and more at non-social areas in scenes taken from the film Who’s afraid of Virginia Woolf. A substantial body of work supports these findings in adults and children with ASD whilst other studies have been unable to find such differences in social gaze patterns, perhaps due to the heterogeneity of the populations, stimuli, and tasks used (see Boraston and Blakemore, 2007 for a review). With respect to the stimuli used in eye-tracking, some authors suggest that the nature of the stimulus must be both dynamic (e.g. films compared with photographs) as well as social, in order to elicit gaze differences between groups, particularly if the participants are children, since some studies report no differences between groups when children are tested using static social stimuli (Speer et al., 2007, Kemner & van England, 2003). Saitovitch and colleagues (submitted) investigate this further, using both static and dynamic stimuli depicting either animations or human actors, concluding that the stimuli which best discriminate children with ASD from controls, are those that are both dynamic and the most ecologically valid (e.g. movies using human actors), although differences between groups were found in their experiments using static stimuli also. Some studies have also used eye-tracking data to investigate the relationship between gaze behaviour and severity of autistic symptoms, and have described relationships where gaze to a particular social region such as the eyes can predict the level of social disability (Jones, Carr & Klin, 2008) or symptom severity (Nacewicz et al., 2006). There is certainly much work to be done before a homogeneous approach to investigating gaze pattern in social perception, across a variety of age groups, tasks, and subtypes of ASD may be applied, but what is certain is the value of eye-tracking methodology as a covert tool for capturing gaze behaviour.
In the field of neuroimaging, a number of studies have revealed structural and functional abnormalities in the ‘social brain network’ of individuals with ASD (Verhoeven et al., 2010). The social brain network, (supporting a wide range of social tasks crucial for human social interactions) consists of the amygdala, superior temporal gyrus, ventro-temporal regions such as the fusiform gyrus, and frontal areas such as the medial pre-frontal and orbito-frontal cortex. The superior temporal sulcus (STS) is an extremely important part of this network, playing a central role in the perception and processing of multi-modal social stimuli, as well as receiving and integrating higher level sensory and limbic information (Zilbovicius et al., 2006). Furthermore, single-cell recording studies have demonstrated cortical cells in the inferior temporal cortex and STS that are selective to the perception of faces and even of eyes (Itier & Batty, 2009), hence there is an intuitive notion that abnormalities of the STS and other parts of the social brain network may be highly related to the difficulties in social interaction observed in people with ASD. Interestingly, structural abnormalities such as reduced grey matter (Boddaert et al., 2004), and abnormal functional activation during social tasks have been described in the STS (for a review see Zilbovicius et al., 2006 and Pelphrey et al., 2004), particularly in tasks of emotion and facial processing (Critchley et al., 2000, Speer et al., 2007) and theory of mind tasks (Castelli et al., 2002) which often require the perception and processing of eye gaze to correctly interpret the intentions or emotions of others.
However, there has been little work examining the resting-state (or non task-related) activity of the brain and its relationship with social behaviours, such as eye gaze. This is mainly due to the fact that up until now, most imaging techniques were invasive and required the use of potentially harmful radiation (e.g. PET, SPECT imaging), rendering their use difficult to justify in control participants, particularly in paediatric populations. Studying resting brain function by measuring resting blood flow or resting brain perfusion is interesting for a number of reasons. Firstly, it gives us an idea of baseline brain activity at rest, hence the resources potentially available to support neurons during periods of increased activity. Secondly, abnormalities of brain function in particular areas at rest, may help to explain atypical performance on tasks that those brain areas support when active, and could provide a ‘neural signature’ for some disorders in the future. Thirdly, the developmental trajectory of resting brain function may be of great use in the assessment of neuropsychiatric disorders, making diagnoses, and targeting therapeutic interventions (Théberge, 2008, Boddaert & Zilbovicius, 2002). There are very few studies investigating resting brain function in children with ASD, but their findings are consistent with structural and activation abnormalities found in the social brain network using structural and functional imaging techniques. For example, localised hypoperfusion in
Journal of Eye tracking, Visual Cognition and Emotion Volume 2, Number 1
2012 JETVCE; ISSN 1647-7677
45 ASD groups has been described in the temporal regions bilaterally (Zilbovicius et al., 2000, Ohnishi et al., 2000), specifically in the associative auditory cortex (superior temporal gyrus) and in the multimodal cortex (superior temporal sulcus) (Boddaert et al., 2002), in the temporo-frontal (Gillberg, 1993), temporo-parietal regions (Mountz, 1995), frontal (Yang et al., 2011) and pre-frontal regions (Gupta et al., 2009), and globally throughout the brain (Burroni et al., 2008). Although eye-tracking has previously been combined with functional imaging to investigate gaze behaviour and neural activity during social perception tasks (reviewed in Boraston & Blakemore, 2007), we are not aware of any published studies examining whether resting CBF (i.e. non-task-related cerebral blood flow) is related to gaze behaviour in social perception.
The main aim of this pilot study, was to create and test a new experimental method, combining the use of a novel imaging technique - Arterial Spin Labelling MRI, with eye-tracking methods, in order to explore whether rCBF in social brain regions is related to social perception gaze abnormality in children with ASD. Therefore, using eye-tracking we first investigated whether there were differences in social perception gaze patterns between children with ASD and controls, using both static and dynamic stimuli, and secondly, we used a clinical scale of ASD symptom severity to investigate the relationship between social perception gaze patterns and the severity of autistic symptoms in the group of children with ASD. We predicted that we would find a difference in gaze pattern between children with ASD and controls, and that in the ASD group, gaze pattern would be related to symptom severity. Finally, we predicted that gaze abnormalities in the ASD group would be related to rCBF values in social brain areas.
2. METHODS
2.1 Eye-tracking
2.1.1 Participants. Nine children (7 boys) diagnosed with ASD between 4-13 years of age (mean 7.51 years, SD 3.35) were recruited to participate in the study. These children were diagnosed with ASD as per DSM-IV-R criteria (APA, 2000) and ADI-R (Lord, Rutter, & Le Couteur, 1994) and were recruited from hospitals in Paris, France. The mean ADI-score for the ASD group was 42.88 (SD = 14.22, range 21-67). Nine control children (5 male) between 4-15 years of age (mean 12.68 years, SD 3.43) with no history of neurological or psychiatric disorder were recruited to take part in the eye-tracking experiment only. A Mann-Whitney U-test revealed that the age of the two groups was significantly different (z = -2.502, P = 0.012), therefore comparisons of group performance in this preliminary analysis are considered with caution. The eye-tracking experiment was carried out before, and separate to the MRI scan. The study was carried out with parental consent, and in accordance with ethical guidelines.
2.1.2 Equipment. The experiment was carried out using Tobii T120 Eye Tracker equipment (Tobii Technology AB, Sweden), consisting of a 17-inch TFT monitor with a resolution of 1280 x 1024 pixels on which the stimuli were presented, and from which gaze was recorded simultaneously. Gaze position was registered in real time, at a rate of 120 Hz and a precision of 0.5 degrees. The eye-tracker was connected to a laptop used to run the tasks. Stimulus creation, calibration procedures, data acquisition, and visualization were carried out using the Tobii Studio TM Analysis Software. All participants were seated facing the Tobii monitor at a distance of approximately 60 cm and asked to watch the screen. A calibration test was carried out before each set of stimuli was presented and repeated if one of 5 fixation points was not registered. The experimenter explained to the child that they would see some films and photographs appear on the screen, and to watch these.
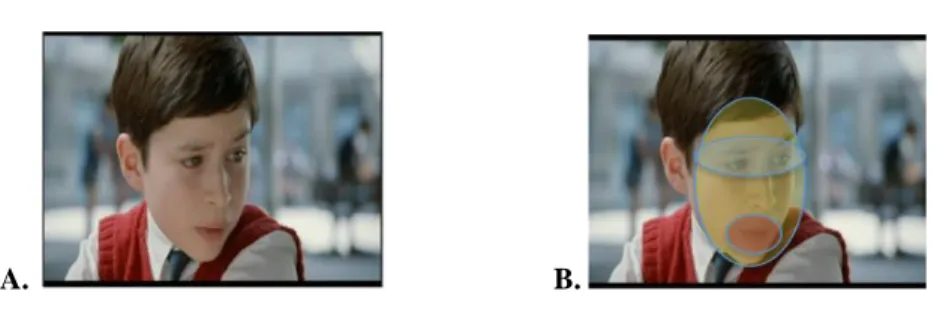
Stimuli (illustrated in Figure 1) were in the form of a videoclip and a photograph, in order to investigate if it is possible to elicit gaze differences between groups using both dynamic and static stimuli. The videoclip stimulus consisted of an extract (53 seconds in duration) taken from a commercial film for children showing a social situation in a film with human actors (the 2009 version of René Goscinny’s ‘Le Petit Nicolas’, directed by Laurent Tirard). For the photograph stimulus, one social scene selected from the extract above was shown for 5 seconds.
A. B.
Figure 1. Illustration of the children’s film ‘Petit Nicolas’ used to create the videoclip and
photograph stimuli (A), and representation (not to scale) of how regions of interest (eyes, mouth, face, non-social) were selected (B).
2.1.4 Data processing. Data were analysed using the Tobii StudioTM Analysis Software and SPSS software (Technologies, Inc., Chicago, IL). For the film extract, three scenes of approximately 1.5 seconds were selected (from the start, middle, and end of the extract) for analysis (as in Saitovitch et al., submitted). Within each social scene, regions of interest (ROI’s) were defined, these being the eyes, mouth, and face; all fixations outside these areas were counted as being in the non-social ROI. The ROI’s were the same for both the videoclip and photograph stimuli. Two parameters were measured: i) Fixation duration (FD) - total duration of all fixations recorded within a ROI; ii) Fixation count (FC) - number of fixations made inside a ROI. A fixation is recorded when gaze falls anywhere within a ROI (social fixation) or outside (non-social fixation). For the videoclip stimulus, summative scores of each gaze parameter (FD and FC) within every ROI were obtained, using the data recorded from the three pre-selected scenes of the videoclip. Relative scores for FD for each ROI, were calculated to obtain the percentage of time spent fixating on a ROI during the presentation of the videoclip. Data was processed in the same way for the FD’s of the photograph. Analyses comparing the gaze behaviour of the two groups were carried out using Mann-Whitney U tests (two-tailed). Within-group analyses were carried out for the ASD group only, using Spearman’s correlation analyses to investigate the relationship between gaze parameters during social scene perception and symptom severity, using the eye-tracking data and ADI-R scores.
2.2 Arterial Spin Labelling (ASL) MRI
2.2.1 Participants. Only children with ASD underwent MRI scanning. Contraindications to undergoing MRI were ruled out by administration of a questionnaire prior to scanning. Children under 10 years old were administered a sedative (Phenobarbital) in accordance with medical protocol, in order to undergo the MRI.
Journal of Eye tracking, Visual Cognition and Emotion Volume 2, Number 1
2012 JETVCE; ISSN 1647-7677
47 2.2.2 MR imaging and data acquisition. A GE Signa 1.5 Tesla magnetic resonance imager (MRI) was used to examine participants at rest (HDX; General Electric Medical System, Milwaukee, Wisc., USA). Axial T1-weighted images for anatomical co-registration were acquired. Perfusion images measuring resting cerebral blood flow (rCBF), were acquired using pulsed continuous arterial spin labelling (PC-ASL). For these perfusion images, gradient 3D spin images (with spiral filling of the K space) were obtained. The ASL perfusion protocol was as follows: repetition time: 1426 ms, echo time: 5.224 ms, flip angle: 155°, field of view: 24 x 24 cm2, slice thickness: 4 mm, NEX: 3, number of inter- leaved slices: 80, acquisition matrix: 128 x 128 resulting in an in-plane resolution of 1.88 mm, duration: 5min 35sec.
2.2.3 Data processing and treatment. T1 and ASL images were transferred and analysed using SPM8 software (http://www.fil.ion.ucl.ac.uk/spm). Whole brain regression analyses were performed using the smoothed ASL images, and eye-tracking data recorded from the videoclip stimulus, using SPM8 in the framework of the general linear model. Since this is a preliminary study, all p-values < 0.001 are uncorrected, hence significant correlations are considered at the trend level only.
3.0 RESULTS
3.1 Does the gaze pattern of children with ASD in social scene perception differ to that of controls, and is this gaze pattern associated with the severity of autistic symptoms in children with ASD?
For the photograph, the ASD group demonstrated a significantly shorter fixation duration (FD) to the eyes than controls (z = -3.001, p = 0.003; means: ASD 0.51 seconds, control 2.06 seconds), and a significantly lower fixation count (FC) for the eyes (z = -3.160, p = 0.002, means: ASD = 1.38, controls, 6.33). The ASD group also demonstrated a lower FC to the face than the control group (z = -2.133, p = 0.033; means: controls = 10.44, ASD = 7.25,). For the non-social ROI, the FD was significantly higher for the ASD group than controls (z = -0.269, p = 0.007, means: ASD = 1.51 seconds, controls = 0.4 seconds) as was the FC to the non-social region (z = -2.100, p = 0.035, means: ASD = 3.56, controls 1.67.) At the trend level the ASD group demonstrated a higher FC to the mouth than controls (z = -1.694, p = 0.09, means: ASD = 1.63, controls = 0.24).
For the videoclip stimulus, two control participants were removed from the analysis due to problems with data acquisition. The ASD group demonstrated a significantly longer FD (z = -2.917, p = 0.004; means: ASD = 0.15, control = 0.01), and a higher FC to the non-social region than controls (z = -2.348, p = 0.019; means: ASD = 5, controls = 1.29). Furthermore, at the trend level the ASD group had a significantly shorter FD to the face ROI than controls (z = -1.680, p = 0.093, means ASD = 0.53, controls 0.57).
The correlations between the ADI-R score in the group of children with ASD, and the eye-tracking data, did not reveal any significant relationships between symptom severity and gaze parameters (FC and FD for each ROI) measured from the photograph stimulus, nor from the videoclip stimulus.
3.1 Are gaze patterns in children with ASD related to resting cerebral blood flow?
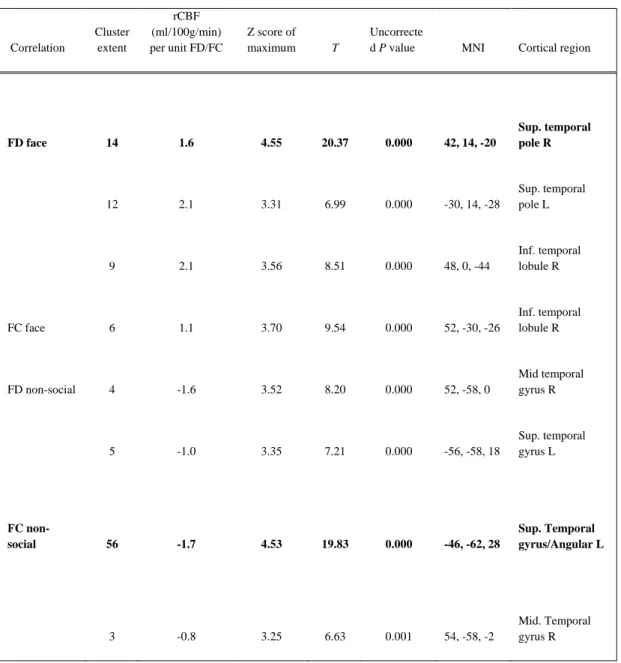
Table 1 summarises the statistical values and MNI co-ordinates for each correlation found between rCBF and gaze data (FD or FC) for the face and non-social ROI’s recorded from the videoclip. Resting CBF was positively correlated with FD to the face in the following brain areas: superior temporal pole (STP) bilaterally (right: x = 42, y = 14, z = -20, left: x = -30 y = 14, z = -28), and the right inferior temporal lobe (rITL), illustrated in Figure 2. Similarly, rCBF was significantly positively correlated with the FC to the face in the rITL ( x = 52, y = -32, z = -26). Resting CBF was negatively correlated with FD to the non-social region in the temporal areas: right mid temporal gyrus (rMTG) (x = 52, y = -58, z = 0) and in the left mid superior temporal gyrus (mSTG) (x = -56, y = -58, z = 18). Similarly, the FC in non-social regions was also
negatively correlated with rCBF in the right mid temporal (x = 54, y = 58, z = -2) and left angular part of the superior temporal gyri (x = -46, y = -62, z = 28), illustrated in Figure 3.
Table 1. A value of p<0.001 uncorrected for multiple comparison at voxel level, was accepted as statistically significant (at a
trend level only). MNI coordinates of the correlation sites (with the Z and T scores of the maximum correlation point) and the corresponding cortical region is reported for each significant cluster. FD = fixation duration, FC = fixation count, R = right, L = left. The values for the increase or decrease in rCBF per unit of FD/FC are also listed for each site of maximum correlation. Text in bold represents the site of maximal correlation.
Correlation Cluster extent rCBF (ml/100g/min) per unit FD/FC Z score of maximum T Uncorrecte
d P value MNI Cortical region
FD face 14 1.6 4.55 20.37 0.000 42, 14, -20 Sup. temporal pole R 12 2.1 3.31 6.99 0.000 -30, 14, -28 Sup. temporal pole L 9 2.1 3.56 8.51 0.000 48, 0, -44 Inf. temporal lobule R FC face 6 1.1 3.70 9.54 0.000 52, -30, -26 Inf. temporal lobule R FD non-social 4 -1.6 3.52 8.20 0.000 52, -58, 0 Mid temporal gyrus R 5 -1.0 3.35 7.21 0.000 -56, -58, 18 Sup. temporal gyrus L FC non-social 56 -1.7 4.53 19.83 0.000 -46, -62, 28 Sup. Temporal gyrus/Angular L 3 -0.8 3.25 6.63 0.001 54, -58, -2 Mid. Temporal gyrus R
Journal of Eye tracking, Visual Cognition and Emotion Volume 2, Number 1
2012 JETVCE; ISSN 1647-7677
49
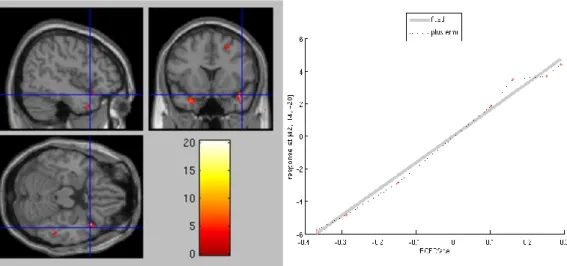
Fig. 2. T-map of SPM correlation (height threshold: Z =4.032, p<0.005 unc.) between resting brain perfusion and FD to the face in the
videoclip, in a group of 7 patients with ASD. Significant areas (displayed on the MNI single subject T1 weighted template) are found in the right superior temporal pole (site of maximum correlation), left superior temporal pole, and right inferior temporal lobule. The plot of
fitted responses is for the site of maximum correlation at the right superior temporal pole.
Figure 3. T-map of SPM correlation (height threshold: Z=4.032, p<0.005) between resting brain perfusion and the FC to the non-social
region in the videoclip, in a group of 7 patients with ASD. Significant areas (displayed on the MNI single subject T1 weighted template) are found in the left superior temporal gyrus (site of maximum correlation), and in the right mid temporal gyrus. The plot of fitted
responses is for the site of maximum correlation at the left superior temporal gyrus.
4. DISCUSSION
In this paper we report the preliminary results of our study, which combines eye-tracking with novel ASL-MRI methodology, to investigate the neural bases of social impairments in autism. As predicted, the results of our eye-tracking experiments suggest that there are differences between the spontaneous social perception gaze patterns of children with ASD and controls. Data from the photograph stimulus revealed that the children with ASD looked less at the eyes and face and more at non-social areas than the control group. This supports previous work using static social stimuli in child populations (e.g. Riby et al., 2009, Dalton et al., 2006) and suggests that children with ASD may display preferential attention to non-social stimuli in social scenes, also recently demonstrated in a group of toddlers with ASD in the context of adult-child play interactions (Shic et al. 2011). The videoclip results also revealed a significant difference between groups
when viewing non-social ROI’s (children with ASD view the non-social ROI’s more than, and for longer than controls) and a trend towards looking significantly less at the face ROI. Again, these results corroborate previous studies using dynamic social stimuli in children (Riby et al., 2009, Speer et al., 2007), including one recently submitted for publication by our lab which describes a sample of 18 children with ASD looking less at the face and more at the non-social regions during a social movie relative to 21 control children (Saitovitch et al., submitted). These results support the body of literature suggesting that children with ASD display atypical gaze patterns compared with controls during the perception of social stimuli, and are demonstrated using a task that requires only spontaneous gaze behaviour (as opposed tasks such as facial recognition, in which a detailed, less natural visual search is required). These findings allowed us to investigate whether atypical gaze in our ASD group was related to the severity of autistic symptoms, and to resting brain function (in terms of cerebral blood flow) in the social brain network.
Contrary to our second hypothesis, we were surprised to find no relationship between the ADI-R score of symptom severity and social perception gaze patterns in children with ASD (using the gaze parameter data from both the static and dynamic stimuli). Significant relationships between autistic symptoms and social perception gaze patterns such as Nacewicz and colleagues (2006) who using the ADI-R score and a facial expression judgment task in a group of boys aged 8-25, found that decreased gaze to the eye region was associated with greater childhood social impairment or performance on different types of social perception task. Another study using the Autism Diagnostic Observation Schedule (ADOS) to assess social disability also found that fixation time on the eyes was associated with the level of social disability (the less the fixation on the eyes, the greater the social disability (Jones, Carr, and Klin, 2008). Our findings may not be in line with those of previous studies due to the very small sample size used in this preliminary correlation analysis, which will be addressed as our study continues. Another explanation could be that the relationship between these two variables is non-linear, and we will need to apply different statistical analyses to explore this possibility in the future. A final consideration is whether gaze behaviour is independent of the ADI-R score i.e. children with ASD may demonstrate atypical gaze independent of their symptom severity (whether mild, moderate, or severe) and whether environmental influences such as educational interventions may have affected the relationship between gaze, and symptom severity score in the current sample.
Our final main objective was to quantify rCBF using MRI-ASL in children with ASD, and explore whether individual differences in rCBF are related to the degree of social perception gaze abnormality. Correlating the gaze parameters measured from the videoclip with rCBF, some significant relationships were revealed as predicted (using uncorrected statistical measures). Using the FD data for the face region from the videoclip, we found positive correlations with rCBF in the STP’s bilaterally and the rITL. These temporal lobe areas are critically involved in the perception and processing of social stimuli such as faces and facial features, and in other aspects of social cognition more generally, such as theory of mind tasks (Castelli et al., 2002, Itier & Batty, 2009). These correlations suggest that the children with ASD, who spent more time looking at the face, were also likely to have higher rCBF in these temporal regions. This is interesting as it could imply that children with ASD who have a better baseline CBF have better resources for processing social stimuli. Similarly, using the FD variable, negative correlations were found between FD to the non-social region and rCBF in the right and left mid temporal gyri, and the left mSTG. Using the FC variable, negative correlations were also found between the FC to non-social regions in the videoclip and rCBF in the right mid temporal and left angular part of the superior temporal gyri. These negative correlations suggest that children with ASD who look more at the non-social region may also have lower resting CBF in the areas described above. Our preliminary results are in line with previous studies, revealing perfusion abnormalities in the temporal lobe areas of children with ASD (Ohnishi et al., 2000, Zilbovicius, 2000, Gendry Meresse et al., 2005) and suggest that atypical resting cerebral blood flow in brain areas supporting social cognition may contribute to the social interaction difficulties encountered by individuals with ASD, although more work is required to validate this hypothesis.
As in similar investigations involving children with developmental disorders, and particularly those that use neuroimaging methods, some improvements, such as increasing the sample size and matching groups for developmental or chronological age, could be made in future work in order to rule out the possibility of differences occurring between groups as a result of developmental processes or environmental influences shared by children in the same age group. The present study was performed with child participants with ASD who spontaneously view both dynamic and static social scenes and provides the first measure of non task-related brain activity in children with autism, using a new imaging technique not previously used in children with ASD. ASL-MRI holds great potential in terms of its use in longitudinal assessments of resting cerebral blood flow, and its non-invasive nature, which makes it ideal for use in paediatric populations. This study is currently being extended to a larger population in order to provide an insight into the relationship between an
Journal of Eye tracking, Visual Cognition and Emotion Volume 2, Number 1
2012 JETVCE; ISSN 1647-7677
51 conclusion, the relationships between rCBF and social perception gaze patterns revealed in the current study are particularly relevant, as they may shed light on the neural correlates of social impairments in ASD, and help direct new therapeutic interventions as they emerge. Therefore, we suggest that the combination of eye-tracking with ASL-MRI could be a powerful approach for studying the neural bases of social impairments in children with autistic spectrum disorder.
5. REFERENCES
American Psychiatric Association. Diagnostic and Statistical Manual of Mental Disorders (2000). DSM-IV-TR Fourth Edition. American Psychiatric Publishing
Boddaert N, Chabane N, Gervais H, Good CD, Bourgeois M, Plumet MH, Barthélémy C, Mouren MC, Artiges E, Samson Y, Brunelle F, Frackowiak RS, Zilbovicius M. (2004). Superior temporal sulcus anatomical abnormalities in childhood autism: a voxel-based morphometry MRI study. Neuroimage 23(1):364-9.
Boddaert, N, & Zilbovicius, M. (2002). Functional Neuroimaging and Childhood Autism. Pediatr Radiol 32: 1-7
Boraston Z, Blakemore SJ. (2007). The application of eye-tracking technology in the study of autism. J Physiol. 15;581(Pt 3):893-8.
Burroni L, Orsi A, Monti L, Hayek Y, Rocchi R, Vattimo AG. (2008). Regional cerebral blood flow in childhood autism: a SPET study with SPM evaluation. Nucl Med Commun 29(2):150-6
Castelli F, Frith C, Happe F & Frith U (2002). Autism, Asperger syndrome and brain mechanisms for the attribution of mental states to animated shapes. Brain 125, 1839–1849.
Critchley HD, Daly EM, Bullmore ET, Williams SC, Van Amelsvoort T, Robertson DM et al (2000). The functional neuroanatomy of social behaviour: changes in cerebral blood flow when people with autistic disorder process facial expressions. Brain 123(Pt 11):2203–2212
Dalton KM, Nacewicz BM, Alexander AL & Davidson RJ (2006). Gaze-fixation, brain activation, and amygdala volume in unaffected siblings of individuals with autism. Biol Psychiatry 61, 512–520.
Gendry Meresse I, Zilbovicius M, Boddaert N, Robel L, Philippe A, Sfaello I, Laurier L, Brunelle F, Samson Y, Mouren MC, Chabane N. (2005). Autism severity and temporal lobe functional abnormalities. Ann. Neurol. 58, 466–469
Gillberg C, Bjure J, Uvebrant P, Vestergren E, Gillberg C. (1995). SPECT in 31 children and adults with autism and autistic-like conditions. Eur Child Adolesc Psychiatry 2:50-59
Gredeback G, Johnson S, von Hofsten C. (2010). Eye tracking in infancy research. Dev Neuropsychol 35: 1-19.
Gupta SK, Ratnam BV. (2009). Cerebral perfusion abnormalities in children with autism and mental retardation: a segmental quantitative SPECT study. Indian Pediatr. 46(2):161-4.
Itier RJ, & Batty M, (2009). Neural bases of eye and gaze processing: The core of social cognition. Neuroscience and Biobehavioral Reviews 33:843–863
Jones W, Carr K, Klin A (2008). Absence of preferential looking to the eyes of approaching adults predicts level of social disability in 2-year-old toddlers with autism spectrum disorder. Arch Gen Psychiatry 65: 946-954.
Joseph RM & Tager-Flusberg H (2004). The relationship of theory of mind and executive functions to symptom type and severity in children with autism. Dev Psychopathol 16, 137–155.
Kemner C & van Engeland H (2003). Autism and visual fixation. Am J Psychiatry 160, 1358–1359. Klin A, Jones W, Schultz R, Volkmar F & Cohen D (2002). Visual fixation patterns during viewing of
naturalistic social situations as predictors of social competence in individuals with autism. Arch Gen Psychiatry 59, 809–816.
Lord C, Rutter M, Le Couteur A. (1994). "Autism Diagnostic Interview-Revised: a revised version of a diagnostic interview for caregivers of individuals with possible pervasive developmental disorders". J Autism Dev Disord 24 (5): 659–85.
Mountz JM, Tolbert LC, Duncan DW, Katholi CR, Liu HG. (1995). Functional deficits in autistic isorder: characterization by technetium-99m-HMPAO and SPECT. J Nucl Med 36:1156-1162
Nacewicz BM, Dalton KM, Johnstone T, Long MT, McAuliff EM, Oakes TR, Alexander AL, Davidson RJ. (2006). Amygdala volume and nonverbal social impairment in adolescent and adult males with autism. Arch Gen Psychiatry. 63(12):1417-28.
Nation K, Penny S. (2008). Sensitivity to eye gaze in autism: is it normal? Is it automatic? Is it social? Dev Psychopathol. 20(1):79-97.
Neumann D, Spezio ML, Piven J, Adolphs R. (2006). Looking you in the mouth: abnormal gaze in autism resulting from impaired top-down modulation of visual attention. Soc Cogn Affect Neurosci 1: 194-202. Ohnishi T, Matsuda H, Hashimoto T, Kunihiro T, Nishikawa M, Uema T, Sasaki M. (2000). Abnormal
regional cerebral blood flow in childhood autism. Brain 123, 1838–1844
Pelphrey KA, Morris JP, McCarthy G. (2004). Grasping the intentions of others: the perceived intentionality of an action influences activity in the superior temporal sulcus during social perception. J Cogn Neurosci 16: 1706-1716.
Riby D, Hancock PJ. (2009). Looking at movies and cartoons: eye-tracking evidence from Williams syndrome and autism. J Intellect Disabil Res 53: 169-181.
Saitovitch, A, Bargiacchi, Chabane, N, Phillipe, A, Brunelle , F, Boddaert, N, Samson, Y, Zilbovicius, M. (submitted). Studying Gaze Abnormalities in Autism: Which Type of Stimuli to Use?
Shic F, Bradshaw J, Klin A, Scassellati B, Chawarska K. (2011). Limited activity monitoring in toddlers with autism spectrum disorder. Brain Res. 22;1380:246-54.
Speer LL, Cook AE, McMahon WM, Clark E. (2007). Face processing in children with autism: effects of stimulus contents and type. Autism. 11(3):265-77.
Spezio ML, Huang PY, Castelli F, Adolphs R. (2007). Amygdala damage impairs eye contact during conversations with real people. J Neurosci 27: 3994-3997.
Théberge, J. (2008). Perfusion Magnetic Resonance Imaging in Psychiatry Top Magn Reson Imaging & Volume 19, Number 2
Verhoeven JS, De Cock P, Lagae L, Sunaert S. (2010). Neuroradiology of autism. Neuroradiology (2010) 52:3–14
Yang WH, Jing J, Xiu LJ, Cheng MH, Wang X, Bao P, Wang QX. (2011). Regional cerebral blood flow in children with autism spectrum disorders: a quantitative ⁹⁹mTc-ECD brain SPECT study with statistical parametric mapping evaluation. Chin Med J (Engl). 124(9):1362-6
Zilbovicius M, Boddaert N, Belin P, Poline JB, Remy P, Mangin JF, Thivard L, Barthélémy C, Samson Y. (2000). Temporal lobe dysfunction in childhood autism: a PET study. Am. J. Psychiatry 157, 1988–1993 Zilbovicius M, Meresse I, Chabane N, Brunelle F, Samson Y, Boddaert N. (2006). Autism, the superior