U
NIVERSIDADE DEL
ISBOAF
ACULDADE DEM
OTRICIDADEH
UMANAEFFECTS OF TWO WEEKS DETRAINING ON METABOLIC
F
LEXIBILITY IN
T
RAINED
O
LDER
A
DULTS
Dissertação elaborada com vista à obtenção do Grau de Mestre em
Exercício e Saúde
Orientador: Professor Doutor Luís Fernando Cordeiro Bettencourt Sardinha Júri:
Presidente:
Doutora Analiza Mónica Lopes Almeida da Silva, professora auxiliar com agregação da Faculdade de Motricidade Humana da Universidade de Lisboa Vogais:
Doutora Maria Helena Santa Clara Pombo Rodrigues, Professora Auxiliar da Faculdade de Motricidade Humana da Universidade de Lisboa
Doutor Luís Fernando Cordeiro Bettencourt Sardinha, Professor Catedrático da Faculdade de Motricidade Humana da Universidade de Lisboa
J
ÚLIA
M
ATOS
L
OPES
2019
3
Acknowledgements / Agradecimentos
Gostaria de prestar o meu agradecimento a todas as pessoas que estiveram comigo durante o meu processo de formação e deram o seu contributo para a elaboração desta tese, tanto diretamente como indiretamente.
Primeiramente gostaria de agradecer ao meu orientador, Professor Doutor Luís Bettencourt Sardinha pela oportunidade de participar num projeto de investigação tão rico a nível científico e pela autonomia que nos proporcionou. Isto permitiu que tivéssemos a perceção do que envolve um projeto de investigação desde a sua conceção à sua execução.
Gostaria também de agradecer ao Pedro Júdice e João Magalhães por me terem transmitido o gosto pela investigação, ajudado e orientado durante toda a intervenção. Foram incansáveis.
Um agradecimento muito especial a todos os participantes, que contribuíram sempre com uma enorme simpatia, tornando toda a intervenção muito mais prazeirosa.
À enfermeira que nos acompanhou, Ana Mil-Homens pela sua boa disposição matinal e
esforço para estar sempre presente, mesmo com recolhas sanguíneas após o seu turno da noite. À APDP, especialmente ao Doutor Rogério Ribeiro, pela sua disponibilidade, pela prestável e rápida ajuda quanto ao fornecimento de material para a investigação e pelo tratamento das variáveis sanguíneas.
Às minhas colegas e amigas que fizeram parte desta investigação. À Inês Correia por elevar bastante a fasquia em tudo o que faz, e me tornar ser mais ambiciosa e exigente comigo mesma. À Sofia Freitas, que me acompanha desde o meu primeiro ano de licenciatura por todas as partilhas e desabafos durante estes 6 anos. Queria agradecer bastante a ambas porque realmente não conseguiria ter concluído este percurso sem elas.
Aos meus melhores amigos Ricardo Nogueira e Mariana Silva por me ajudarem a conciliar o trabalho com o mestrado, nunca me deixarem baixar os braços, serem
4
compreensivos comigo e me aturarem durante todo o percurso, mesmo nos momentos em que me faltou alguma paciência.
Os meus pais porque foram os principais responsáveis para que esta etapa fosse concluída com sucesso, devido ao constante apoio tanto psicológico como financeiro. Aos meus irmãos, em especial à minha irmã que me deu uma mãozinha na parte da nutrição, por, tal como os meus pais, estarem sempre lá para me apoiar em tudo o que preciso.
5
Table of contents
Abbreviations ... 8 Abstract ... 9 Resumo ... 10 Introduction ... 11 Literature Review... 13 1. Metabolic Flexibility ... 13 1.1. Measurement ... 15 Indirect calorimetry ... 15Metabolic flexibility during a euglycemic-hyperinsulinemic clamp ... 16
Metabolic flexibility to a meal ... 17
2. Effects of lifestyle ... 17 2.1. Diet ... 18 2.1.1. Protein ... 18 2.1.2. Carbohydrates ... 20 2.1.3. Lipids ... 21 2.1.4. Energy balance ... 22 2.1.5. Macronutrient balance ... 23 2.1.6. Energy expenditure ... 25 2.2. Sedentary behavior ... 26 2.2.1. Epidemiology ... 27
2.2.2. Sedentary behavior vs Physical Inactivity ... 28
2.2.3. Generical effects on health ... 29
2.3. Physical inactivity and detraining ... 32
2.3.1. Epidemiology ... 33
2.3.2. Effects of short-term detraining ... 33
2.4. Sedentary behavior, physical inactivity, detraining, and metabolic flexibility ... 36
3. Determinant factors of metabolic flexibility ... 37
3.1. Insulin ... 37
3.2. Free Fat Acids (FFA) ... 40
3.3. Mitochondrial oxidative capacity ... 40
3.4. Skeletal muscle ... 41
4. Aging ... 42
6
Methodology ... 44
1. Recruitment process ... 44
2. Study design ... 45
3. Baseline and follow – up assessments... 47
3.1. Anthropometric measures ... 47
3.1.1. Height and weight ... 47
3.2. Body composition measurements... 47
3.3. Cardiorespiratory fitness ... 48
3.4. Metabolic flexibility ... 48
4. Detraining period... 50
5. Objective measures of sedentary time and PA ... 51
6. Laboratory measurements ... 52
7. Calculations and statistical analyses ... 52
Results ... 53
1. Participants Characteristics ... 53
2. Metabolic Flexibility ... 55
2.1. Description for the response to the oral glucose load on each moment ... 55
2.2. Differences for the responses to glucose load between the two moments ... 56
Discussion ... 58
1. Baseline metabolic flexibility... 58
2. Post-detraining metabolic flexibility ... 60
3. Metabolic flexibility difference between the two moments ... 61
Limitations ... 65
Conclusion ... 66
Future work ... 66
References ... 67
Appendix A - exclusion criteria questionnaire ... 77
7
Tables and figures
Figures List
Fig. 1. The variance-based concept of metabolic flexibility. ... 14
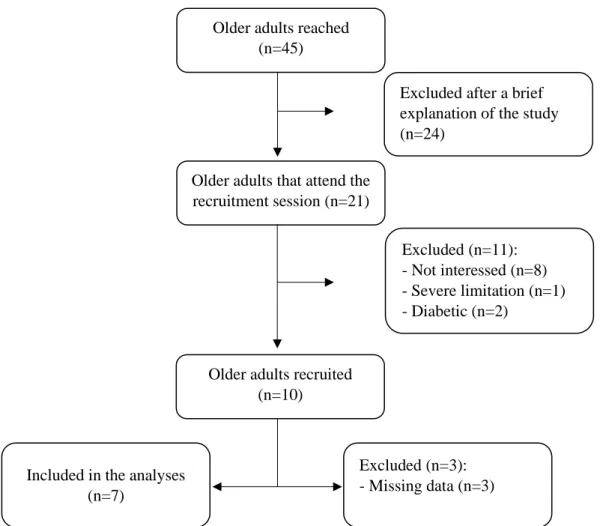
Fig. 2. Flowchart of participant recruitment. ... 45
Fig. 3. Intervention guide comprising all the assessments and protocols from the three studies
included in the intervention ... 46
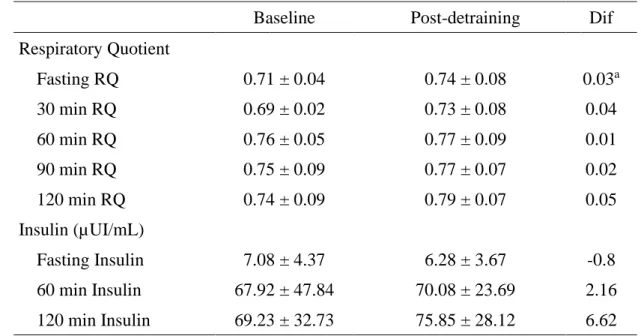
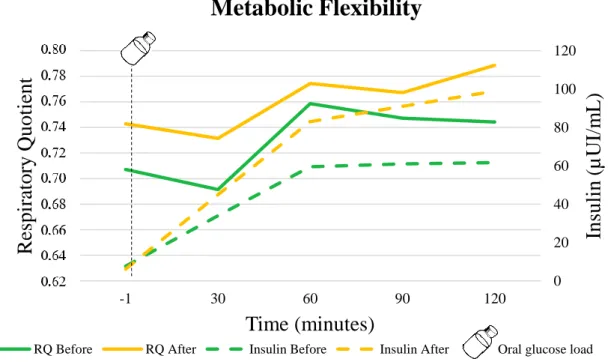
Fig. 4. Time course of NPRQ and plasma insulin concentrations before and after detraining. ... 56
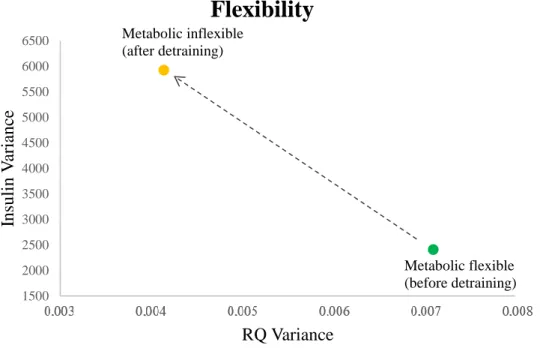
Fig. 5. Relationship between variance in insulin and variance in RQ during the training stage - before
detraining period and after the short-term detraining. ... 57
Table List
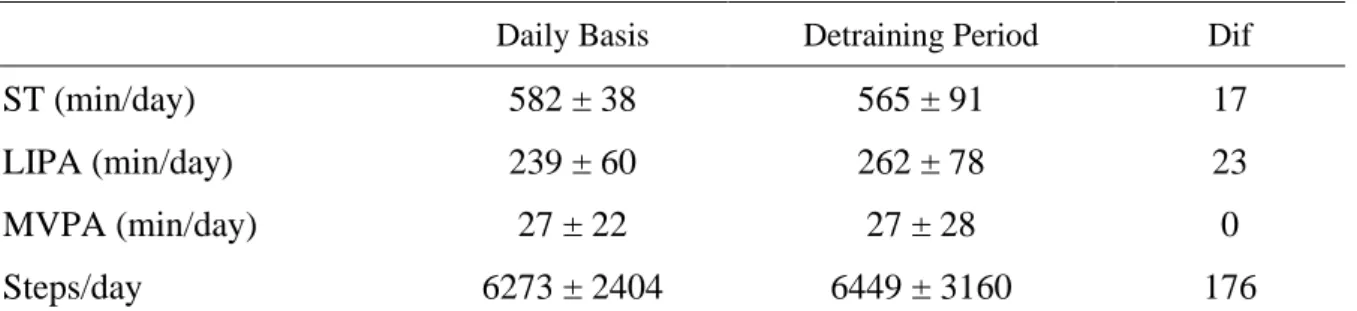
Table 1. PA data measured on a daily basis, before and during the 2-weeks of detraining ... 53
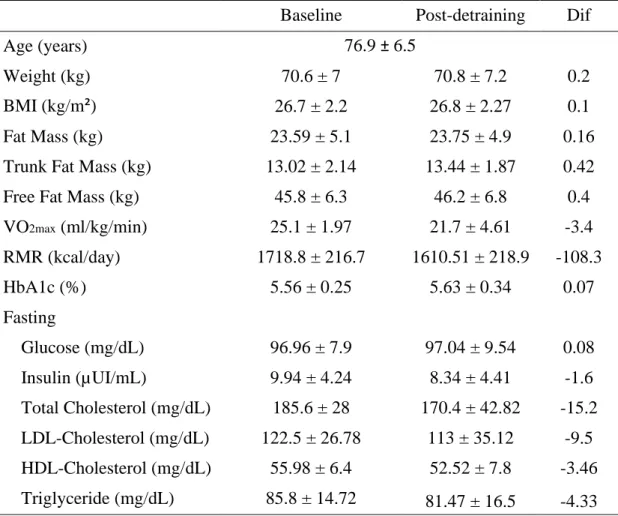
Table 2. Baseline and post-detraining characteristics of study participants ... 54
8
Abbreviations
ACSM
American College of Sports Medicine
AUC
area under the curve
BIA
bioelectrical impedance analysis
BMC
bone mineral content
BMI
body mass index
CV
coefficient of variation
DXA
dual-energy X-ray absorptiometry
FFA
free fat acids
FM
fat mass
FFM
free fat mass
MET
metabolic equivalent
MF
metabolic flexibility
MVPA
moderate-vigorous physical activity
PA
physical activity
RCT
randomized controlled trial
REE
resting energy expenditure
RDA
recommended dietary allowance
RMR
resting metabolic rate
RQ
respiratory quotient
TEF
thermic effect of food
VO
2maxmaximal oxygen uptake
9
Abstract
Background/Objective: Metabolic flexibility (MF) is highly influenced by lifestyle, in particular by physical activity and diet. However, little attention has been given to the impact of the adoption of sedentary behaviors, physical inactivity and detraining on MF especially in the older adults. Therefore, the aim of this study is to evaluate the effects of a two-week interruption of habitual supervised and structured exercise sessions on MF in trained older adults.
Methods: MF was evaluated in 7 older adults (3 females) aged ≥ 65 years (76.9 ± 6.5), before and after the short-term detraining, using indirect calorimetry to analyze the variance in the respiratory quotient (RQ) during the transition from fasting to 100 g oral glucose load. The test had a duration of 2 hours, and to measure the insulin response to the glucose load, blood samples were collected every 60 minutes (i.e. fasting, 60 min, and 120 min). To compare the difference between the moments, a general linear model for repeated measures was used adjusted for the covariates sex and age.
Results: There were only differences between the two moments in fasting RQ(P= 0.044). However, there was a trend for all the RQ and insulin mean values being higher after the detraining period. After detraining there was a decrease of 41.7% in RQ variance (P=0.231) and an almost threefold increase in insulin variance (P=0.692).
Conclusions: We showed that two weeks did not decrease MF among trained older adults. However, there is a trend to: (1) increase the reliance on carbohydrate as an energy substrate associated with a decrease in fat oxidation, (2) slow the response to the 100 g oral glucose load, (3) reduce RQ variance and increase that for insulin in response to the oral glucose load. Key-words: physical inactivity, insulin, respiratory quotient, older adults, metabolic health, lifestyle, detraining, metabolic flexibility.
10
Resumo
Contextualização/Objetivos: A flexibilidade metabólica (FM) é influenciada pelo estilo de vida, nomeadamente pelo exercício físico e a alimentação. Porém, pouca atenção tem sido dada ao impacto do comportamento sedentário, da inatividade física e do destreino na flexibilidade metabólica, especialmente na população idosa. Assim, o objetivo deste estudo foi investigar o efeito de duas semanas de destreino na flexibilidade metabólica em pessoas idosas treinadas. Métodos: A FM foi avaliada em 7 pessoas idosas (3 mulheres) com idade ≥ 65 anos (76.9 anos ± 6.5), antes e após as 2 semanas de destreino, utilizando a calorimetria indireta para analisar a variância no quociente respiratório (RQ) durante a transição do jejum para a ingestão de 100 g de glicose. O teste durou 2 horas, e para medir a resposta da insulina à carga de glicose, foi coletada uma amostra de sangue a cada 60 minutos (jejum, 60 min e 120 min). Para comparar a diferença entre os momentos foi utilizado um modelo linear geral para medidas repetidas, ajustado para as covariáveis sexo e idade.
Resultados: Apenas se verificaram diferenças entre os dois momentos no RQ em jejum (P=0.044). Contudo, é notória uma tendência para o aumento de todos os valores médios de RQ e insulina após o destreino. Com o destreino, verificou-se uma redução de 41,7% na variância do RQ (P=0,231) e um aumento quase triplo na de insulina (P=0,692).
Conclusão: Duas semanas de destreino não foram suficientes para diminuir a FM em pessoas idosas treinadas. No entanto, existe uma tendência para: (1) aumentar a utilização de carboidratos como substrato energético e diminuir a oxidação de gorduras, (2) diminuir a velocidade de resposta às 100 g de glucose, (3) reduzir a variância de RQ e aumentar a de insulina em resposta às 100 g de glicose.
Palavras chave: inatividade física, insulina, quociente respiratório, idosos, saúde metabólica, estilo de vida, destreino, flexibilidade metabólica.
11
Introduction
During the prehistory, human survival was dependent on the physical ability for hunting and, given the constant uncertainty about food availability, humans developed the capacity to have an extremely flexible metabolism that was able to supply energy needs through the use and conversion of another energy substrate as an alternative source of energy to guarantee an energy balance (Freese, Klement, Ruiz-Núñez, Schwarz, & Lötzerich, 2017).
With industrialization, access to food became almost instantaneous, requiring just a few steps to the kitchen, a phone call, or a short drive to the supermarket or a restaurant. Furthermore, technologic devices, occupation, and screen-based entertainment contribute to the reduction of physical activity (PA) and a substantial increase in sedentary time. Therefore, there was an increase in energy intake and a decrease in PA, making overfeeding and sedentary behaviors the new way of living (Bergouignan et al., 2010; Bergouignan, Rudwill, Simon, & Blanc, 2011; Chau et al., 2013).
Sedentary lifestyle and excessive eating habits contribute to the constant availability of energetic substrates that have given rise to many chronic disorders such as obesity and type 2 diabetes (Bergouignan et al., 2011; Rynders, Blanc, DeJong, Bessesen, & Bergouignan, 2017). It is also one of the causes for the inability to adapt substrate oxidation rates in response to changes in fuel availability, known as metabolic inflexibility (Rynders et al., 2017).
Older adults, besides going through processes that involve alterations in cardiovascular physiology and capacity, pulmonary function and respiratory capacity, neural function, endocrine functions, and body composition, are the most sedentary in the population (Harvey, Chastin, & Skelton, 2013; Judice, Silva, & Sardinha, 2015; Santos et al., 2018). These physiological alterations, cause deleterious effects on metabolism, making them less able to adapt the type of substrate being oxidized to the changes in fuel availability, which becomes
12
even more evident when coupled with an unhealthy lifestyle (Flack et al., 2010; López-Otín, 2013; McArdle et al., 2015).
Thus, it is possible to perceive that the adopted lifestyle has a high impact on the metabolism itself. In this regard, my dissertation will focus on the role of PA and sedentary behaviors on the regulation of metabolic flexibility (MF) in the older population.
After this theoretical framework that introduces the topic, emphasizing its relevance, the present dissertation will be composed by an extensive literature review that consists of a review of the current literature regarding MF definition, measurement techniques, determinant factors, the effects of lifestyle on MF, and its relation with aging. This section finishes by highlighting the pertinence of the study, with the main objectives and hypotheses outlined. Subsequently, the methodology will describe the population and the methods, followed by the results obtained, and the discussion. Lastly, the main conclusions of the present research along with future recommendations will be outlined.
13
Literature Review
1. Metabolic Flexibility
Metabolic flexibility (MF) is defined by the capacity to switch from predominantly lipid oxidation and high rates of fatty acid uptake during fasting conditions to the suppression of lipid oxidation and increased glucose uptake, oxidation, and storage after feeding (Kelley & Mandarino, 2000). The ability to adapt the fuel utilization to substrate availability is given by the respiratory quotient (RQ), defined as the variability of cellular rates of CO2 production
relative to O2 consumption, measured by indirect calorimetry (Muoio, 2014).
During fasting, lipolytic pathways are increased whereas, in response to the transition from predominantly oxidative fatty acid metabolism to feeding, anabolic pathways are activated. This transition to anabolic pathways allows the substrate shift to efficiently utilize energy sources based on the content or mixture of the macronutrients in the meal (Galgani, Moro, & Ravussin, 2008; Goodpaster & Sparks, 2017). The primary purpose of the substrate shift is to move from catabolic to anabolic processes in order to store energy in skeletal muscle, adipose, and liver tissues (Goodpaster & Sparks, 2017).
A metabolically flexible individual is characterized by high variance in RQ, and low variance in plasma insulin concentration (Fig. 1-A), demonstrating a normal post-absorptive and postprandial adaptations in skeletal muscle substrate oxidation (Corpeleijn, Saris, & Blaak, 2009; Rynders et al., 2017). In contrast, a metabolically inflexible individual has a low variance in RQ for high variance in insulin (Fig. 1-B).
14
Although MF is a relatively recent topic in the literature, it is known that a less flexible metabolism, is associated with several health risks and many pathologies. Given the relation of MF with insulin sensitivity, we can say that the large changes in insulin variance, which characterize an individual as metabolically inflexible, are related to insulin sensitivity impairment and/or insulin resistance. Therefore, a metabolic inflexible individual can have type 2 diabetes mellitus or are at greater risk of developing the disease. This metabolic inflexible condition is also associated with pathologies such as obesity, metabolic syndrome, cardiovascular disease, and cancer (Rynders et al., 2017; Smith, Soeters, Wust, & Houtkooper, 2018). Nevertheless, this deleterious effects on health can be prevented by a more flexible metabolism.
Fig. 1. The variance-based concept of metabolic flexibility.
A
C
RQ variance Insulin va ria nc e Metabolic flexible Metabolic inflexibleIn
su
li
n / RQ
Meal Insulin RQMetabolic flexible individual
In
su
li
n / RQ
Meal Insulin RQMetabolic inflexible individual
B
15
1.1. Measurement
The assessment of MF is, however, not clearly established. Numerous definitions of MF can be found in the literature as well as different ways of measuring it (Bergouignan et al., 2013). Albeit, MF is traditionally evaluated through the measurement of the RQ by indirect calorimetry during the last minutes of a hyperinsulinemic–euglycemic clamp or during the fasted to fed transition (Rynders et al., 2017).
Indirect calorimetry
Indirect calorimetry measures energy metabolism through the assumption that the heat produced as the food is oxidized in the body is directly proportional to the O2 consumed and to
CO2 and H2O produced in these reactions (Ferrannini, 1988). The amount of energy consumed
over a period of time can be evaluated by the ratio between the amount of O2 consumed (VO2)
and the CO2 produced (VCO2), better known as the respiratory quotient (RQ) (McArdle, Katch,
& Katch, 2015). Under a condition in which amino acids contribute to a minimum as an oxidative substrate, RQ can also provide information on the type and rate of substrate utilization (Ferrannini, 1988; Muoio, 2014).
The carbon and oxygen content in molecular formula of glucose and free fatty acids (FFA) are substantially different, which means that when oxidized, the amount of oxygen used differs according to the type of fuel (Kenney, Wilmore, Costill, & Osterberg, 2015). In general, the amount of oxygen required to fully oxidize a molecule of carbohydrate or fat is proportional to the amount of carbon in that fuel. Glucose molecule (C6 H12O6) contains six carbon atoms,
meaning that during glucose oxidation six molecules of oxygen are used to produce six CO2
molecules, six H2O and 32 ATP molecules (Kenney et al., 2015). Thus, to oxidize carbohydrate
the amount of O2 required equals CO2 produced and RQ is 1. On the other hand, FFA has
16
provides more energy than carbohydrate, in order to completely oxidize a molecule of fat, it is necessary to have a higher oxygen use and, the longer the chain of carbons this FFA contains, the more oxygen that will be needed to oxidize it (Kenney et al., 2015). Due to its higher consumption of O2 compared to the production of CO2, RQ value for fat is consequently lower
than RQ for carbohydrate. Thus, without any carbohydrate contribution, RQ for fat is about 0.7 (Kenney et al., 2015).
Metabolic flexibility during a euglycemic-hyperinsulinemic clamp
The most common approach to evaluate the MF to carbohydrate is to measure RQ increase during a euglycemic-hyperinsulinemic clamp (Galgani, Moro, et al., 2008). This method is considered the gold-standard method to assess beta-cell and insulin sensitivity (J. Kim, 2009). It consists of the placement of two catheters, one placed in the arm to continuously infuse insulin and glucose and another in the contralateral hand for blood sampling (DeFronzo, Tobin, & Andres, 1979). The goal of the euglycemic insulin clamp is to raise, through insulin infusion, the plasma insulin concentration acutely to a new plateau and to maintain it at that level (DeFronzo et al., 1979).
To evaluate MF, resting metabolism and clamp-derived carbohydrate oxidation are needed. After an overnight fast, resting metabolism is conducted using indirect calorimetry to determine basal substrate oxidation (Malin et al., 2013). Clamp-derived carbohydrate oxidation is determined by indirect calorimetry during the last 20 minutes of the clamp (Malin et al., 2013). MF to glucose is calculated as the difference between the steady state RQ at the end of the clamp and fasting RQ (Galgani, Heilbronn, et al., 2008; Malin et al., 2013).
17
Metabolic flexibility to a meal
The measurement of MF using euglycemic-hyperinsulinemic clamp besides being an invasive and expensive method to assess insulin sensitivity does not reflect the physiologic responses of meal ingestion. Therefore, the measurement of the RQ by indirect calorimetry during fasting and following meal ingestion has been used as a less invasive and more realistic alternative to evaluate MF (Bergouignan et al., 2013; Heilbronn, Gregersen, Shirkhedkar, Hu, & Campbell, 2007).
Insulin and nonprotein RQ in response to a meal during indirect calorimetry are used to assess MF (Bergouignan et al., 2013). The relationship between the two variables metabolically characterizes the participant as flexible or inflexible (Bergouignan et al., 2013). RQ and insulin variance, area-under-the-curve (AUC), peak magnitude, time-to-peak-magnitude, and slope of initial rise are used in order to evaluate intraindividual responses to a meal (Calçada et al., 2014).
2. Effects of lifestyle
The regulation of fuel consumption and energy demand that affects MF requires an interaction of extrinsic and intrinsic metabolic regulators and effectors (Rynders et al., 2017). The intrinsic and extrinsic factors that contribute to the incapacity to switch the type of substrate being oxidized (carbohydrate and fat oxidation) in response to changes in fuel availability are not well understood. However, it is known that they depend on the mutual influence of lifestyle factors (diet, PA, others) and physiological factors (Corpeleijn et al., 2009; Rynders et al., 2017). This topic will address the influence of lifestyle and how it affects the MF.
18
2.1. Diet
Since it provides energy that preserves the structural and functional integrity of the organism, diet, and energy balance play a key role in human metabolism (McArdle et al., 2015). This section comprises protein, carbohydrate, and lipid recommendations, physiological functions, and association with MF. Energy balance, its importance for weight maintenance and the role of a balanced diet in MF will also be addressed.
2.1.1. Protein
Protein is considered the most important and versatile macronutrient, due to its engagement in every biological process within the body (Wolinsky & Driskell, 2008).About 15% of body weight is attributed to protein, almost half of this protein (43%) is in the skeletal muscle and 10% in metabolically active visceral tissues (liver and kidney). Structural tissues such as skin and blood contain nearly 15% of total protein each, with other organs such as brain, lung, heart, and bones contributing to the remainder (Institute of Medicine, 2005; Lentner, 1981).
The human body is completely dependent on the protein obtained through food to maintain essential body function, protein levels, protein synthesis and amino acid needs (Wolinsky & Driskell, 2008). Dietary protein can come from either animal or vegetal sources. Animal proteins normally contain the nine essential amino acids that we only have access through food and for this reason, are named as complete proteins or high-quality proteins (McArdle et al., 2015). Whereas plant-derived protein, except soybeans that contain all essential amino acids, remain incomplete in one or more essential amino acids and is considered an incomplete protein or with lower biological value (McArdle et al., 2015).
19
Recommended protein intake
Currently, the Recommended Dietary Allowance (RDA) for protein is 0.8g protein/kg of body weight/day, for all adults, regardless of age or sex. In turn, older adults (+65), taking into account the many physiological changes that occur with aging, require a higher protein consumption of 1.0–1.6 g per kg of body weight/day, in order to support good health, promote recovery from illnesses, and maintain functionality (Bernstein, Munoz, Academy of, & Dietetics, 2012; Deer & Volpi, 2015; Deutz et al., 2014).
Role of protein in the body
Protein is a macronutrient that provides 4kcal per gram, with mainly structural and metabolic functions, although under some circumstances, may contribute to energy metabolism (Wolinsky & Driskell, 2008). Protein does not have a store, unlike carbohydrates and lipids, whose primary roles are for energy use. All protein contributes to tissue structures or exists as important constituents of metabolic, transport, and hormonal systems (McArdle et al., 2015; Wolinsky & Driskell, 2008). Just in some situations, protein in amino acid form has a prominent role in energy metabolism and may be converted in FFA, pyruvate, glycogen, acetyl units or glucose and used as an energy substrate (Wolinsky & Driskell, 2008).
Protein and metabolic flexibility
Protein oversupply does not influence total body protein. Its increase is exclusively dependent on growth stimuli, such as growth hormone, androgens, physical training and weight gain (Galgani & Ravussin, 2008, 2009).
Unlike carbohydrates and lipids, whose primary roles are for energy use, protein does not have a store, all protein contribute to tissue structures or exist as important constituents of metabolic, transport, and hormonal systems (McArdle et al., 2015; Wolinsky & Driskell, 2008).
20
Consequently, its use as energy results in functional and structural protein loss, primarily from skeletal muscle and then from the remaining organs (McArdle et al., 2015).
For these reasons, protein consumption and imbalance cannot be implicated as a direct cause of obesity neither as a factor of MF (Galgani & Ravussin, 2008).
2.1.2. Carbohydrates
Carbohydrate is a macronutrient available on leaves, vegetables, fruits and grains that name derives from its chemical composition constituted by atoms of carbon, hydrogen, and oxygen (McArdle et al., 2015). As a protein, a gram of carbohydrate provides 4kcal. It is an essential macronutrient for metabolism in many tissues and organs, with the primary role of providing energy to body cells. It is the most important source of energy during high-intensity exercise since it is practically the only source utilized during maximal and supramaximal exercise (Wolinsky & Driskell, 2008). Furthermore, brain, retina, and red blood cells are totally dependent on glucose for energy, however, during carbohydrate depletion, larger amounts of fat are metabolized and used as ketones for fuel (Wolinsky & Driskell, 2008). The RDA for carbohydrate takes into account the minimum amount of glucose required by the brain without depending on alternative energy sources, resulting in a minimum consumption of 130 g/d for men and women starting at 1 year old. However, the RDA is increased in pregnant and lactating women (Trumbo, Schlicker, Yates, & Poos, 2002).
Carbohydrate and metabolic flexibility
Despite being the macronutrient that is usually the main source of dietary energy, the quantity of energy stored in carbohydrate is very limited, and consist of glycogen stores from liver, kidney, muscle, and other tissues plus the glucose that circulates in the blood (Bray, 1991).
21
When carbohydrates are consumed blood glucose levels, as glycogen storage and glucose oxidation all increase, while fat oxidation is suppressed, leading to a rise in RQ (Galgani, Moro, et al., 2008; Wolinsky & Driskell, 2008). Under normal conditions carbohydrates consumed are not stored efficiently due to the constant need for energy by some tissues and its primary use for energy supply. Although, when carbohydrate intake is significantly greater than its oxidation and glycogen stores are full, carbohydrates are stored as fat in the adipose tissue through lipogenesis (Wolinsky & Driskell, 2008). A positive energy balance and an excessive amount of carbohydrates are required for fat accumulation in adipose tissue and weight gain (Galgani & Ravussin, 2008, 2009). In a healthy 70 kg human, muscle glycogen storage contains approximately 400 g and can only be used by the muscle itself. Liver glycogen, in turn, contains around 100 g and is available to the whole organism through the bloodstream (McArdle et al., 2015; Wasserman, 2009). Given the fact that the body storage system for carbohydrates as glycogen is minimal, excess calories in the form of lipids or protein do not increase glycogen stores (Bray, 1991; Stubbs, Ferres, & Horgan, 2000).
Therefore, since the energy balance must be considered, excess carbohydrate intake alone cannot be the basis of weight gain or considered as a key factor for impairment in MF (Galgani & Ravussin, 2008; Wolinsky & Driskell, 2008).
2.1.3. Lipids
Lipids have important functions in the body including thermal insulation, vitamin carrier, hunger suppression, structural components of cells, protection of vital organs, and as an energy source (McArdle et al., 2015). It provides more than double the energy of carbohydrates and protein, being the most caloric energy source with 9 kcal per gram. It is also the main energy supplier under low-calorie dieting or fasting conditions, cold stress, low to
22
moderate intensity exercise, and prolonged exercise that depletes glycogen reserves (McArdle et al., 2015).
The recommendations for total fat are formulated in order to prevent the fall in HDL cholesterol, with a lower limit no less than 20% and upper range of 35% of total energy intake (Trumbo et al., 2002).
Lipid and metabolic flexibility
Contrarily to protein and carbohydrate, fat storage is unlimitedly reaching between 60000 and 100000 kcal in a typical young male adult whereas carbohydrate energy reserves generally are less than 2000 kcal (McArdle et al., 2015). While under normal conditions, the excess of carbohydrates will not be stored as fat, any dietary fat included in the meal that is not utilized for energy will be stored in the adipose tissue, and body fat gain can result (Wolinsky & Driskell, 2008). Under positive energy balance, the energy consumed in excess can result in fat storage due to the efficiency of storing dietary fat over other fuels (Wolinsky & Driskell, 2008).
Accordingly, considering energy balance in humans under physiological conditions, fat is the only nutrient capable of causing a chronic imbalance between intake and oxidation, directly contributing to the increase in adipose tissue (Galgani & Ravussin, 2008). Thus, increased dietary fat may affect the capacity of the body or cells to match fuel oxidation to fuel availability and consequently affect MF (Galgani & Ravussin, 2008).
2.1.4. Energy balance
Changes in the day to day energy and macronutrient intake and daily variation in energy expenditure lead to either positive or negative energy balance (Galgani, Moro, et al., 2008). Nevertheless, not only the energy intake and energy expenditure must be taken into account
23
but also macronutrient intake and oxidation. Consequently, in order to maintain weight and do not store or lose energy stored, energy intake has to match energy expenditure, as well as macronutrient intake must balance macronutrient oxidation (Galgani, Moro, et al., 2008; Galgani & Ravussin, 2008).
Under positive energy balance, the mitochondria are overwhelmed by an excess in substrates derived from fatty acids, glucose, and amino acids. This surplus leads to mitochondrial metabolic ‘indecision’ and ineffective substrate switching, which results in higher energy consumption/expenditure ratio and subsequent storage of substrates (Smith et al., 2018). This storage can be either glycogen from carbohydrates or triglycerides from any macronutrient (Dunstan, Healy, Sugiyama, & Owen, 2010).
Under normal feeding conditions, as well as carbohydrates, increased protein is also followed by a rise in protein oxidation (Wolinsky & Driskell, 2008). Fat intake increase, in turn, does not immediately increases fat oxidation proportionately (Wolinsky & Driskell, 2008). Thereby, the varied responses of carbohydrate, protein, and fat oxidation to changes in macronutrients intake emphasize the importance of nutrient composition in energy balance (Wolinsky & Driskell, 2008).
2.1.5. Macronutrient balance
The ratio of fat and carbohydrate in the diet is the primary factor in the macronutrient composition of the diet that easily causes a positive energy balance that leads to weight gain (Saris, 2003). In this subtopic, the importance of a balanced diet and how diet composition can affect energy balance and MF will be addressed.
24
Low fat vs low carbohydrate diet evidence from systematic reviews
As mentioned before, carbohydrate consumption suppresses fat utilization and oxidation, so low carbohydrate diets promote the use of fat as the main energy source, and due to carbohydrate depletion larger amounts of fat will be metabolized and used as ketones for fuel by the organs totally dependent on glucose (Wolinsky & Driskell, 2008). However, despite the larger amount of fat metabolized when carbohydrate is depleted, fat remains the most caloric energy source, providing more than double the energy produced by carbohydrates and protein with 9 kcal per gram. Besides, fat is also the macronutrient that has the least energy expenditure in its processing, affecting less than 5% of the total thermic effect of food (McArdle et al., 2015). Thereby, since each gram of carbohydrate contains only 4 kcal and one gram of fat 9 kcal, we can consume more than twice the grams of carbohydrates as of lipids for the same number of kilocalories.
With respect to the satiating effects of the macronutrients, the protein appears to be the most satiating, followed by carbohydrate, and lastly fat (Stubbs et al., 2000). Consequently, high-fat foods can readily stimulate high intake of fat energy with no proportionate increase in satiating power (Blundell, Lawton, Cotton, & Macdiarmid, 1996). Furthermore, high-fat diets tend to be associated with insulin resistance while high carbohydrate diets are generally associated with improvements in insulin sensitivity in the short-term (Wilcox, 2005). In addition, the brain’s dependence on carbohydrates as an energy source make the ketogenic low-carbohydrate diets cause tiredness and a greater sensation of hunger, being more difficult to adhere to in the long-term (Hu & Bazzano, 2014).
In summary, although both diets are effective for weight loss, carbohydrates consumption becomes essential to maintain the diet in the long term. The consumption of a balanced diet is, therefore, crucial for the maintenance of weight and to have a flexible
25
metabolism, both in energy level and in macronutrient distribution according, and intake according to the RDA.
2.1.6. Energy expenditure
Resting energy expenditure (REE)
This component reflects the minimum amount of energy required to sustain vital physiologic functions in the waking state. Plus, it is the one that contributes most to the total energy expenditure from 50% to 70%, depending on daily activities and physical exercise (Kenney et al., 2015; McArdle et al., 2015). REE is influenced by a number of factors. Body size, which includes both body mass and body area, account for about half of the variation in basal metabolism, meaning that an increase in body size results in a boost of basal metabolism (McArdle et al., 2015). Body composition and sex are also determinant factors. Since fat tissue has lower metabolic activity than muscle and women normally possess more body fat and less fat-free mass than men of similar size, women have lower energy expenditure than men (McArdle et al., 2015). Age is another extremely influential factor due to the energy cost of growth in children and young adults under the age of 20, that leads to a higher metabolic value (Levine, 2004; Levine et al., 2005; McArdle et al., 2015). Weather, body temperature, ethnicity, health, fitness status, hormonal status, smoking habits, and consumption of stimulant substances such as caffeine are factors that have also have an impact (McArdle et al., 2015).
Thermic effect of food (TEF)
Diet-induced thermogenesis represents the energy consumed in digestion, absorption, transport, metabolism, and storage of food. Thereby, food consumption generally increases energy metabolism and represents about 10% to 15% of the total daily energy expenditure (Levine, 2004; McArdle et al., 2015). The way the food is ingested, the quantity and type of
26
food consumed, the fractionation of the meals during the day, food temperature, and caffeine content affect energy metabolism (Stubbs et al., 2000). The type of macronutrients consumed also have a different impact on TEF (McArdle et al., 2015). Fat besides being the most caloric energy source with 9kcal per gram is also the macronutrient that has the least energy expenditure in its processing, affecting less than 5% of the total value of TEF (McArdle et al., 2015; Stubbs et al., 2000). Although proteins and carbohydrates both provide 4kcal per gram, protein has a major thermogenic value that can reach 30%, while carbohydrates contribute from 5% to 10% of TEF (McArdle et al., 2015; Owen et al., 2011; Tappy, 1996).
Activity-induced energy expenditure
Represents the thermic effect of any movement beyond basal metabolic rate and consists of exercise-related activity thermogenesis (planned, structured, and repetitive, which have an objective to improve or maintain one or more components of physical fitness) and non-exercise activity thermogenesis (includes the energy expenditure of occupation, leisure, sitting, standing, walking, talking, playing instruments, dancing, house cleaning, shopping, among others) (Levine, 2004). Due to the significant variations of the type of behavior adopted in a daily basis, oscillating between predominantly sedentary behaviors or quite active, it is the most variable component of energy expenditure within and between subjects contributing from 15% to 50% or more of total energy expenditure (Levine, 2004; Levine et al., 2005).
2.2. Sedentary behavior
Today’s environment has been influenced by the emergence of industrialization and technology evolution. Longer distances between places lead to a decline in walking and cycling due to the increase in car use and traffic. Labour-saving machines, poor neighbourhood facilities, recreation environment promoting sitting parks, technological devices and
screen-27
based entertainment (cinema, videogames, television) also contribute to an increase in sedentary time and consequently, a decrease in activity-induced energy expenditure (Chau et al., 2013; Lanningham-Foster, Nysse, & Levine, 2003; Thorp, Owen, Neuhaus, & Dunstan, 2011).
Sedentary behavior is defined by any waking behavior with relatively low energy expenditure, inferring a lack or absence of muscular contraction ≤1.5 MET while in a sitting or reclining posture (Dempsey, Owen, Biddle, & Dunstan, 2014; Tremblay et al., 2017). Time in sedentary behavior can be spent in domestic environments and leisure time (TV viewing and other recreational screen time), jobs that require prolonged sitting (screen-based jobs) and in transportation vehicles (Owen et al., 2011).
2.2.1. Epidemiology
It is estimated that people around the world spent, in average, 6.4 hours per day sitting in a range from 3.8 to 11.9 hours (Bauman, Petersen, Blond, Rangul, & Hardy, 2018). When stratifying to objectively measured methods that use motion sensing devices, such as accelerometers and inclinometers, to calculate precisely sedentary time, total sitting time increase 2 hours, with an average of 8.2 hours per day of sedentary behavior (Bauman et al., 2018). Studies also showed that, among adults, time spent sitting increased with age and higher education, and high rates of work-related sitting time. Contrarily, the time spent on television watching is higher among lower socio-economic groups and among older adults (Bauman et al., 2018).
Few studies have been conducted to measure sedentary behavior in older adults. However, a systematic review reported that, when objectively measured, 67% of the older population around the world were sedentary more than 8.5 hours per day (Harvey et al., 2013). Those go in accordance with The U.S. NHANES survey (Evenson, Buchner, & Morland, 2012)
28
and the Canadian Health Measures Survey (Copeland, Clarke, & Dogra, 2015) findings, which showed that older people spend 8.5 to 10 hours per day, respectively, on sedentary behavior.
Among 20 countries and according to self-reported data, Portugal manifest the lowest prevalence of sitting time, 76% of its total population reported spending less than 4 hours seated (Bauman et al., 2011). However, self-reported measures are less accurate, leading to an overestimation error. Thus, when measured with accelerometers, Portuguese adults total sitting time increased 5 hours, resulting in an alarming 9 hours of sedentary behavior (Baptista et al., 2012; Judice et al., 2015; Santos et al., 2018). Older adults are the most sedentary group in the population, and this is not an exception in Portugal. Portuguese elderly men spend over 10 hours seated, on average, which is 20 - 30 minutes more than an elderly woman (Baptista et al., 2012; Judice et al., 2015).
2.2.2. Sedentary behavior vs Physical Inactivity
The term ‘sedentary’ can sometimes, be mistaken with the term “inactive”, which is used to describe those who are performing insufficient amounts of PA defined by ACSM and AHA (Dempsey et al., 2014; Sedentary Behaviour Research, 2012). Nevertheless, sedentary lifestyle and PA can co-exist, a physically active individual, who fulfill the recommendations defined by ACSM, can also spend most of the day in sedentary behavior (Owen, Healy, Matthews, & Dunstan, 2010). Another pattern, less common, is a non-sedentary individual who barely spends time sitting, however, performs insufficient amounts of moderate and vigorous PA (MVPA) (Dempsey et al., 2014). Although MVPA appears to attenuate the risks of sedentary behavior, unrealistic levels of MVPA appear to be needed to completely eliminate the risks of large volumes of sedentary behavior (van der Ploeg & Hillsdon, 2017). In addition, since time spent in sustained MVPA represented only a small fraction of their waking time each day (± 2%), and individuals can spend the majority of their waking day sitting (± 63% of
29
their waking hours), variations in MVPA are not significantly associated with sitting or intermittent stepping time (Chau et al., 2013; Hamilton, Hamilton, & Zderic, 2014). For that reason, time spent sitting is distinct and not related to time spent performing sustained MVPA and regular exercisers are not necessarily less sedentary (Chau et al., 2013; Hamilton et al., 2014).
Therefore, the ideal behavior pattern for health outcomes is to fulfill the MVPA recommendations and lower sedentary time by often including low-intensity movements like standing and light walking to interrupt sedentary behavior, on a daily basis (Dempsey et al., 2014).
2.2.3. Generical effects on health
Despite the deleterious effects, daily sitting time seems to be attenuated in the presence of MVPA. There is building evidence showing that the chronic, unbroken periods of muscular inactivity associated with prolonged sitting time have consequences on several metabolic health outcomes (Chau et al., 2013; Katzmarzyk, Church, Craig, & Bouchard, 2009; van Uffelen et al., 2010). In this topic, the harms of sedentary behavior will be stratified according to the type of studies and research designs.
Evidence from observational studies
Three large prospective cohort studies with a follow up of 1.5, 8.5 and 9.5 years, reportedthat independent of age, sex, body mass index (BMI), education level, smoking status, alcohol consumption, total PA energy expenditure, medication, diabetes history, family history of CVD, and cancer, each additional hour of daily sitting time was associated with an increase in all-cause mortality, cardiovascular-related mortality, and other causes but not with cancer (Katzmarzyk et al., 2009; Matthews et al., 2012; Wijndaele et al., 2011). Even among
30
individuals reporting high levels of MVPA (more than seven hours per week), seven hours per day of sedentary behavior was associated with 50% greater risk of all-cause mortality and a twofold greater risk of cardiovascular mortality (Matthews et al., 2012).
A cross-sectional study used an accelerometer for 7 days in 169 adults to monitor the associations between the percentage of time spent sedentary, in light-intensity, and in MVPA with waist circumference, triglycerides, HDL cholesterol, resting blood pressure, fasting plasma glucose, and clustered metabolic risk score (Healy, Wijndaele, et al., 2008). These authors found that the cumulation of sedentary time and the manner in which it is accumulated may also be relevant for these health outcomes. While time spent sitting is related with metabolic risk, breaking up sedentary time is inversely associated with unhealthy outcomes and metabolic risk markers (Healy, Dunstan, et al., 2008; Healy, Wijndaele, et al., 2008; Judice et al., 2015).
Evidence from randomized controlled trial (RCT) studies
Most of the RCT studies on sedentarism were conducted to understand the effects of interrupting sitting time, with rarely or almost no studies in which the intervention consisted in an increase in sedentary behavior and/or a decrease in PA.
A recent experimental study fulfilled these requirements by performing an intervention with a short-term (14 days) reduction in PA and increased sedentary behavior, from a mean daily step count of >10,000 to 1500 steps a day. Their findings demonstrated a reversible reduction in multi-organ insulin sensitivity and cardiorespiratory fitness, with concomitant increases in central and liver fat and dyslipidemia (Bowden Davies et al., 2018). In older adults, two weeks of step reduction (daily steps ≤ 1000 steps) led to lowered rates of muscle protein synthesis and impaired glycaemic control that, unlike younger adults, was not recovered during the following 2 weeks of return to regular activity (McGlory et al., 2018).
31
Interventions breaking up sedentary behavior reported that increasing the short bouts of standing, light or moderate intensity walking lowers postprandial glucose, insulin levels, increased energy expenditure, and fat oxidation over an 8 h postprandial observation period (Dunstan et al., 2012; Hawari, Al-Shayji, Wilson, & Gill, 2016; Henson et al., 2016). However, compared with low-intensity exercise, moderate intensity exercise is more effective in reducing postprandial plasma triglycerides (I. Kim, Park, Trombold, & Coyle, 2014). This indicates that the frequency of interruptions, probably due to the increased energy expended with muscular contractions in the sit-to-stand and stand-to sit transitions, has a marked independent influence on metabolic rate (Hawari et al., 2016; Judice, Hamilton, Sardinha, Zderic, & Silva, 2016).
Evidence from the systematic reviews and meta-analysis studies
A considerable number of systematic reviews looking into observational studies indicate that sedentary time, independent of PA, is associated with an increased risk of weight gain, insulin resistance, cardiovascular disease, and all-cause mortality (Chau et al., 2013; Patterson et al., 2018; Thorp et al., 2011; Wilmot et al., 2012).
A threshold of 6 to 8 h/day of total sitting and 3 to 4 h/day of TV viewing, above which the risk for all-cause mortality is increased, were identified (Patterson et al., 2018). Due to its link to higher intakes of energy and macronutrients along with greater energy from snacks, TV viewing is proposed as the most deleterious sedentary behavior (Owen et al., 2010; Patterson et al., 2018).
Regardless of total sedentary time and the time spent in PA, people who interrupted their sedentary time more frequently (breakers) had a better metabolic profile than those whose sitting time was mostly uninterrupted (prolongers) (Benatti & Ried-Larsen, 2015; Groeneveld, Proper, van der Beek, Hildebrandt, & van Mechelen, 2010; Owen et al., 2010).
32
It was evaluated that 5.9% of deaths could be attributed to daily total sitting time, even with PA taken into account (Chau et al., 2013; Patterson et al., 2018). This value is similar to other major risk factors reported by the World Health Organization such as tobacco use (8.7%), physical inactivity (5.5%), and overweight and obesity (4.8%). It suggests that if daily sitting time would be reduced, the beneficial effect on population health could be comparable to that achieved by reducing smoking, inactivity, or obesity (Chau et al., 2013). Therefore, considering the adverse health outcomes, sedentary behavior is indicated as a distinct and independent health risk factor.
2.3. Physical inactivity and detraining
Exercise, despite being used interchangeably with PA, is a subcategory of it that assumes planned, structured and repetitive PA, which have a goal to improve or maintain one or more components of physical fitness (Caspersen, Powell, & Christenson, 1985). To improve health, lower susceptibility to disease (morbidity), and decrease premature mortality, ACSM/AHA recommends a weekly accumulation of at least 150 min of moderate-intensity aerobic activity (3.0 to 5.9 MET’s), 75 min of vigorous PA (≥6.0 MET’s) or a combination of both (American College of Sports, Riebe, Ehrman, Liguori, & Magal, 2018). Additionally, regular PA is one of the main determinants of energy expenditure and is therefore fundamental to energy balance, weight control and obesity prevention (World Health Organization, 2014). In contrast, as mentioned above, the term physically inactive is used to describe those who are performing insufficient amounts of PA defined by the ACSM, while detraining is the partial or complete loss of training-induced anatomical, physiological, and performance adaptations as a consequence of training reduction or cessation (Dempsey et al., 2014; Mujika & Padilla, 2000).
33
2.3.1. Epidemiology
Insufficient PA is one of the 10 leading risk factors for global mortality, responsible for 3.2 million deaths each year (Lim et al., 2012). Compared with those who comply with PA recommendations, insufficiently active adults have a 20−30% increased risk of all-cause mortality (Lee et al., 2012).Worldwide, is estimated that physical inactivity is responsible for 6% of the burden of disease from coronary heart disease, 7% of type 2 diabetes, 10% of breast cancer, and 10% of colon cancer (Lee et al., 2012).
The WHO reported that in 2010, women worldwide were less active than men, about 27% of women versus 20% of men did not reach the recommended level of activity. Insufficient PA in adults increased according to the level of country income and age, with 19% of the youngest age group not meeting the recommendations, compared to 55% of the oldest age group (World Health Organization, 2014).
According to the Eurobarometer survey on sport and PA, based on about 68% of the population, Portugal is one of the three countries most likely to never exercise or play sport in Europe. Just as reported by the WHO, Portuguese women are less active than men, 78% versus 68% and the levels of PA also decrease with age (European Commission, 2017). Considering that the ideal behavior pattern for health outcomes is low levels of sedentary time, and fulfillment of PA recommendations, Portugal’s alarming levels of physical inactivity and sedentarism can lead to adverse health and economic burden.
2.3.2. Effects of short-term detraining
The changes caused by training cessation or insufficient training differ according to their duration. In this way, detraining is divided by short-term when it has less than 4 weeks of insufficient training stimulus and long-term when lasts more than 4 weeks (Mujika & Padilla,
34
2000). Given the short duration of the detraining in the present investigation, this section will focus on the consequences of short-term detraining.
Effects on cardiorespiratory capacity
Maximal oxygen uptake (VO2max), although suffers greater changes in the long term,
has been shown to decline with short term detraining, depending on the physical activities performed during that time (Ehsani & Spina, 1997; Mujika & Padilla, 2000). There are several references that reported a decrease in VO2max between 4 and 14% with short term detraining
(Coyle et al., 1984; García-Pallarés, Carrasco, Díaz, & Sánchez-Medina, 2009; Houmard et al., 1992; Houmard et al., 1993), with this change ever more noticeable in older adults (Lobo, Carvalho, & Santos, 2010; Toraman, 2005). In the short term detraining, as a result of a loss in both red cell volume and plasma volume (Mujika & Padilla, 2000), blood volume decreases by 5 to 12% (Ehsani & Spina, 1997; García-Pallarés et al., 2009; Houmard et al., 1992). This blood volume reduction makes heart rate increase about 5% to 10% at submaximal and maximal intensities and, when combined with the decrease in left ventricular wall thickness induced by detraining, reduces stroke volume up to 17% (Coyle, Hemmert, & Coggan, 1986; Martin, Coyle, Bloomfield, & Ehsani, 1986; Pedlar et al., 2018). Cardiac output, in turn, is the product between heart rate and stroke volume, and despite the rise in heart rate values resulting from cardiovascular detraining, it does not seem to be enough to counterbalance the reduction in stroke volume, causing a reduction of cardiac output (García-Pallarés et al., 2009). It was also shown a rapid deterioration of ventilatory function characterized by a decline in maximal ventilatory volume, which often declines in parallel with VO2max and O2 pulse - the amount of
oxygen consumed in ml/systole (Ghosh, Paliwal, Sam, & Ahuja, 1987; Mujika & Padilla, 2000).
35
Muscular effects
Capillary density, as VO2max, is more affected by long term detraining and, in the short
term, its reductions are small or even non-existent (Mujika & Padilla, 2000). Muscle fiber distribution in resistance athletes is also not affected in the short term (Neufer, Costill, Fielding, Flynn, & Kirwan, 1987). However, muscle cross-sectional area derived from muscle hypertrophy, declines in strength and speed athletes, due to the reduction in type 2 fibers area and also by the neural and muscular adaptations caused by the inactivity (Häkkinen & Komi, 1983; Staron et al., 1991). There is a trend for a more significant difference in strength after detraining in older adults (Hakkinen, Alen, Kallinen, Newton, & Kraemer, 2000; Kalapotharakos, Diamantopoulos, & Tokmakidis, 2010).
Mitochondrial ATP production and muscle glycogen concentration, in turn, are variables that reduce significantly in the short term (Wibom et al., 1992). In isometric and isokinetic concentric strength, there are no differences on the bench press, squat, and leg extension in short term detraining (Hortobagyi et al., 1993). On the other hand, electromyogram activity and isokinetic eccentric strength are reported to decline at a much higher rate (Hortobagyi et al., 1993).
Metabolic effects
At the metabolic level, short periods of insufficient training are associated with increased RQ at submaximal and maximal exercise intensities, which indicates a higher reliance on carbohydrate as a substrate for exercising muscles (Mujika & Padilla, 2000, 2001). Despite no difference in resting and fasting RQ with detraining, a seven-day bed rest study showed a significant increase in fasting RQ that manifest lower lipid oxidation (Blanc et al., 2000). Inactivity decreases rapidly sensitivity for insulin-mediated whole-body glucose uptake (Mujika & Padilla, 2000; Vukovich et al., 1996). This decline may be associated with a reduced
36
muscle GLUT4 transporter protein content, which has been shown to decrease by 17 to 33% after 6 to 10 days (Mujika & Padilla, 2000; Vukovich et al., 1996). On the other hand, short-term training cessation from endurance training has been shown to yield a condition that favors the storage of adipose tissue, due to a marked increase in adipose tissue lipoprotein lipase activity, coupled with a marked decrease in muscle lipoprotein lipase activity (Mujika & Padilla, 2000, 2001).
2.4. Sedentary behavior, physical inactivity, detraining, and metabolic flexibility As mentioned previously, physical inactivity and sedentary behavior have several adverse health effects and should be considered as independent risk factors. But, although their risks are independent of each other, the mechanisms by which they are related to metabolic impairment and consequently to metabolic inflexibility are similar. Some bed-rest, increased sedentary behavior, reduced PA, and detraining studies have been conducted to evaluate their effects on metabolic profiles.
An RCT with forty-five habitually active participants demonstrate that a 14-day reduction in PA with increased sedentary behavior leads to a reversible reduction in multi-organ insulin sensitivity and cardiorespiratory fitness, with concomitant increases in central and liver fat and dyslipidemia (Bowden Davies et al., 2018). Another RCT with 44 participants showed that both a reduction in spontaneous and structured PA for one month decreased the variance in daily RQ and increased that of insulin, which suggests a decrease in MF (Bergouignan et al., 2013). This is consistent with the findings from a systematic review from bed-rest studies which reported that the variances of insulin and RQ are inversely but linearly associated along a PA continuum (Bergouignan et al., 2011).
In conclusion, regardless of energy balance conditions, the reduction of PA levels along with increased sedentary behavior can lead to muscle atrophy due to the decreased mechanical
37
workload. An increased reliance on carbohydrate as an energy substrate with a decrease in fat oxidation and an accumulation of lipid in ectopic tissues associated with an increase in plasma insulin concentration or a decrease in insulin action may also be a consequence of a reduction of PA (Bergouignan et al., 2013; Corpeleijn et al., 2009; Stein & Wade, 2005). These may be the explanatory metabolic mechanisms induced by prolonged inactive periods that explain how sedentary behavior and physical inactivity can induce metabolic inflexibility.
3. Determinant factors of metabolic flexibility
After explaining the impact of lifestyle on MF, we will address the intrinsic physiological factors related to it, which include insulin sensitivity, the capacity to store and release FFA from adipose tissue, mitochondrial oxidative capacity, and skeletal muscle fiber type.
3.1. Insulin
Insulin is an anabolic hormone secreted by the beta-cells of the pancreas driven by the rising of blood glucose after a carbohydrate-rich meal (Czech, 2017; Storlien, Oakes, & Kelley, 2004). Insulin secretion has the purpose of maintaining normal blood glucose levels by facilitating cellular uptake into muscle and adipose tissue through insulin sensitive regulator glucose transporter protein 4 (GLUT4), boosting glycolysis and glycogen synthesis (Czech, 2017; Wilcox, 2005). It is the main hormone that regulates cellular energy supply, macronutrient balance, and directs anabolic processes during fed condition (Wilcox, 2005).
Insulin, glucose disposal rate, and metabolic flexibility
Glucose is the main stimulus for insulin secretion, although other factors as macronutrients, hormones, humoral factors, and neural input may alter its response (Wilcox,
38
2005). Considering its role as intra-cellular transporter of glucose into insulin-dependent tissue, such as muscle and adipose tissue, insulin release after a meal is the main driver of substrate utilization change from predominantly oxidative fatty acid metabolism to glucose oxidation in the skeletal muscle (Goodpaster & Sparks, 2017; Wilcox, 2005).
During fasting, insulin and glucose levels are low, and muscles rely on fatty acids and amino acids utilization as their main energy source. When a meal is consumed, exogenous energy is provided through the macronutrients contained in foods, causing adipose tissue fat breakdown suppression and its synthesis promotion (Wilcox, 2005). The change from fasting to feeding allows glucose entry to muscle cells causing glycogen to be synthesized and stored, which enables the use of carbohydrates as the main source of immediately available energy, instead of fatty acids or amino acids (Wilcox, 2005). In the fed state, insulin promotes glycogen and lipid synthesis in muscle cells and suppress lipolysis and gluconeogenesis from muscle amino acids (Wilcox, 2005). This allows the use of glucose or glycogen as energy to be released via glycolysis during a glycolytic or oxidative muscular activity (Wilcox, 2005). Therefore, insulin, due to its function of glucose uptake, plays a key role in glucose metabolism.
Small changes in insulin in response to a meal are associated with a metabolically flexible state, whereas a metabolically inflexible person is characterized by a low amplitude in RQ marked by a large variance in insulin, with the variance in plasma insulin concentration has a major influence on MF (Rynders et al., 2017).
These large changes in insulin variance, which characterize an individual as metabolically inflexible, are related to insulin sensitivity impairment, better described as insulin resistance. Individuals are characterized as insulin resistant when they have type 2 diabetes or they are at risk of developing the disease.Insulin resistance is defined as a decrease of the target cell’s metabolic response to the hormone, at the whole-body level, an impaired sensitivity to insulin in which cellular glucose uptake is decreased and cellular glucose
39
available for oxidation is low (Wilcox, 2005). This leads to an untypical rise in blood glucose levels, thus increasing insulin secretion by beta-cells (Czech, 2017). In insulin-resistant individuals, impaired glucose storage is expected, since increased insulin secretion enhances blood insulin concentration, causing large variance in postprandial insulin levels that along with a slight variance in RQ typically describe metabolic inflexibility (Galgani, Moro, et al., 2008).
Therefore, metabolic inflexibility in insulin-resistant patients is not explained by a primary impairment in glucose oxidation but instead the consequence of impaired glucose transport (Galgani, Moro, et al., 2008).
Insulin response to a meal
Glucose is the main driver to insulin secretion, however, it is also dependent on the relative proportions of macronutrients, the physical form in which the foods are ingested, and those factors influencing response to oral glucose alone (Wilcox, 2005).
Insulin response hinges on the glycaemic index of the food. When a food with a low glycaemic index is consumed, the rate of insulin secretion tends to be lower and digestion and the conversion to glucose requires more time (Wilcox, 2005). Although carbohydrate is the principal factor influencing glycaemic response to a meal, the addition of fat and protein to carbohydrate is positively associated with lowering glycaemic response (Moghaddam, Vogt, & Wolever, 2006). Therefore, in insulin-sensitive persons, the higher the fat and protein added to a carbohydrate meal, the lower will be the blood glucose concentration peak and consequently the insulin response (Ercan, Gannon, & Nuttall, 1994; Hollenbeck, Coulston, & Reaven, 1988; Moghaddam et al., 2006; Wilcox, 2005).
40
3.2. Free Fat Acids (FFA)
Free fatty acids are the vehicle by which triacylglycerol stored in adipose tissue is transported to its sites of utilization (Karpe, Dickmann, & Frayn, 2011). Plasma FFA plays an important role as the primary energy source for liver, pancreas, the resting state of skeletal muscle, and myocardium (Boden & Shulman, 2002). However, increased consumption of high-fat, energy-dense diets, particularly rich in saturated fatty acids, tend to be associated with insulin resistance and other metabolic diseases (Manco, Calvani, & Mingrone, 2004; Wilcox, 2005).
The excessive intake of lipids leads to a rise in plasma FFA concentration and an accumulation of triglycerides in many tissues, particularly in the adipose tissue (Manco et al., 2004). High plasma FFA concentration drives the enhanced lipid fuel oxidation, which impairs insulin-stimulated glucose disposal rate and decreases intracellular glucose (Galgani, Moro, et al., 2008). Additionally, fat cells do not have an unlimited capacity to expand and the over-expansion of existing fat cells creates inflammation. This, leads to insulin resistance within the fat cell, resulting in a net spillover of FFA to non-adipose tissues such as muscle, liver, and pancreas, which are unable to safely store large amounts of fat (Manco et al., 2004; Sears & Perry, 2015). Consequently, the development of lipotoxicity begins, which is the excess of lipid accumulation in the non-adipose tissue that leads to the real metabolic consequences of insulin resistance (Sears & Perry, 2015).
3.3. Mitochondrial oxidative capacity
Mitochondria is an organelle present in almost all eukaryotic cells that, besides having a central role in the execution of diverse cellular events, is responsible for cellular energy production (Boudina & Graham, 2014; McBride, Neuspiel, & Wasiak, 2006; Osellame, Blacker, & Duchen, 2012). Mitochondria, through ß-oxidation and the Krebs cycle, transforms
41
metabolic intermediates such as pyruvate, fatty acids, and amino acids into the reduced energetic equivalents NADH and/or FADH2 (Smith et al., 2018).
Since it regulates glucose metabolism and fatty acid oxidation in most cell types, mitochondria fulfill a crucial role in determining cellular, tissue, and systemic MF (Smith et al., 2018). Nevertheless, despite the evidence indicating mitochondrial defects as a driving factor to insulin resistance and consequently metabolic inflexibility, the causal link between the two remains to be fully established (Galgani, Moro, et al., 2008; Karpe et al., 2011). Even though the reduction in mitochondrial oxidative capacity is linked to the development of obesity and type 2 diabetes mellitus, exercise, by increasing the number and density of mitochondria, is related to a better MF and insulin sensitivity (Muoio, 2014; Smith et al., 2018).
3.4. Skeletal muscle
Skeletal muscle represents the body’s largest organ mass, however, at rest it has a low metabolic rate per mass unit compared with other organs, contributing for 40% to 50% of the variability in whole-body metabolic rate (Zurlo, Nemeth, Choksi, Sesodia, & Ravussin, 1994). Skeletal muscle, oxidative or glycolytic, responds differently to fatty acids or glucose consumption. Oxidative fibers have more mitochondria and a higher concentration of oxidative enzymes, allowing to have a higher rate of fat oxidation compared with glycolytic fibers (Galgani, Moro, et al., 2008). Oxidative capacity of skeletal muscle may be essential to boost lipid oxidation to the level of lipid supply, plus if skeletal muscle cannot match lipid oxidation to fat uptake, it will lead to lipid accumulation, which in turn will cause insulin resistance as previously explained (Galgani, Moro, et al., 2008). The greater the percentage of oxidative fibers the higher will be the rate of fat oxidation, preventing insulin resistance. Consequently, insulin sensitivity can also be modulated by the oxidative capacity of skeletal muscle (Galgani, Moro, et al., 2008).