Working Paper: Nº 27/2019 Madrid, July 2019
Life Cycle Saving and Dissaving
Revisited across Three-tiered Income
Groups:
Starting hypotheses, refinement
through literature review, and ideas
for empirical testing
Robert Holzmann, Mercedes Ayuso and
Jorge Bravo
Document nº 27 – Papers Mi Jubilación
Life Cycle Saving and Dissaving Revisited across Three-tiered Income Groups: Starting hypotheses,
refinement through literature review, and ideas for empirical testing – 2
ndquarter 2019
Mercedes Ayuso: Full professor in Actuarial Statistics at University of Barcelona (Department of
Econometrics, Statistics and Spanish Economy, Riskcenter-UB). Director of the Master in
Management of Insurance and Financial Organizations at University of Barcelona.
Jorge Miguel Bravo: Professor of Economics at University of Évora, Invited Professor at Nova
University of Lisbon - ISEGI and at Université Paris-Dauphine (Paris IX), Coordinator of ORBio -
Observatory of Biometrical Risk of Portuguese of Insured Population, Portuguese Insurers
Association.
Robert Holzmann: Professor of Economics and Chair, Old-age Financial Protection, University of
Malaya (Kuala Lumpur); Honorary Chair, Centre of Excellence in Population Ageing Research,
University of New South Wales (Sydney); Research Fellow of IZA (Bonn) and CESifo (Munich), and
Fellow of the Austrian Academy of Science (Vienna).
The views and conclusions cannot be attributed to any institution with which we are associated, and
all remaining errors are our responsibility.
Members of the Experts Forum of the Instituto BBVA de Pensiones
Madrid, July 2019
Code
D14, D15, D19
Keywords
Intertemporal Household Choice; Life Cycle Models and Saving, Household Behavior and Family
Economics, Household Saving; Personal Finance
Abstract
The lifecycle approach is the workhorse to model saving decisions of individuals. It conjectures individuals preferring a constant consumption stream across their lifecycle saving till retirement and dis-saving thereafter. The reality is often at odd with this assumption giving rise to our conjectured three-tier life-cycle model by income groups. The low-income tier does little saving and in consequence little dissaving; the high-income tier does save during active life and profits often from bequests, but no dissaving is taking place unless hit by a major shock; only the middle tier behaves broadly as predicted. The drivers for such a differentiated behavior are conjectured to be threefold: External settings such as a multitude of shocks; preferences deviations such a behavioral bias, and institutional settings and interventions, such as minimum income provisions. The paper outlines these corresponding hypotheses, presents some first conceptual and empirical support, and reviews the international literature on the conjectured drivers. The review of international literature does not shatter our conjecture of a broadly three-tiered and reframed applicability of the life cycle model but offers some first precisions and wrinkles. The paper proposes next conceptual and empirical steps, including enriching existing wealth distribution estimates at retirement with sound estimates of social insurance wealth (pension and health), focused hypothesis testing of the key drivers with household panel data, and formulating policy responses if the new hypotheses are not rejected.
Index
1. Introducción: motivación, enfoque y estructura ... 5
2. Descripción de hipótesis clave ...7
3. Revisión y resumen de la bibliografía internacional sobre acumulación y
desacumulación durante el ciclo de vida ... 17
4. Perfeccionamiento y reorientación de la hipótesis de tres capas del ciclo de
vida ... 26
5. Próximos pasos propuestos ... 27
Referencias ...
¡Error! Marcador no definido.
1. Introduction: Motivation, approach and structure
The lifecycle approach is the workhorse to model saving decisions of individuals for most economists and related disciplines. It assumes that individuals optimize their consumption over their active and retirement period. In order to perform lifecycle redistribution and smooth consumption over the lifecycle, the model assumes that individuals accumulate financial and non-financial assets till retirement, and draw down (decumulate) their wealth thereafter till death. To address the uncertainty of death the model strongly suggests that the purchase of a life annuity at retirement is the optimal financial decision for individuals. A bequest motive can be added so that individuals leave a share of their life-time wealth for family members or other purposes, yet this leaves the basic results essentially unchanged. If individuals are mandated to contribute to public or occupation pension schemes, then the individual voluntary saving covers the difference. If this difference were to be negative (as the mandated saving is too high), the individual would borrow under perfect financial market conditions toward their future pensions to allow for his or her optimal (smooth) consumption plan. Adding family members changes the optimal consumption profile, but the saving and dissaving path that peaks at retirement remains essentially unchanged. The rising empirical evidence on actual saving/dissaving behavior before and after retirement is often at odds with these predictions. This applies to the rich economies of OECD and – as to be expected even more so – to low and middle income countries1 The evidence for well-to-to countries across the world suggests low financial saving for the lower income share of the population during their lifetime. The wealth distribution is highly unequal in the population – not only due to different life cycle stages - as it should -, but also at equal ages. High income individuals seem to continue often their wealth accumulation at higher ages. Besides the mechanical reduction of the social security wealth in retirement there is often limited evidence of a reduction in personal financial wealth, even less so in property wealth. There may be many reasons for such observed behavior: Differences in preferences for consumption, saving and bequest before and after retirement, differences in the exposure to shocks individuals cannot insure against, differences in access to financial market institutions and knowledge about them, differences in many socio-economic characteristics, and much more.
The cursory empirical evidence seems consistent with the following basic hypotheses about actual life-cycle saving and dissaving. Simply put, there are three tiers of the population that exhibit the following well differentiated saving/dissaving behavior:
The lowest tier does little or even no saving and – by consequence - little dissaving after retirement. They consume their period earnings, and when older they either live on their low pension (including social pension) and/or continue working. They had few or no good opportunities or incentives for a major saving effort. If it happened voluntarily it was toward their (modest) housing. In consequence, they typically arrive at retirement age with cash and financial savings equivalent to only a few months of consumption spending and fewer with limited illiquid housing assets.
The highest tier does little or no dissaving. On the contrary, they continue the accumulation of financial and non-financial asset. The only dissaving that takes place is through their public or private annuity, if they have one, which finances part of their old-age consumption. If they do dis-save it is linked with a major financial shock they are exposed to, with the major ones being a health shock after retirement due to special and uninsured diseases, an expensive divorce, long-term care expenditure, and for some also the effects of war,
1The differences in accumulation and decumulation across countries of different development level are well documented int the transfer account approach (See Lee and Mason 2011). Transfer accounts are a summary tool of how money is transferred between generations - private or public - which has fundamental implications for household savings decisions in general throughout all economies. This paper is
natural catastrophes, or failed speculative investments. Some may reduce their asset holdings through inter-vivo transfers or bequests, including the establishment of tax-saving foundations.
The middle tier is the only one that shows aspects of life-cycle saving and dissaving. In addition to mandated retirement provisions it acquires financial and non-financial assets that peak around retirement from the labor market. With retirement their pension wealth decreases but their financial and other wealth moves little. In contrast to the richer population tier it does not increase during retirement but as for the richer tier the wealth size is vulnerable to shocks. If it decreases otherwise, it is slow and at death comprises in most cases the property they had at the start of retirement and a reduced financial wealth. For those without life annuities, the reduction of financial assets is larger but the total wealth reduction may overall be smaller.
The tiers are likely not of equal size, and their relative magnitude is so far unknown, but the three-tier notion serves to frame and focus the discussion.
If the three-tier hypothesis were to be broadly correct, this would have main implications for public policy making and the supply of financial instruments by the private sector. The details will depend on the relevance and type of shocks hypothesized above. For instance, if the fear of high and protracted long-term care expenditure is the main reason for a lack of dissaving, then mandated public or private cash or service provisions, perhaps linked to retirement assets, may prove highly welfare enhancing. The empirical results have also a bearing on the role of housing during the life cycle as an instrument of saving and consumption smoothing, and the role of government and financial markets. The results will also inform the design of taxing contributions/saving, returns and/or disbursements/decumulations in order to minimize distortions while avoiding intra- and intertemporal unfairness across individuals.
The correctness of the hypothesis may also be important for fiscal and financial policy. For example, the dissaving profile at higher ages or the lack of it may strengthen the argument for a frontloading of taxation under consumption-type income tax (i.e. saving out of taxed income and no more taxation on decumulations). The observed increasing bequest transfer by the baby-boom generation to their heirs has seemingly effects in some countries (such as Japan) on the liquidation of some asset categories, the composition of asset holdings and the dynamics of asset prices and financial stability.
To establish the empirical basis and draw innovative and relevant policy conclusions the structure of the research program is as follows.
A first set of Sections aims to develop the hypothesis to be tested. To this end it proceeds along the following structure: Section 2 elaborates on the key hypotheses and suggests a metric for the assets at retirement and the income, consumption and saving profile before and after retirement in order to better gauge the conjectured three tiers of life-cycle (LC) manifestation. The section offers also three brief sets of explanation on why the behavioral deviation takes place. Section 3 reviews and summarizes the related/specific international literature in order to assess how much the preliminary hypothesis are supported or need to be adjusted. Section 4 reviews and focuses the hypothesis against the findings from the literature review. A closing Section summarizes the findings and outlines the envisaged next empirical steps. Sections 1 to 5 are planned to be presented in a first working paper to allow for early feedback and corrections.
A new set of Sections in a future and next paper will present the empirical testing of the hypothesis. To this end a first Section will outline the hypothesis to be tested. A second Section will present the collected, accessed and finally selected international data sets (such as SHARE, LIS, etc). A third Section will present the econometric results of the hypothesis testing. And a fourth Section will launch a battery of testing tools on the results in order to increase the confidence in the conclusions and policy recommendations drawn separately. Last but not least, a further Section will outline key policy implications of the hypothesis supported by the empirical results while a final Section will offer a summary, conclusions and next steps.
2. Outlining key hypotheses
The cycle hypothesis suggests that individuals plan their consumption and savings behavior over their life-cycle: From early education expenditure to post retirement dis-savings decisions. It conjectures that individuals intend to even out their consumption in the best possible manner over their entire lifetimes, doing so by accumulating assets when they work and earn and dis-saving these assets when they are retired from the labor market and without earnings. In its simplest form it predicts that individuals accumulate financial and non-financial assets till retirement through consumptions below earnings and other income - i.e. they save - and then decumulate these assets till their death, i.e., they dissave. The life-cycle theory was initiated by Modilgliani and Brumberg in the early 1950s and forms nowadays a basic pillar in economic theory and policy design (see Deaton 2005, for an overview and further literature hints).
This section explores key hypotheses that are consistent with the conjectures of a three-tiered life-cycle hypothesis (LCH) relevance: No or little relevance of the traditional LC hypothesis for the lowest and highest income/asset group; it is only relevant for the middle income/asset group. The triage and presentation fertilize also the structure and priorities for the literature review in the next section. It starts out with a Sub-Section that outlines how any measures of comparing consumption path before retirement, accumulations at retirement, and consumption path thereafter will depend on the institutions that are considered during the life-cycle planning even when abstracting from market imperfections. It should result in a first gauge of the magnitudes that may be used to identify under-saving for the first tier and over-saving for the third tier. A second Subsection then outlines key circumstances that are conjectured to lead to the stark deviation from LCH behavior for the first and third tier.
2.1 LCH, flows in income, consumption and saving, and asset levels at retirement
To develop our main points that the size and dependency of measured wealth at retirement compared to consumption flows depends on institutional circumstances, we use very simple LC tables that we populate with numbers that may be given real life value (in thousand Euros). Note that the different flows as they are illustrated from tables 2.1 to 2.5 are shown in figure 1. This should facilitate the understanding.
Figure 1. Wealth at retirement compared to consumption flows
Source: Authors’ elaboration
Life cycle flows Basic scenario (table 2.1) With mandated pension scheme (table 2.2) With housing accumulation and decumulation (table 2.3) With back-loaded healt care consumption (table 2.4) With back-loaded pension taxation (table 2.5a) With front-loaded pension taxation (table 2.5b)
A first key assumption is the span of active life compared to life in retirement. We assume 45 years of activity and saving compared to 15 years of inactivity and dis-saving with a retirement age of 65. We aggregate the timeline in periods of 15 years each. Lower years of activity mixed with high years of retirement (say 40 and 20) would increase the scope of accumulation at retirement but leave the key lessons unchanged.
With a constant-period income of 400k (i.e. in 1000, corresponding to a yearly income of 26.667 say Euro), the welfare-maximizing constant consumption path per period is 300, also in retirement. This delivers a ratio of wealth at retirement to life-time wealth of 25 percent (Table 2.1). For simplicity we abstract from wage growth/interest rate (i.e. we keep them identical at zero).
Table 2.1: Life-cycle flows – basic scenario
Period/ Variables A1 A2 A3 R Total Wealth at retirement Y 400 400 400 0 1200 C 300 300 300 300 1200 S Financial 100 100 100 -300 0 300
With period variables Y: earnings, C: consumption, and S: savings.
Introducing a mandated (public) pension scheme that claims contributions A during active periods and pays benefits B during retirement retains the financial saving as the control instrument that keeps the consumption profile constant (Table 2.2). For measuring both public pension and (voluntary) savings wealth need to be aggregated and compared. The wealth-at-retirement to total life-time wealth ratio remains unchanged at 25 percent.
Tabl2 2.2: Life-cycle flows – with mandated pension scheme
Period/
Variables A1 A2 A3 R Total retirement Wealth at
Y 400 400 400 0 1200
C 300 300 300 300 1200
A/B 60 60 60 -180 0 300
S Financial 40 40 40 -120 0
With period variables Y: earnings, C: consumption, A/B: contributions to a mandated (public) pension scheme related to benefits during retirement and S: savings.
La vivienda juega un doble papel: proporciona servicios/ingresos imputados (función de consumo), al tiempo que sirve también como activo no financiero (función de inversión). Asumimos que los costes de vivienda equivalen a un 20 por ciento de los gastos del ejercicio, de los cuales un 5 por ciento corresponden a gastos de gestión y un 15 por ciento a servicios de la vivienda. En una economía plenamente competitiva, los particulares deberían poder optar de manera indiferente a la compra o al alquiler (con un valor total de servicios de vivienda igual al precio de vivienda que coincide con la deuda por vivienda). La tabla 2.3 traduce esto en flujos durante los ejercicios. El patrimonio total en el momento de la jubilación se reduce a 240, mientras que los ingresos y el consumo totales aumentan a 1440. Sin asignación de ingresos por vivienda, la relación de riqueza para la jubilación (240) respecto a los ingresos totales (1200) sería del 20 por ciento.
Table 2.3: Flujos del ciclo de vida: con acumulación/desacumulación de vivienda Period/ Variables A1 A2 A3 R Total Wealth at retirement B 400 400 400 0 1200 Y Housing 60 60 60 60 240 C 300 300 300 300 1200 S Housing 80 80 80 0 240 S Financial 80 80 80 -240 240
With period variables Y: earnings, Y Housing: housing earnings; C: consumption; S: savings (housing and financial).
Not all consumption is distributed equally across periods. Health services (including long-term care) are typically back-loaded with most of the consumption happening during retirement. We introduce a net health service consumption profile for health services, i.e., contributions net of health services in Table 2.4. The retirement consumption in health services is thus fully prepaid. If there is no health consumption during any active period, this amounts to a health consumption of 240 in the retirement period or a notional asset of this amount as it has been pre-paid. In consequence the ratio of wealth can be put at 20 percent (240/1200) or at 40 percent (480/1200).
Table 2.4: Life-cycle flows – with back-loaded health care consumption
Period/ Variables A1 A2 A3 R Total Wealth at retirement B 400 400 400 0 1200 C Salud -60 -60 -60 +180 240 C 240 240 240 240 960 S Financial 80 80 80 -240 0 240 (o 480)
With period variables Y: earnings, C Health: consumption in health services (for retirement); C: consumption; S: savings.
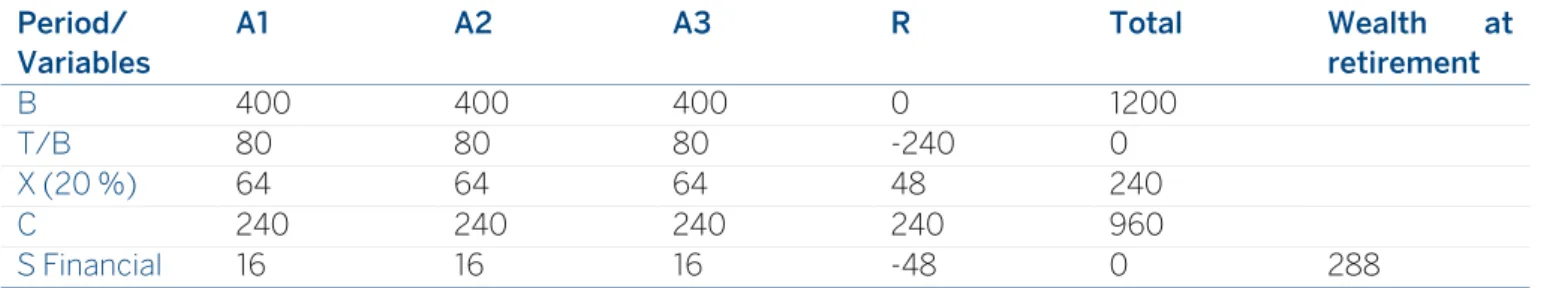
Furthermore, taxes are levied on income, including on savings/contributions, returns (ignored in our examples) and benefits depending on whether a consumption-type treatment of retirement saving is back or front-loaded. This has also a bearing on the scope of retirement wealth compared to total wealth Table 2.5a. We assume that the rate for the normal tax on earnings and pensions is 20 percent and for simplification (or assumption of consumption tax treatment) financial savings remains untaxed. In our example the public pension finances the consumption and the financial savings the income tax on the pension benefit. As a result, the total wealth at retirement amounts to 24 percent of life-time wealth (288/1200).
Table 2.5a: Life-cycle flows – with back-loaded pension taxation Period/ Variables A1 A2 A3 R Total Wealth at retirement B 400 400 400 0 1200 T/B 80 80 80 -240 0 X (20 %) 64 64 64 48 240 C 240 240 240 240 960 S Financial 16 16 16 -48 0 288
With period variables Y: earnings, T/B: tipo impositivo normal sobre pensiones, X: tipo impositivo normal sobre ingresos, C: consumption; S: savings.
The front-loading of pension taxation (i.e. contributions are not tax-exempt and benefits disbursed are untaxed) does not change consumption profile but reduces the amount that needs to be saved to pay for benefit taxation. As a result, the total wealth at retirement amounts is again 20 percent of total income, and the financial saving is zero.
Tabla 2.5b: Life-cycle flows – with front-loaded pension taxation
Period/
Variables A1 A2 A3 R Total Wealth at retirement
B 400 400 400 0 1200
T/B 80 80 80 -240 0 240
X (20 %) 80 80 80 0 240
C 240 240 240 240 960
S Financial 0 0 0 0 0 0
With period variables Y: earnings, T/B: tipo impositivo normal sobre pensiones, X: tipo impositivo normal sobre ingresos, C: consumption; S: savings.
Putting all the different assumptions into one LC calculation will tend to reduce the share of total income that needs to be pre-saved to pay for the retirement consumption. To the extent that government finances part of the retirement consumption through cash and services annuities it reduces the need for individual pre-saving. This will also tend to reduce the pre-saving/retirement wealth compared to total income for the lower income groups. These numerical examples also offer some first magnitudes of the scope of wealth at retirement compared to total/life time income and post retirement consumption possibilities that need to be refined before being tested. For example, the target replacement rate is typically well below 100 percent to take account of no further retirement saving needed, lower direct expenses in retirement (such as work-related expenses that are not compensated), etc. This reduces the accumulation requirements compared to pre-retirement consumption once health service annuities are considered.
All the considerations so far are based on assumptions of full information and competitive markets to define a benchmark to be compared with. The details for a testable benchmark are presented in Section 4. Before we start the literature review in Section 3 we present next key channels why a deviation from LC planning may take place to explain the conjectured three-tiered population set-up.
2.2 Key deviations from the LCH: Explorations of reasons
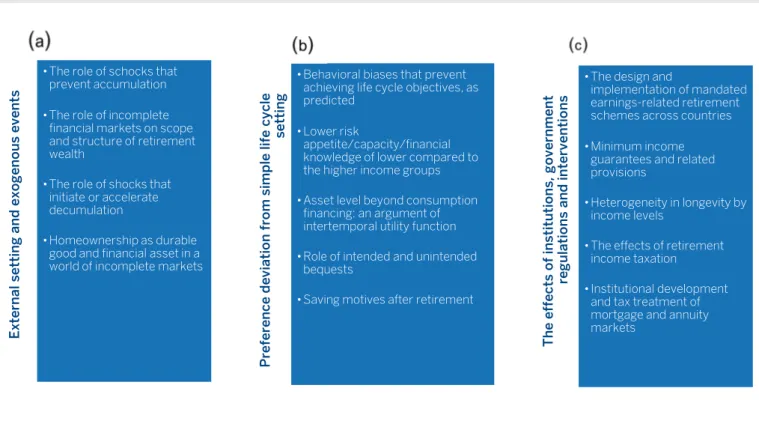
There are several key conjectures why a deviation from the LCH may take place. The main reasons can be grouped around (a) exogenous events/shocks and the lack of an enabling environment that make the deviation rationale; (b) preference deviation from the traditional life cycle setting/assumptions and other deviations from homo economicus, and (c) the effects of government regulations and interventions. This Section sketches the key ideas (Figure 2) which each end with short conjectures while the related Section 3.2 further below offers the brief literature review.
Figure 2. Key deviations from the LCH: main reasons
Source: Authors’ elaboration
a. External setting and exogenous events (i) The role of shocks that prevent accumulation
A key necessary condition to save for retirement is a remunerated and best formal sector job (or for a selected few relevant-sized inheritance or up-ward marriage). Unemployment shocks hit more frequently and often for a longer period the lower income groups that have furthermore more often irregular work opportunities only (Khatiwada and Sum, 2016; Sum and Khatiwada, 2010). This applies for all countries but specially for developing and emerging economies. The infrequent and often disrupted formal labor market participation leads to lower
E xt er na l se tt ing a nd e xo ge no us e ve nt s
•The role of schocks that prevent accumulation •The role of incomplete
financial markets on scope and structure of retirement wealth
•The role of shocks that initiate or accelerate decumulation
•Homeownership as durable good and financial asset in a world of incomplete markets
P ref er en ce dev ia ti on f ro m si mp le l if e c yc le se tt ing
•Behavioral biases that prevent achieving life cycle objectives, as predicted
•Lower risk
appetite/capacity/financial knowledge of lower compared to the higher income groups •Asset level beyond consumption
financing: an argument of intertemporal utility function •Role of intended and unintended
bequests
•Saving motives after retirement
T he e ff ec ts of inst it ut io ns, g ov er nm ent re gul at io ns and int er ve nt io ns
•The design and
implementation of mandated earnings-related retirement schemes across countries •Minimum income
guarantees and related provisions
•Heterogeneity in longevity by income levels
•The effects of retirement income taxation
•Institutional development and tax treatment of mortgage and annuity markets
contribution density to the mandated public scheme and reduces also the capabilities and incentives to save out of irregular labor income in financial market instruments.
Conjectures: the lower labor force participation, the higher unemployment, and the higher informality in the economy, the higher are the accumulation gaps between those predicted by LC theory and the actual retirement wealth for lower income segment.
(ii) The role of incomplete financial markets on scope and structure of retirement wealth
Mandated pension schemes disburse in most instances benefits only as life annuities. Only in a few cases are lump-sum payments permitted (such as in Australia, Malaysia and other countries with a provident fund structure, and most recently also in the UK). The voluntary market purchase of retirement annuities is in most countries very limited and decreasing. This lack of voluntary demand for annuities contrasts with the guidance from economic theory (Yari 1964, 1965) giving rise to the “annuity puzzle” and many papers attempt to rationalize (see Beartzi et al 2011 for a short, and Milevsky 2013 for a very comprehensive recent review). One key explanation is that the purchase of an annuity is the less attractive the less complete financial markets are to insure against the many other risks (Holzmann and Hinz 2005). This favors accumulations outside life annuities (including mandated earlings-related schemes) but with imperfect financial markets potentially at lower levels and in non-financial market assets.
Conjecture: The level and portfolio effects of financial retirement wealth is linked to the degree of financial markets (in-) completeness and access.
(iii) The role of shocks that initiate or accelerate decumulation
In the case of incomplete financial markets (negative) shocks are bound to reduce the asset accumulation prior to and after retirement (else one would have been able to perfectly insure against such shocks). The most relevant shocks to permanently diminish retirement accumulations below what they would have otherwise been are conjectured to be protracted unemployment and business failure, costly divorces, protracted and expensive sickness, long-term care, and economic and natural crises. They may occur during the whole life cycle (except typically unemployment and long-term care) and may reach across the whole income strata. To our knowledge the relevance of shocks for asset decumulation is pretty much under-researched (exceptions include Aassve et al. 2007). In lower income groups it may wipe-out any existing modest accumulation before and after retirement. In the higher income group such shocks is conjectured to be the key reason for a decumulation after retirement. Conjectures: Key shocks substantially reduce retirement accumulations. For low-income groups they may wipe out all assets. For high-income groups they are the essential reason for decumulation.
(iv) Homeownership as durable good and financial asset in a world of incomplete markets
The level, acquisition and divestment of homeownership seems to have a strong cultural and historic dimension but also various economic dimensions that are fostered or wrinkled by government regulations and the prevalence of incomplete markets. This sharpens the role of homeownership as service provider as well potential retirement asset. But during actual de-cumulation, empirical evidence across countries suggests that a reduction in homeownership and other property assets typically happens mostly after the decumulation of financial assets.
This makes homeownership in most countries seemingly less of a useful asset throughout the life cycle than it could be. For example, early homeownership could be an instrument to instill saving efforts and financial market knowledge into the younger generation that is used at mid-career to instill incentives and knowledge for financial retirement saving while using both assets in retirement for financing the consumption.
Conjectures: Homeownership (a) has a strong cultural and historic determination; (b) reflects illiquidity in the market, including for reasons of taxation and regulation; (c) closely linked to inheritance and a bequest motive that goes beyond the financial bequest. As a result, during retirement homeownership is typically only liquidated after a major shock. Only in few countries is property downsizing with retirement an observable phenomenon.
b. Preference deviation from simple life cycle setting
(i) Behavioral biases that prevent achieving life cycle objectives, as predicted
While most individuals have typically few problems in making rational decisions on day-to-day matters, when it comes to intertemporal decision such as saving and forgoing consumption now for consumption in the future (when inactive) many more individuals behave not as rationally as traditionally predicted. The detection of the underlying behavioral biases against retirement saving has been a major occupation of the bourgeoning research area of behavioral economics and the biases comprise cognitive errors and emotional biases (see Charles and Kasilingam 2016 for an extensive and recent literature review). Some analyses are focused in analyzing differences between observed and expected life expectancy from the individual perspective (how many years people think will be alive) and how this affects the saving and dissaving behavior(Perozek, 2008; Bloom et al., 2006; O’Donnell et al., 2008; Costa-Font and Vilaplana-Prieto, 2019).
The behavioral bias seems to be linked with income (and wealth) level and particularly strong among the poor (De Nardi 2015; Hurst, Luoh and Stafford 1998). A lot of analytical work has been undertaken in recent years to explore theoretically, empirically, and operationally interventions to overcome the underlying present-day biases for all individuals but specifically among low-income groups.
Conjectures: Lower income groups have many more and stronger cognitive and emotional behavioral bias against retirement saving
(ii) Lower risk appetite/capacity/financial knowledge of lower compared to the higher income groups
Linked with the point above, but independent is increasing evidence that lower income groups have a lower risk appetite. If correct, this would imply that even with an identical saving rate for retirement income the lower income groups would end-up with a much lower retirement wealth accumulation compared to their life-time income (net of interest earnings). Assuming a difference in real rate of return of only 3 percent p.a., after the 40 years the accumulation difference to life time earnings amounts to a ratio of about 3,2 to 1. One of the reasons why the stated risk appetite is lower may be linked to the lower level of financial education. Lusardi et al. (2017) illustrate that differences in financial knowledge may have a role in explaining wealth inequality between households. They estimate that 30 to 40 percent of retirement wealth inequality may be attributable to this knowledge gap.
Conjectures: Lower income groups have lower risk appetite, lower risk capacity, and lower financial knowledge and in consequence much lower financial accumulations (everything else kept constant)
(iii) Asset level beyond consumption financing: an argument of intertemporal utility function
A main reason why the rich do not dissave as expected may have to do with the mis-specification of the typical utility function in LC consideration. The typical intertemporal utility function has the period consumption as the key utility providing economic variable with the saving as key instrument variable of optimization. Considering variable labor supply with leisure as a second utility argument does not change the basic issue. The specification implies that utility gains from further consumption make individuals running down their retirement asset after retirement. It ignores that the level of assets may also create a utility through social status and political power which at one marginal level may exceed that of additional period consumption leading to continued accumulation, or the marginal values at one moment coincide so that the wealth level remains constant. Shocks discussed above and the related loss in wealth may change the equilibrium and lead to wealth decumulation thereafter (Burnett et al. 2017, De Nardi 2015).
Conjectures: The higher the level of retirement wealth the more a decumulation of wealth through consumption should take place is not a welfare increasing proposition for many rich people.
(iv) Role of intended and unintended bequests
Introducing a bequest motive into a traditional LC model does not change the conclusions about accumulation and decumulation. Only the wealth at death is not zero but, on purpose, positive. However, the motivation and importance of bequests is empirically still not well established. Most importantly, we do not know well how much of the wealth left is due to an explicit bequest motive or precautionary savings motives, or from a related angle are planned or unplanned, how this is linked to institutional settings, etc. (Dynan et al. 2002, De Nardi 2015, Kværner 2017). We have also limited empirical knowledge how much bequests are undertaken inter-vivo and we have also little conceptual clarity how to handle in bequest in terms of expenditure on education for children that increase their human capital (and perhaps also the return rate) compared to financial asset transfers that offer another type of return.
Conjectures: The higher the wealth level at retirement the lower the decumulation during retirement, if at all decumulation takes place, the more individuals leave indented und unintended bequests. The differentiation and its empirical measurement has little bearing on no decumulation strategies for the highest tier; it may have some effect for the middle tier.
(v) Saving motives after retirement
Recent empirical studies have shown that many retirees do not decumulate their assets after retirement and may even keep on saving after that age (see, e.g., Asher et al. 2017). Several justifications have been put upfront to explain this stylised fact, including the existence of specific economic and psychological saving motives at old age. Among the economic saving motives, the importance of precautionary savings - for general expenditures or health/dependency uninsured expenditures -, concerns about individual longevity risk (i.e., of outliving one's wealth), intended and intra-household (partner) bequest and liquidity and inflation risks (De Nardi et al., 2016). Among the psychological saving motives (see, e.g., Canova et al., 2005), the desire to remain financially independent (autonomy motive), the security motive (having enough money to protect against anticipated vulnerability at old age, which often inherent to this social group), protecting against political risk (that affects pension income through, e.g., benefit indexation rules, pension taxation regimes, pension reforms) and self-gratification motive (maintaining and increasing wealth offers intra-family and external power and prestige and social recognition).
Conjectures: There are specific economic and psychological saving motives at old age that prevent many retirees to decumulate their assets and justify a continuous saving behavior during the retired stage of life.
c. The effects of government institutions, regulations and interventions
(i) The design and implementation of mandated earnings-related retirement schemes across countries
Government impacts through design and implementation the participation in mandated and voluntary pension schemes, and further on the scope of accumulation and decumulation within and beyond these schemes. This has a special bearing on the lowest and highest tier and results from intended and unintended inconsistencies and outright discrimination among pillars and schemes; selective mandating; inconsistent taxation between schemes and over time; unaddressed heterogeneity in longevity; etc. Four effects are conjectured to be in the forefront of contributing to the three-tiered income group effects of life cycle anomalies: Minimum income guarantees and related provisions; heterogeneity in longevity by life-time income levels; the effects of retirement income taxation; and Institutional development and tax treatment of mortgage and annuity markets.
Conjectures: Differences in the scope and composition of financial and non-financial wealth at and after retirement reflect differences in the design of mandated and voluntary pension schemes within and between countries. This has some but limited/moderate effects on the scope of differences across the income tiers across countries. The common effects prevail.
(ii) Minimum income guarantees and related provisions
A related topic is rising provision of minimum income guarantees in countries, including for the elderly from a politically determined age onward. In almost all countries these guarantees are pensions, earnings and/or asset test with allowances and tapering provisions, with ceilings that reach at times into the middle-income range (Holzmann et al. 2009; Hurd et al. 2012). Such provisions make for the lowest income group mandated contributions or voluntary savings akin to taxes; this may explain much of the low accumulation levels at retirement for this group.
Conjectures: Lower income groups have no or very limited incentives to accumulated notional and real retirement
assets.
(iii) Heterogeneity in longevity by income levels
Lower income groups may have a lower incentive to save voluntarily for retirement and they may resent the public mandate because of their lower live expectancy. There is strong and rising country evidence that life expectancies by lifetime income differs substantially in many countries and the difference is rising. In a uniform design a lower life expectancy creates a tax on contributions they want to avoid (Ayuso, Bravo and Holzmann, 2017a,b). This contrasts with the high life-time earners that enjoy a subsidy through the public scheme. This tax effect may contribute to explain why the lowest income groups have lower participation rates as well as lower contribution density; an effect that may be softened by progressive benefit design. The subsidy effect for the highest income groups may have the opposite effect but maybe dwarfed by other considerations.
Conjectures: Heterogeneity in longevity by (life-time) income level contributes to lower participating and contribution density in mandated schemes and voluntary purchase of life annuity by the lowest income groups. The effects are conjectured to depend also on the scope of the contribution/benefit link. For the highest income groups the opposite effects could exist that may, however, be weakened by other and more dominant effects (such as differences in the rate of return between mandated and voluntary provisions).
(iv) (iv) The effects of retirement income taxation
The taxation of retirement is very complex and often inconsistent within countries and over time (Holzmann and Piggott 2018). While most of the mandated retirement saving follows a consumption-type treatment with contributions tax exempt while taxing benefits, for occupation and personal saving the tax treatment changes often by plan type and over time. Most countries offer for ear-marked retirement plans tax privileges in which saving efforts are tax free while returns and disbursement may or may not be taxed. In any case, in a progressive income tax situation there is an incentive for smoothing consumption across the life cycle and to substitute not tax privileged savings by privileged ones. This is of no or little importance for the lowest, important for the middle, and very important for highest income groups.
Conjectures: Taxation differences affect the composition of retirement wealth and may affect also its absolute and
relative size at retirement. The highest income groups have the strongest incentive for tax smoothing by moving taxation towards the future.
(v) Institutional development and tax treatment of mortgage and annuity markets
As stated above, financial assets and housing property are alternative/substitutive assets. They both involve long-term saving and investment decisions over the life cycle which have implications for old-age options and outcomes. Home homeownership serves both consumption and investment functions, which are assessed differently by households based on their personal preferences. Both financial products and property assets may increase in value over time and expand future consumption opportunities but there are risks involved. They have, however, different levels of liquidity and risk protection and their mobilization entails in the case of home equity significant monetary and non-monetary costs (Bravo, Ayuso and Holzmann, 2019). The attractiveness and hence portfolio composition of both will depend on the quality of the respective markets and the tax treatment of both assets. From a cross country perspective this is quite likely the least researched area, also because other elements will play a role and need to be considered in the analysis. For instance, in Australia the primary residence is not considered by the asset test of the minimum income guarantee with the expected consequences: The mortgage market is well developed in contrast to the reverse mortgage market; housing assets are key for the elderly and the life annuity market is minimal.
Conjectures: (a) Individuals liquidate financial before housing property; (b) This priority reflects institutional obstacles, personal preferences as well as bequest considerations; (c) The constrains overall favor lower decumulation.
3. Reviewing and summarizing the international
literature around life-cycle accumulation and
decumulation
This section reviews and summarizes the relevant life-cycle literature in a way that should help explore and sharpen the hypotheses outlined in Section 2. Too large is already the literature around the life-cycle hypothesis to allow for an unfocused approach. And even this focused approach has to remain incomplete: Too large is the literature in some areas and often too limited or non-existing is the literature in others.
Section 3.1 reviews and summarizes the available literature on the accumulation of wealth at retirement – its composition and differentiation by life time income -, and the overall consistency of the accumulation and decumulation patterns with the LCH. Section 3.2 reviews and summarizes the available literature on the external settings and exogenous shocks while Section 3.3 does this review for the preference deviations from the traditional LC setting. Section 3.4 reviews and summarizes the effects of benefit design, regulations and interventions on deepening the three-tiered income-group effects.
3.1 Scope and structure of wealth accumulation at retirement and accumulation and
decumulation patterns
This section offers a very first review of literature and quickly accessible data that documents the wealth distribution at retirement – its scope and structure – and patters of accumulation and decumulation before and after retirement.
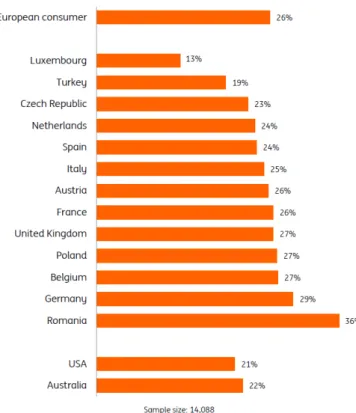
It starts out with the results of a very recent survey on saving (ING 2018), that includes the answer to the question whether the household has any saving (Figure 3.1.1). The answer “no” prevails in 26 percent of the households in the EU, compared to 21 percent in the USA and 22 percent in Australia. The overall magnitudes provide a first indication for the scope of the first income tier. The differences between EU, USA and Australia are consistent with less public retirement provisions in the latter two countries. The differences between EU countries is not straightforward and suggests an effect of country income levels (say Luxembourg vs Romania); scope of public provisions; and also the possible impact of family ties (Turkey).
Figure 3.1.1 The share of individuals without any saving across countries
Source: ING Savings Report 2018;
Notes: Shares of households in each country that answer no to the question: “Does your household have any saving.” These figures exclude those who replied “prefer not to answer”
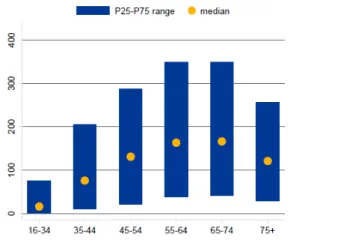
Figure 3.1.2 shows the distribution of net wealth over the life cycle by age of the reference person in the euro area according to the second wave of the Household Finance and Consumption Survey (HFCS) conducted by the European Central Bank (ECB, 2016).2
2The HFCS is a survey that collects data on households’ finances and consumption for 18 euro area countries (all except Lithuania), as well as Hungary and Poland. Currently, the survey accounts for two waves, taking place the second wave between 2013 and 2015. The total sample consists of more than 84,000 households.
Figura 3.1.2 Distribution of net wealth by age of reference person in the euro area
Source: Household Finance and Consumption Survey (ECB, 2016), 2nd wave. Notes: Net wealth in EUR thousands; age groups in years.
The box plot displays only the interquartile range (P75-P25) and the median of the distribution and illustrates the extent of wealth heterogeneity across households. But there two main conclusions we get from this graph that could guide our research. The first is that between 65 and 74 years the level of decumulation is very low if compared to the pre-retirement stage (55-64). We observe as the median and the quartiles are very similar in both intervals. The second one is that the most important level of decumulation is found after age 75, probably due to the emergence of shocks (in particular health, long-term care, death within couples) but also cohort effects (the after war generation may have had less opportunities to accumulate).
In any case, the data in Figure 3.1.2 presents net tangible wealth (i.e. tangible wealth minus tangible labilities) and leaves out the importance non-tangible wealth, most importantly the scope of implicit pension wealth stemming from mandated and unfunded pension schemes.3
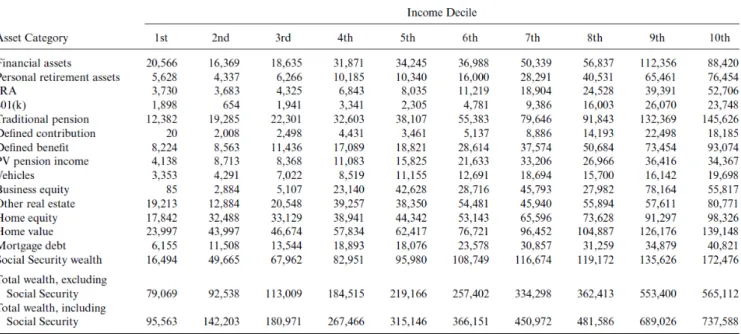
We are not aware of any European analyses that adds to tangible wealth estimates of the implicit pension wealth at retirement. This effort has been undertaken for the US in a now somewhat dated study by Venti and Wise (2001). The results in Table 3.1.1. are based on the first wave of Health and Retirement Study data and matched with US Social Security (i.e. mandated public pension) data. The sample is small and comprises some 4000 households and the income deciles are based on social security income information and hence not a fair sample of overall income status. Still it offers useful insights.
Figure 3.1.3 Mean Level of Assets by Lifetime Earnings Decile and Asset Category, Health and Retirement Study (HRS)
Source: Venti and Wise (2001), based HRS household and US Social Security data for individuals. Notes: The HRS sampled families with heads aged age fifty-one to sixty-one in 1992.
Table 3.1.1. highlights the breadth of assets by US households in 1992 ranging financial assets via various types of occupational and personal pension assets, business equity, home equity and social security wealth. Except for the first income decile where the social security/public pension wealth in total wealth is low, the share in the second income decile is well over 50 percent and reaches still over 1/3 in the highest decile. This is likely to have changed since as by 2015 in the US, more pension income has been paid out by employer sponsored and individual accounts-funded provisions (1.45 US$ trillion) than by the social security administration (940 US$ billion), with further increase in the gap predicted.
As in most of the European countries unfunded public provisions dominate the unfunded complements by large (except in Denmark, Ireland, the Netherlands and the UK), wealth comparison at retirement without including estimates of the notional pension wealth are highly biased, make little sense, and offer not the information about wealth distribution at retirement we are interested in. However, we could not find any estimation in this direction albeit some may exit but are yet to be disclosed.
3.2 Life-cycle behavior, external settings and exogenous events
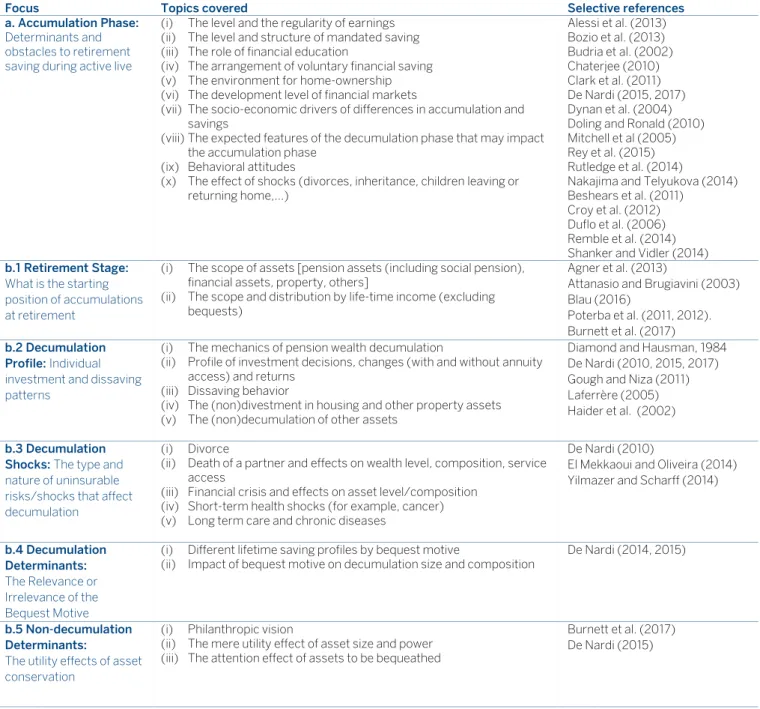
The accumulation and decumulation of wealth by individuals or groups during their lifecycle has been the object of comprehensive research in order to confirm or reject the validity of the hypotheses underlying the life cycle theory. Table 3.2.1 offers an (incomplete) review of the traditional research focus that we will complement in the next literature review tables with our angle. The successive reformulations of the lifecycle model warn us that the original formulation probably does not enjoy enough consistency, with authors systematically referring to the high
heterogeneity among individuals and their behaviour (noted already by Diamond and Hausman, 1984). Heterogeneity among individuals affects income, consumption, savings, and ultimately the distribution of wealth, and therefore, its systematization is a first step in conducting conclusive analyses on models about accumulation and decumulation in the life of individuals.
Figure 3.2.1 Literature Review on Life-Cycle Accumulation/Decumulation Features
Focus Topics covered Selective references
a. Accumulation Phase:
Determinants and obstacles to retirement saving during active live
(i) The level and the regularity of earnings (ii) The level and structure of mandated saving (iii) The role of financial education
(iv) The arrangement of voluntary financial saving (v) The environment for home-ownership (vi) The development level of financial markets
(vii) The socio-economic drivers of differences in accumulation and savings
(viii) The expected features of the decumulation phase that may impact the accumulation phase
(ix) Behavioral attitudes
(x) The effect of shocks (divorces, inheritance, children leaving or returning home,...) Alessi et al. (2013) Bozio et al. (2013) Budria et al. (2002) Chaterjee (2010) Clark et al. (2011) De Nardi (2015, 2017) Dynan et al. (2004) Doling and Ronald (2010) Mitchell et al (2005) Rey et al. (2015) Rutledge et al. (2014)
Nakajima and Telyukova (2014) Beshears et al. (2011)
Croy et al. (2012) Duflo et al. (2006) Remble et al. (2014) Shanker and Vidler (2014) b.1 Retirement Stage:
What is the starting position of accumulations at retirement
(i) The scope of assets [pension assets (including social pension), financial assets, property, others]
(ii) The scope and distribution by life-time income (excluding bequests)
Agner et al. (2013)
Attanasio and Brugiavini (2003) Blau (2016)
Poterba et al. (2011, 2012). Burnett et al. (2017) b.2 Decumulation
Profile: Individual
investment and dissaving patterns
(i) The mechanics of pension wealth decumulation
(ii) Profile of investment decisions, changes (with and without annuity access) and returns
(iii) Dissaving behavior
(iv) The (non)divestment in housing and other property assets (v) The (non)decumulation of other assets
Diamond and Hausman, 1984 De Nardi (2010, 2015, 2017) Gough and Niza (2011) Laferrère (2005) Haider et al. (2002) b.3 Decumulation
Shocks: The type and
nature of uninsurable risks/shocks that affect decumulation
(i) Divorce
(ii) Death of a partner and effects on wealth level, composition, service access
(iii) Financial crisis and effects on asset level/composition (iv) Short-term health shocks (for example, cancer) (v) Long term care and chronic diseases
De Nardi (2010)
El Mekkaoui and Oliveira (2014) Yilmazer and Scharff (2014)
b.4 Decumulation Determinants:
The Relevance or Irrelevance of the Bequest Motive
(i) Different lifetime saving profiles by bequest motive
(ii) Impact of bequest motive on decumulation size and composition De Nardi (2014, 2015)
b.5 Non-decumulation Determinants:
The utility effects of asset conservation
(i) Philanthropic vision
(ii) The mere utility effect of asset size and power (iii) The attention effect of assets to be bequeathed
Burnett et al. (2017) De Nardi (2015)
Our main objective in this sub-section is to present the (by nature also incomplete) results of our second international literature review according to the conjectured key reasons why accumulation and decumulation does not take place as expected. As outlined in section 2.2., we group the main reasons explaining these deviations around (a) exogenous events/shocks and the lack of an enabling environment that make the deviation rationale; (b) preference deviation from the traditional life cycle setting/assumptions and other deviations from
homo economicus, and (c) the effects of government regulations and interventions. Main findings are
summarized in tables 3.2.2, 3.2.3 and 3.2.4. The findings confirm in many cases our initial conjectures but suggest also new insights and main knowledge gaps to fill. To what extend the literature review leads us to revise our conjectures/hypotheses is taken-up up in Section 4.
Figure 3.2.2 Literature Review: External setting and exogenous events
Main avenues to be explored/Key findings Selective references
(i) The role of shocks that prevent accumulation
- There is comprehensive literature across developed and developing countries dealing with plight of low-income people, youth, marginalized groups, etc. and their struggle to make means end and, consequently, to save.
- There is very limited explicit literature on the role of shocks limiting the accumulation of wealth for retirement purposes, and if so, mostly in an implicit manner and linked with the outcome of the labor market
- Informality and unemployment are seen as the key determinant why individuals have low formal labor market participation, low contribution density and thus low or no non-financial pension and even less so financial wealth at retirement
- Low and irregular income during active life is seen as the key determinants for individuals to have low or no financial accumulations and property when approaching retirement
Khatiwanda and Sum, 2016 Shao and Silos, 2017 Mroz and Savage, 2006 Schmillen and Umkehrer, 2013 Ayres, 2013
Sum and Khatiwada, 2010 Bagliano et al., 2019
Holzmann and Jorgensen, 2001
Van der Klaauw and Wolpin (2008).
(ii) The role of incomplete financial markets on scope and structure of retirement wealth
- There is an established literature that points out differences between complete and incomplete financial markets as the main reason to explain differences in the household savings patterns, emerging mainly through the interest rate mechanism
- There is a very comprehensive literature trying to explain why full annuitization at retirement – as conjectured by the LCH does not take place (creating the annuitization puzzle)
- A key explanation are incomplete financial markets to address the longevity but also other life-time risks making annuitization not a winning proposal and suggesting effects on the size and structure of accumulation
Angelopoulos et al., 2019 Davidoff et al., 2005 Holzmann and Hinz, 2005 Peijnenburg et al., 2010 Yaarii, 1965, 1964 Cocco et al., 2005 Peijnenburg et al., 2010 Milevsky 2013 (iii) The role of shocks that initiate or accelerate decumulation
- Divorce and health problems are considered the two main shocks that prevent, initiate or accelerate decumulation before and after retirement; most papers are around these two shocks.
- Although there is not consensus in the literature about the existence or not of a gender bias in the economic impact of a marital dissolution, this consensus exists at the time of pointing out the higher opportunities to improve their financial situation for younger couples who divorce when compared to older couples in this situation.
- Health cost shocks are considered more common than other shocks. An extensive literature demonstrates the wealthier tier of the population being better able than the poor tier to cushion the effects of a health shock. The risk of living longer involves facing medical expenses in old age which is a key saving factor for high-income seniors. Private health insurance is conjectured to play a crucial role to avoid a high impact of this shock in the individual wealth.
- There is limited explicit literature on the role of early retirement as a shock. Mainly, the literature suggests a positive relation with a financial hardship in the last period of life and with healthcare expenditures.
- Only a limited number of papers analyse the impact that some natural disasters have in household assets and how they affect precautionary savings. All of them indicate as the lack of insurance against these kinds of phenomena can cause a critical damage in family’s economies.
Burkhauser et al., 1991 Duncan and Hoffman, 1985 Finnie, 1993
Fritzell, 1990
Jarvis and Jenkins, 1999 Smock, 1993, 1994
Smock et al., 1999 Poortman, 2000
Aassve et al, 2007 Fethke, 1989
Wagstaff and Lindelow, 2014 Sawada and Shimizutani, 2007 Skidmore, 2001
Shriver, 2010 Berkowicz, 2019 Angelini et al., 2009 De Nardi et al. 2010
- There seems to be no literature analysing the impact of other important shocks that initiate or accelerate decumulation, e.g., family formation, children leaving or returning home, the actual or expected receipt of an inheritance (real or financial asset) during working life or after retirement, the need to provide care to a relative or to be cared by someone, long unemployment spells, widowhood.
Dobrescu, 2012 Biro and Elek, 2018 Francoeur, 2002
Kopecky and Koreshkova, 2014
Zhao, 2015 Wallance et al, 2017 (iv) Homeownership as durable good and financial asset in a world of incomplete markets
- There is rich literature around homeownership as durable consumption good as well as financial asset but conclusions are often contractionary.
- Some studies demonstrate a negative correlation with age, i.e. they suggest a falling rate of house ownership rates for older people. Other demonstrate stronger dependence on other factors such as the market regulation, the wealth allocation or the existence of generous public pensions systems. Others suggest that the decumulation of home equity is highly correlated with that of the demand for long-term care insurance
- In this last case property ownership rates seem to be higher among the elderly.
- Some recent papers examine the problem of illiquidity of housing wealth arguing that the figure of reverse mortgage can be used as a lifeguard element in a situation of financial difficulties in old age. But reverse mortgages don't seem to take off in most markets.
Chiuri and Japelli, 2010 Castles and Ferrera, 1996 Castles, 1998
Kemeny, 2005 Stamsø, 2010 Delfani et al., 2014
Doling and Horsewood, 2011 Moscarola et al., 2015
Dewilde and Raeymaeckers, 2008
Müller, 2019 Source: Authors’ elaboration.
Figure 3.2.3 Literature Review: Preference deviation from simple life cycle setting
Main avenues to be explored/Key findings Selective references
(i) Behavioral biases that prevent achieving life cycle objectives, as predicted
- The is a bourgeoning literature that individuals tend to be biased on intertemporal choices and as a result do not behave as rationally as expected by life cycle theory. The potential individual shortcomings are many and include pro-castration, inertia, mental accounting, etc.
- To address the shortcomings of such individual behaviour financial education and related interventions may go some way as well as nudging instruments for savings decisions. However, if the behavioural bias is too strongly ingrained and income level specific, no non-coercive intervention may exist to establish a level playing field across income tiers
Samson, 2014 Dimmock et al., 2013 Charles and Kasilingam, 2013 De Nardi, 2015
Hurst, Luoh and Stafford, 1998
Huffman et al., 2016 (ii) Lower risk appetite/capacity/financial knowledge of lower compared to the higher income groups
- An extensive literature points to risk aversion as key factor in decisions on investment and planning for the future. There are empirical indications that the risk aversion is the higher the lower the income level. It is not settled whether the link is the result of rational behaviour (as poor individuals may have a lower risk-bearing capacity) or the result of lower financial education, or both.
- Financial literacy is considered by some literature strand as a key factor explaining individuals’ saving behavior and wealth accumulation. Financial literacy is highly correlated with wealth and income, yet the causality remains undecided.
- Low cognitive skills keep people poor making them even more risk adverse.
- Literature evidences a positive relationship between saving rates and permanent income. The saving elasticity increases when different sources of wealth exist.
Andreoni et al., 2019 Lusardi et al., 2017; 2011 Auerbarch and Kotlikoff, 1985.
Burnett, Davis, Murawski, Wilkins and Wilkinson, 2017 Deuflhard et al., 2019
Bozio, Emmerson, O’Dea and Tetlow, 2013
(iii) Asset level beyond consumption financing: an argument of intertemporal utility function - Literature evidences that utility is affected by the household composition and their needs. Some
strands of research suggest that rather than specify assumptions on the utility function of the retirees, it is more productive to define the optimal spending and investment plan.
- Except for the emergence of shocks, it could be expected that the greater accumulated financial wealth generates more wealth and therefore in relative terms the level of dissaving will be less. This conjecture is supported by a few papers suggesting that elderly people with higher lifetime income reach retirement with more wealth and also run down their net worth during this period more slowly. - Little theoretical and empirical literature could be found on the utility drivers of wealthier older people.
This is an area where more analysis is needed.
Hong and Ríos-Rull, 2012 Sharpe et al., 2007 De Nardi, 2015
Budria, Díaz-Jímenez, Quadrini and Ríos-Rull, 2002 Dynan, Skinner and Zeldes, 2004
De Nardi, French and Jones, 2010
(iv) Role of intended and unintended bequests
- One strand of literature concludes that inheritance is a key factor explaining the wealth household distribution. Households that received a bequest during lifetime have a higher net wealth level than non-bequeathed counterparts.
- Only few papers conclude that saving patterns are mainly motivated by a bequest motive towards the family. More papers suggest the marginal utility of bequests being small and bequests largely the result of the uncertain date of death.
- Inheritance seems highly correlated with some individual decisions not only related to savings and consumption, but also with others like the exit of the labor market. Individuals who inherit a given year are more likely to exit labor market.
- No literature has been found about how much bequests are undertaken inter-vivo, the role of intra-household (partner) intended bequests, and correlation between wealth al retirement and probability of inheriting and leaving inheritance.
Barrett et al., 2015 Dynan et al., 2002 Fessler and Schuerz, 2015 Kaerner, 2017
Garbinti and Georges-Kot, 2019
Hurd, 1989
(v) Saving motives after retirement
- Some papers suggest the existence of specific economic saving motives at old age, particularly precautionary savings for general expenditures or health/dependency related expenses, the fear or outliving one's wealth, and the protection against liquidity and inflation risks ().
- Few papers suggest the existence of specific psychological saving motives after retirement, e.g., the desire to remain financially independent, financial security concerns and the desire to protect against anticipated vulnerability at old age, concerns on political risk with impact on pension income or wealth, or particularly for the wealthier the desire to maintain the intra-family and external power, prestige and social recognition offered by wealth.
De Nardi et al., 2016 Canova et al., 2005 Alonso-García et al., 2018
Source: Authors’ elaboration.
Figure 3.2.4 RIL: The effects of institutions, government regulations and interventions
Main avenues to be explored/Key findings Selective references
(i) The design and implementation of mandated earnings-related retirement schemes across countries - An extensive literature suggests the existence of a displacement effect of mandated pension wealth on
voluntary household savings.
- For individuals with low incomes there is strong evidence that public pensions create a lower propensity to saving.
- Generous social security benefits have a negative effect on the accumulation of private savings for retirement purposes, i.e. there is a crowding out of private by public (mandated) pension wealth. - The generosity of public pension systems across countries can incentivize early retirement and depress
savings.
Alessi, Angelini and Van Santen, 2013
Hurd et al., 2012
Attanasio and Brugiavini 2003
Blau, 2016
Poterba, Venti and Wise, 2012
(ii) Minimum income guarantees and related provisions
- Only few papers analyze the effect of the rising provision of minimum income guarantees (after retirement age, or before) on the saving/dissaving processes.
- Such minimum provisions after eligibility age make for the lowest income group mandated contributions or voluntary savings for that age akin to taxes unless the design of integrating such provisions with the earnings-related scheme soften the implications.
- There is some evidence that a good design integration has limited effects on the (formal) labor force participation. But to our knowledge there is no empirical work on the effects of alternative integration designs on individual savings decisions.
European Commission, 2016
Iaconno, 2017 Marx and Nelson, 2013 Holzmann et al., 2009 Goedeme, 2013 Hurd et al 2012 Fajnzylber, 2019 (iii) Heterogeneity in longevity by income levels
- Some recent papers demonstrate that longevity varies substantially between individuals according their income level, with a higher life expectancy at birth and at the retirement age for people at the highest wealth deciles.
- Lower life expectancy than the average cohort member in an earnings-related scheme creates an economic effect that is akin to a tax with all the consequences on formal labor supply and consequently retirement savings decisions and outcomes. For individuals with higher than average life expectancy we have a potential subsidy effect that may affect their labor force participation and savings decision. How they work out in reality is – so far – unresearched. This tax effect may contribute to explain why the
Ayuso, Bravo and Holzmann., 2016a, 2016b Kvaerner, 2017
National Academies of Sciences, 2015
Holzmann et al., 2019 Palmer and de Gosson de Varennes, 2019
lowest income groups have lower participation rates as well as lower contribution density. (iv) The effects of retirement income taxation
- An extensive literature explains the main differences in income taxation of retirement schemes across different forms of benefit design and funding. The national rules for pension taxation are typically very complex and vary a lot across counties and time.
- Under a typically progressive income tax situation there are strong incentives for smoothing taxation across the life cycle and to substitute not tax privileged savings by privileged ones. This behavior suggests a correlation with income level being more accentuated for highest income groups.
- The confusion resulting from the complexity of the tax system may have led some countries to introduce more direct financial incentives to encourage participation in and regular contributions to the private and funded pension schemes; this approach has favored the rich and may have contributed lower decumulation the highest tier.
Holzmann and Genser, 2018
Holzmann and Piggott 2018
OECD, 2015
(v) Institutional development and tax treatment of mortgage and annuity markets
- A selective literature has analyzed annuities/financial assets and housing property as alternative/substitutive assets.
- Quality of financial markets, tax treatment, but also legal regulation for both assets play an important role regarding the level of penetration of one or both alternatives.
- Empirical studies and surveys for different countries suggest a greater propensity to liquidate financial assets before housing property
- We found no literature on differences of these phenomena by income level (tiers).
Campbell and Cocco, 2003
Ehrmann and Ziegelmeyer, 2014 BBVA, 2018