Resumo
Este trabalho oferece uma segunda panorâmica da situação encontrada no sistema brasileiro de unidades de conservação em meados de 2010. Atualiza um texto anterior (DRUMMOND et al., 2009) que empregou dados validos para 2005. Examina as seguintes variáveis das áreas de proteção federais e estaduais - idade, números, tipos de unidades, tamanhos absolutos e médios, distribuição por estados e biomas, e grau de adequação com os objetivos defi nidos pela CDB (Convenção sobre Diversidade Biológica). Principais resultados: (i) o sistema manteve um período de crescimento de 32 anos; (ii) os parques nacionais e as fl orestas nacionais, continuam sendo as unidades do sistema mais proeminentes; (iii) a distribuição de unidades por região e bioma continua desequilibrada; (iv) as unidades estaduais cresceram de forma importante nos últimos cinco anos e praticamente se articularam com as áreas das unidades federais; (v) as unidades estaduais estão fortemente orientadas para o uso sustentável; (vi) o uso sustentável das unidades avançou em relação ao anterior predomínio de áreas de proteção total; (vii) a Amazônia permanece como o bioma mais amplamente protegido; e (viii) os objetivos quantitativos de proteção dos biomas propostos (de acordo com as diretrizes da CDB) encontram-se mais próximos, apesar de que o predomínio das unidades de uso sustentável levanta dúvidas em relação à possibilidade real de se atingirem tais metas. Em 2010, o Brasil atingiu uma posição de destaque na classifi cação global das suas áreas protegidas - quarto lugar no mundo, com a maior
Abstract
This text provides a second overview of the Brazilian conservation unit system as it stood in mid-2010. It updates an earlier text (DRUMMOND et al., 2009) that used data valid for 2005. It examines the following dimensions of federal and state protected areas – age, numbers, types of units, absolute and average sizes, distribution by states and biomes, and degree of compliance with CBD-inspired goals. Major fi ndings: (i) the system maintained a 32-year rapid growth rate; (ii) national parks and national forests continue to be the most prominent units in the system; (iii) distribution of units by region and biome remains unbalanced; (iv) state units grew remarkably over the last fi ve years and have almost tied with the combined area of federal units, (v) state units are strongly biased towards sustainable use; (vi) sustainable use units advanced in their general predominance over fully protected units; (vii) Amazonia remains the most extensively protected biome; and (viii) quantitative goals of biome protection proposed (under CBD guidelines) are closer to being reached, but the predominance of sustainable use units raises doubts about the viability of reaching such goals. In 2010 Brazil reached an outstanding status in the global ranking of its protected areas - fourth in the world, the largest amount of units created in 2000-2010, and the largest combined area of protected tropical formations. However, several regions and biomes
An assessment of Brazilian conservation units – a
second look
Avaliação das unidades de conservação brasileiras - uma segunda
leitura
José Augusto Drummond – Professor, Centre for Sustainable Development, Universidade de Brasília, Brazil. E-mail: jaldrummond@uol.com.br
José Luiz de Andrade Franco – Professor, Department of History and Center for Sustainable Development ,Universidade de Brasília, Brazil. E-mail: jldafranco@terra.com.br
INTRODUCTION
This article offers an overview of the results of the Brazilian policy (initiated in the 1930s) for creating and managing conservation units (public protected areas) and of their current status. It updates and expands earlier texts (DRUMMOND et al., 2009; DRUMMOND et al., 2006). These texts used information valid for late 2005, whereas the present text uses information valid for mid- to late 2010.
The number and the combined area of publicly protected areas in Brazil have grown continuously over the last 70-plus years. The accepted starting point for Brazilian protected area policies is 1937, with the creation of the country’s
fi rst national park, Itatiaia, although a few state protected areas were created
earlier. After a long, slow start, between the 1930s and mid-1970s, growth attained almost exponential rates since the late 1970s. Given the general weakness of other biodiversity protection policies and despite serious managerial problems that affect protected areas, they have proven to be crucial for the protection of Brazil’s probably unmatched terrestrial biodiversity – it is the largest tropical country in the world, extensively forested, with mostly humid climates and a striking variety of biomes, ecosystems, landscapes and organisms (DRUMMOND, 2004).
As happened in many places subject to European expansion, the natural endowment of large portions of the Brazilian territory was altered and impoverished over the last 500 years by numerous cycles of productive activities, fuelled by a prevalent mind set of “growth at any cost”. Of course, indigenous populations previously also caused substantial changes in the natural endowment, although not as much as in parts of Mesoamerica and the South American highlands (MILLER, 2007; MANN, 2005; MANN, 2011). Europeans exploited successive frontiers (Brazil-wood, live animals, gold, precious stones, rubber, coffee, cotton etc.) in the Brazilian territory, impoverished their resources, and the process continues. (DEAN, 1995). A strong consensus among diverse social groups and a generalized perception of the abundance of resources boost this “cornucopian” mentality and insulate it from deep concerns about environmental quality, the
fi niteness of resources, and the protection of biodiversity. Nonetheless, since the
1930s protected areas have played a progressively stronger role in the resistance to this mentality. They allowed the survival of considerably large portions of the territory in which native biodiversity and associated ecological processes continue to exist free from radical anthropogenic changes (PÁDUA, 1997)
paper addresses only some of the dimensions to be dealt with by managing agencies and by activists, citizens and organizations concerned with biodiversity protection. (DOUROJEANNI and PÁDUA, 2001; ARAÚJO, 2007). Please refer to author et al, 2009, sections 2 and 3, for more detailed and contextual information about Brazilian conservation units.
1 MATERIALS AND METHODS
Our major source is the extensive database compiled by the Brazilian Ministry of the Environment, in the “Cadastro Nacional de Unidades de Conservação do Ministério do Meio Ambiente (CNUC-MMA)”, available at http://www.mma. gov.br/sitio/index.php?ido=conteudo.monta&idEstrutura=119 (last accessed on May 22 2012).1 It is the offi cial registry of all Brazilian conservation units. For the
sake of brevity, several introductory and explanatory passages and bibliographical references from the 2006 and 2009 texts were excluded here. Interested readers may refer to them. For the purpose of assessing the distribution of protected areas, Brazil’s offi cial maps of geographical regions and of its biomes (or grand
ecological units) were used.
2 RESULTS AND DISCUSSION
2.1 FEDERAL CONSERVATION UNITS
This section addresses the numbers, the combined areas, and the distribution by region and biome of all federal and state conservation units.2 Also discussed
is the degree to which Brazil has fulfi lled its pledged goals for protected areas in
the context of the Convention on Biological Diversity.
2.1.1 Numbers and areas
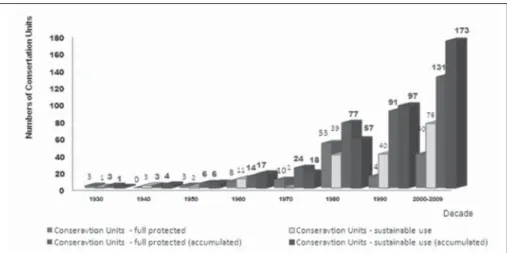
Graph 1 and Table 1 display the most general relevant data about current federal conservation units.3 They show that the system had a slow start (1930s,
1940s, 1950s and 1960s), followed by progressively accelerated growth. Year-to-year data, however, reveal leaps and slowdowns. For example, growth in the 1950s occurred in the single year of 1959, when three national parks were created. The same happened in the 1960s, with a surge of eight new parks, in 1961. The strong growth in the 1970s, on the other side, was fuelled by several new and very large units created in 1979, at the close of the decade. In contrast, 92 new units were created 1980s, covering 19 million hectares, followed in the 1990s by 55 units (13 million hectares), in the 2000s by 115 units (more than 37 million hectares).4
These latter fi gures translate into an almost exponential growth for approximately
the last 30 years.
Graph 1: Numbers of Federal Conservation Units created, per decade (1930-2010).
Source:CNUC/MMA (July 2010).
3 Almost all fi gures used herein exclude one type of conservation unit – RPPNs, privately
owned, and offi cially accredited preserves. Although quite numerous (973 federal and state
RPPNs existed in late 2010), they are usually quite small. Together they add up to only 7,000 km2, a minimal fi gure in the context of the system. They average only 7.19 km2 per
unit, much below the all other types of units. They were excluded because their large numbers distort percentage computations.
4 At the 2009 Brazilian Conference on Conservation Units, the Ministry of the Environment
announced that this last fi gure made Brazil world leader in the creation of protected areas for
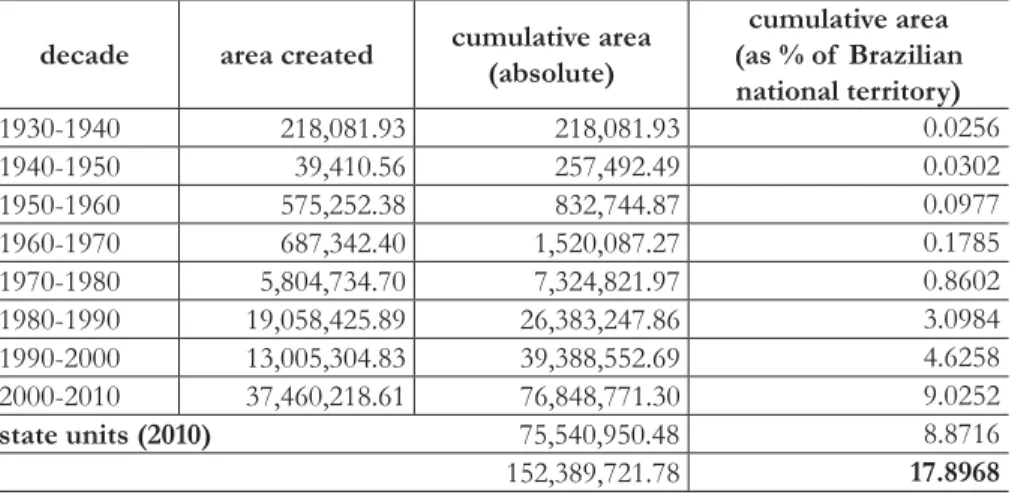
Table 1: Areas of Federal Conservation Units, created per decade (1930-2010), plus Total Area of State Units (2010)a, in hectares.
decade area created cumulative area (absolute)
cumulative area (as % of Brazilian national territory)
1930-1940 218,081.93 218,081.93 0.0256 1940-1950 39,410.56 257,492.49 0.0302 1950-1960 575,252.38 832,744.87 0.0977 1960-1970 687,342.40 1,520,087.27 0.1785 1970-1980 5,804,734.70 7,324,821.97 0.8602 1980-1990 19,058,425.89 26,383,247.86 3.0984 1990-2000 13,005,304.83 39,388,552.69 4.6258 2000-2010 37,460,218.61 76,848,771.30 9.0252
state units (2010) 75,540,950.48 8.8716 152,389,721.78 17.8968
a So far, there is not a reliable breakdown per decades for the creation of state protected areas.
Source:Brazilian Ministry of the Environment (July 2010).
Box 1
Number of federal conservation units in 2006: 287
Number of federal conservation units in 2010: 304 (+ 5.9 per cent) Aggregate area (ha) of federal conservation units in 2006: 69,528,387.03 Aggregate area (ha) of federal conservation units in 2010: 76,848,771.30 (+ 10.5 per cent)
The 70-year pattern revealed by these data is marked fi rst by the long
prevalence of a small number of small units (mostly national parks), almost invariably close to large and medium-sized cities on or near the coastline, with strong incidence in the Atlantic Forest biome, besides attention to easy access, exceptional natural features and the possibility of supporting continued scientifi c
of areas inside public lands, to avoid costly buy-outs and litigation. Therefore, since 1979 the early profi le of the system has gone through a thorough makeover.
(PÁDUA, 1997; ARAÚJO, 2007; MORSELLO, 2001; DRUMMOND, 1997). In the case of fully protected federal units, the data compiled in Graph 2 show that before the late 1970s there were only national parks.5 Other types of
fully protected units were latecomers. The fi rst biological reserve appeared only
in 1974. Signifi cantly, it was created as part of Brazil’s fi rst concerted, long-term
effort to save an endemic animal species, the golden lion tamarin (Leontopithecus rosalia rosalia). (KLEIMAN and RYLANDS, 2008). 28 other biological reserves followed. Ecological stations appeared only in 1981. 30 others were created since then. Wildlife refuges and natural monuments, with minimal participation in the system, appeared only in 1983 and 2008, respectively. In mid-2010, there were 64 national parks, 29 biological reserves, 31 ecological stations, 5 wildlife refuges and 2 natural monuments, a total of 131 federal fully protected units.
Graph 2: Number of Fully Protected Federal Conservation Units created, per decade (1930-2010).
Source: CNUC/MMA (July 2010).
Graph 3 illustrates the evolution of sustainable use conservation units,6
with the exception of private reserves (RPPNs). National forests exist since the
5 In fully protected units, as defi ned by Law 9,985, July 18, 2000, human presence and productive
activities are excluded. Besides national parks, they include biological reserves and ecological stations (both with considerable weight in the system), besides sparse natural monuments and wildlife refuges. See DRUMMOND et al., 2009, p. 471.
6 The same Law 9,985 defi ned sustainable use units as those that allow humans to reside in
them and to engage in a broad variety of productive activities vaguely defi ned as “sustainable”.
They include national forests, environmental protection areas, extractive reserves, sustainable development reserves, areas of relevant ecological interest and fauna reserves, besides the aforementioned private reserves - RPPNs. Combining all these types, they allow logging, hunting,
fi shing, fl oral extraction, agriculture, animal husbandry, mining, tapping of water sources (for
1940s and were the predecessors of this group. They are now numerous (65) and widespread. Environmental protection areas and areas of relevant ecological interest came into being only in 1984 (today there are 31 and 17, respectively). Extractive reserves appeared only in 1990 (there are currently 59), followed by sustainable development reserves (only 1 exists). No fauna reserves have been created. In mid-2010 there were 65 national forests, 31 environmental protection areas, 17 areas of relevant ecological interest, 59 extractive reserves and 1 sustainable development reserve, for a total of 173 sustainable use units.
Graph 3: Numbers of Sustainable Use Federal Conservation Units created, per decade (1930-2010).
Source: CNUC/MMA (July 2010).
Graph 4 records the numbers of fully protected and sustainable use federal units created per decade and their cumulative numbers. The existence of 12 categories (mentioned in notes vi and vii) allows the Brazilian conservation unit system to be fl exible in the thorny compromise between strict biodiversity
protection and access to natural resources. Conceptually, leisure, scientifi c research
Graph 4: Numbers of Fully Protected and Sustainable Use Federal Conservation Units created, per decade (1930-2010).
Source: CNUC/MMA (July 2010).
The relevant data on the matter of the balance between the areas occupied respectively by the two groups of federal conservation units are found in Table 2, again excluding privately owned reserves. There is a slightly more balanced situation when areas of units (as distinct from numbers of units) are considered - 53.67 per cent for sustainable use units against 46.33 per cent for fully protected units. Overall, however, sustainable units prevail over fully protected ones.
Table 2: Distribution of the Areas of Federal Conservation Units, per Groups - situation in late 2010.
group / numbers of units absolute area (hectares)
area (% of the total area of federal conservation units)
fully protected (131) 35,601,408.13 46.33 sustainable use (173) 41,247,363.17 53.67
total 76,848,771.30 100
Source: CNUC/MMA (July 2010)
Box 2
Number of fully protected federal units in 2006: 126; in 2010: 131 (+ 3.9 per cent) Number of sustainable use federal units in 2006: 161; in 2010: 173 (+ 7,4 per cent) Area (ha) of fully protected federal units in 2006: 32,767,840.36; in 2010: 35,601,408.13 (+ 8.6 per cent)
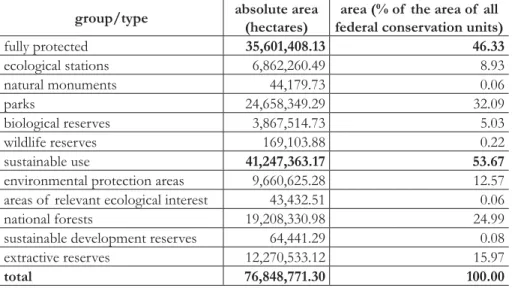
The data in Table 3 also show that the contributions of the different types of units to the total area under federal protection vary sharply. Large numbers and the large average sizes of national forests and extractive reserves continue to account for the growing predominance of the group of sustainable use units. The fully protected national parks contribute the largest share of all protected areas. Ecological stations are the second most extensive fully protected units.
Table 3: Distribution of the Areas of Federal Conservation Units, by Group and Type of Unit – Situation in late 2010.
group/type absolute area (hectares)
area (% of the area of all federal conservation units)
fully protected 35,601,408.13 46.33
ecological stations 6,862,260.49 8.93
natural monuments 44,179.73 0.06
parks 24,658,349.29 32.09
biological reserves 3,867,514.73 5.03
wildlife reserves 169,103.88 0.22
sustainable use 41,247,363.17 53.67
environmental protection areas 9,660,625.28 12.57 areas of relevant ecological interest 43,432.51 0.06 national forests 19,208,330.98 24.99 sustainable development reserves 64,441.29 0.08 extractive reserves 12,270,533.12 15.97
total 76,848,771.30 100.00
Source: CNUC/MMA (July 2010).
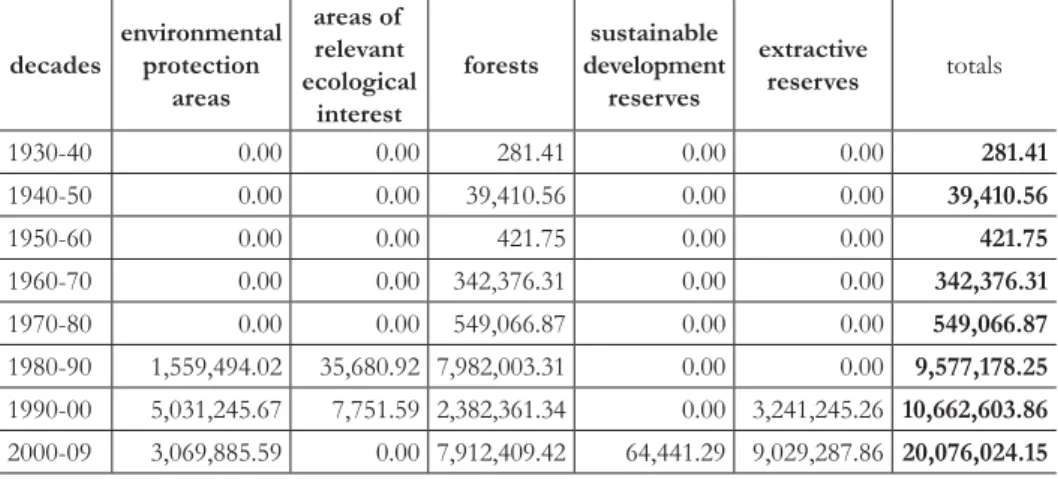
Data collected in Tables 4 and 5 (below) refer to the areas of units created per decade and per type and show how the trend of placing relatively more areas under full protection was reverted for the fi rst time in the 1980s. This became
Table 4: Areas of Fully Protected Federal Conservation Units Created, by Type and by Decade (1930-2009) (hectares).
decades ecological stations natural monu-ments parks biological reserves wildlife refuges total
1930-40 0.00 0.00 217,800.52 0.00 0.00 217,800.52
1940-50 0.00 0.00 0.00 0.00 0.00 0.00
1950-60 0.00 0.00 574,830.63 0.00 0.00 574,830.63
1960-70 0.00 0.00 344,966.09 0.00 0.00 344,966.09
1970-80 0.00 0.00 4,460,800.76 794,867.06 0,00 5,255,667.82
1980-90 2,591,603.54 0.00 5,198,465.57 1,691,036.14 142.39 9,481,247.64
1990-00 21,389.62 0.00 1,359,859.70 961,451.65 0.00 2,342,700.96
2000-09 4,249,267.34 44,179.73 12,501,626.01 420,159.89 168,961.49 17,384,194.46
Source: CNUC/MMA (July 2010).
Table 5: Areas of Sustainable Use Federal Conservation Units Created, by Type and by Decade (1930-2009) (hectares).
decades environmental protection areas areas of relevant ecological interest forests sustainable development reserves extractive reserves totals
1930-40 0.00 0.00 281.41 0.00 0.00 281.41
1940-50 0.00 0.00 39,410.56 0.00 0.00 39,410.56
1950-60 0.00 0.00 421.75 0.00 0.00 421.75
1960-70 0.00 0.00 342,376.31 0.00 0.00 342,376.31
1970-80 0.00 0.00 549,066.87 0.00 0.00 549,066.87
1980-90 1,559,494.02 35,680.92 7,982,003.31 0.00 0.00 9,577,178.25
1990-00 5,031,245.67 7,751.59 2,382,361.34 0.00 3,241,245.26 10,662,603.86
2000-09 3,069,885.59 0.00 7,912,409.42 64,441.29 9,029,287.86 20,076,024.15
Source: CNUC/MMA (July 2010).
Graph 5: Areas of Each Type of Federal Conservation Unit, as Percentages of the Total Federally Protected Area – situation in 2010.
Source: CNUC/MMA (July 2010).
The data presented in Graph 6 and in Tables 6 and 7 (below) allow us to correlate information about numbers and areas for each type of unit. National parks, national forests and extractive reserves have both the largest numbers of units and the largest cumulative areas. Areas of relevant ecological interest, sustainable development reserves and natural monuments have almost negligible weights. The fi rst type, despite numbering 17 (5.59 per cent of the total number
Graph 6: Number of Federal Conservation Units created until 2010, by type.
Source: CNUC/MMA (July 2010).
Table 6: Federal Conservation Units – numbers and percentages, by type – situation in 2010.
group / type absolute number of units
% over total number of units
fully protected 131 43.09
ecological stations 31 10.20
natural monuments 2 0.66
parks 64 21.05
biological reserves 29 9.54
wildlife refuges 5 1.64
sustainable use 173 56.91
environmental protection areas 31 10.20 areas of relevant ecological interest 17 5.59
forests 65 21.38
sustainable development reserves 1 0.33
extractive reserves 59 19.41
Total 304 100.00
Table 7: Numbers and Areas of Federal Conservation Units, by Type – situation in 2010 (hectares).
group / type number
of units total area
smallest
area largest area
average area
fully protected 131 35,601,408.13 142.39 3,865,118.53 271,766.47 ecological stations 31 6,862,260.49 276,98 3,373,133.89 221,363.24 natural monuments 2 44,179.73 17,443.43 26,736.30 22,089.86 parks 64 24,658,349.29 3,958.47 3,865,118.53 385,286.71 biological reserves 29 3,867,514.73 562.57 938,720.95 133,362.58 wildlife refuges 5 169,103.88 142.39 128,048.99 33,820.78 sustainable use 173 41,247,363.17 9.47 2,895,942.35 238,424,06 environmental
protection areas 31 9,660,625.28 884.16 2,060,332.70 311,633.07 areas of relevant
ecological interest 17 43,432.51 9.47 13,177.01 2,554.85 forests 65 19,208,330.98 89.19 2,895,942.35 295,512.78 sustainable
development reserves
1 64,441.29 64,441.29 64,441.29 64,441.29
extractive reserves 59 12,270,533.12 601.44 1,288,642.88 207,975.14
total 304 76,848,771.30 9.47 3,865,118.53 252,792.01
Source: CNUC/MMA (July 2010).
The data contained in Graphs 7 and 8 (below) display the numbers and areas (partial and cumulative) of the conservation units created until 2010. They confi rm that conservation units expanded swiftly during the last three decades.
Graph 7: Numbers and Areas (in millions of hectares) of Federal Conservation Units created per decade until 2010.
Source: CNUC/MMA (July 2010).
Graph 8: Areas (in millions of hectares) of Federal Conservation Units created per decade, until 2010.
3.1.2 Regional Distribution
Let us examine now the regional distribution of Brazil’s federal conservation units. It was stated earlier that the system followed a general course from the coast to areas of the more remote interior, in terms of physical geography, and from urban-metropolitan areas to rural and frontier areas, in terms of human and economic geography.7 This entailed a sharply unbalanced regional redistribution.
Most older federal units were plotted relatively close to major urban centers. Looking at the fi rst 16 national parks created between 1937 and 1961, three were
coastal and fi ve were inside or very close to urban-metropolitan areas. Three
(Araguaia, Emas and Chapada dos Veadeiros) were plotted in then remote areas of the interior, but their locations were defi ned primarily by what was supposed
to be the area of infl uence of the new national capital, Brasília, inaugurated in
1960. Thus, these three parks do not express a genuine policy move towards creating units in the remote interior. Ubajara, Aparados da Serra, São Joaquim and Caparaó, although not literally coastal, are located within a few hours of car drives from major coastal cities. This trend infl uenced also one of the three only
parks created in the early 1970s. Serra da Bocaina is coastal. Serra da Canastra and Tapajós were plotted in remote sections of the interior, but they still did not result from a policy change, as the fi rst was plotted on the headwaters of the
mighty São Francisco River and the second was ancillary to the construction of the Transamazon highway.
Only in 1979 did the system turn decisively towards Brazil’s vast interior, especially its sparsely settled rural and frontier areas. This resulted from the aforementioned adoption of several new location criteria – the protection of large and well-preserved areas, ecological representativeness and the relative rarity of formations and landscapes. These criteria and others were stated in two ground breaking internal documents drafted by the park agency. (IBDF and FBCN, 1979; 1982). This inverted the prevailing logic and changed the system’s profi le. New
units migrated to the “backlands”, grew in size and protected distinct, carefully selected natural settings. Although this directive was already - or became - common in many countries, it was innovative for Brazil.
Table 8: Distribution of Federal Conservation Units by Region – situation in 2010.
regions number of units % of units
North 115 37.83
Northeast 68 22.37
Southeast 56 18.42
South 37 12.17
Midwest 20 6.58
Midwest-North a 3 0.99
Midwest-South a 1 0.33
Midwest-Southeast-South a 1 0.33
Northeast-North a 2 0.66
Northeast-Southeast a 1 0.33
total 304 100
a Eight units lie in transition areas between regions.
Source:CNUC/MMA (July 2010).
A fi ner tuning of the data on geographical distribution allows several
insights. The most widely disseminated of the fully protected units are national parks, present in 33 states (of Brazil’s 26 states) or on state boundaries. The corresponding fi gures for ecological stations and biological reserves are 20 and 17.
The states of the North region are leaders in acreages of fully protected federal units. The four states with the smallest areas of fully protected federal units are Northeastern - Alagoas, Paraíba, Sergipe - and Southeastern - São Paulo.8
The most disseminated sustainable use units are national forests and environmental protection areas (22 states or state boundaries). Extractive reserves, often thought to be exclusively Amazonian, can be found in no less than 17 states (there are coastal units, affecting communities of artisanal fi shermen and their fi shing areas). In terms of the acreage of sustainable use areas, again the states
of the North Region are leaders, although several other states have considerable acreages protected by them. Again Northeastern states (Sergipe, Rio Grande do Norte e Piauí) lead the list of those with the lowest acreage of sustainable use units.
A new regional distribution of federal conservation units thus resulted from the criteria adopted in 1979, but it still deserves improvements by means of the creation of new units in under-represented regions.
8 São Paulo hosts an expressive number of fully protected state units, absent or rare in the three
3.1.3 Distribution by Biomes
Are federal conservation units well distributed among Brazilian biomes? To answer this, we must check if the 1979 stated goal of ecological representativeness of the conservation unit system was achieved. As protected area policies around the world moved beyond the emphasis on exceptional landscapes and aesthetically appealing plant and animal species, emphasis shifted to the protection of all biomes and natural formations. This was supported by the science of ecology, improved mapping instruments on continental and global scales, and by the accumulation of knowledge about the wide variety of natural landscapes and ecological processes. All natural features and formations thus gained “citizenship” for inclusion in protected areas and related nature protection policies. (WORSTER, 1998; GROOM et al, 2006).
Since the late 1960s, Brazilian scientists concerned with conservation, like Alceo Magnanini, pointed out that some Brazilian ecosystems and formations were missing from the country’s still modest conservation unit system and that there were no plans to include them (MAGNANINI, 1970). The ground breaking IBDF 1979 and 1982 master plans were outgrowths of Magnanini’s concerns and of the extensive rounds of fi eldwork that helped him identify “missing” ecosystems and
formations. More recently, the 1992 Convention on Biological Diversity - CBD, of which Brazil was one of the fi rst signatories, required the protection of signifi cant
portions of the different biomes inside each country. In 2002, the Global Strategy for Plant Conservation (an outgrowth of the CDB) set quantitative goals for this requirement. These goals were supported a year later by the V World Congress of National Parks (Durban, 2003) and in 2004 by 7th CBD Conference (Kuala Lumpur). In Brazil, quantitative goals were set in a 2006 document entitled National Biodiversity Plan. Brazil pledged to protect at least 10 per cent of each biome, a
fi gure raised to 30 per cent for the Amazonia biome.9 An executive decree (5,758,
April 13, 2006) confi rmed that Brazil would pursue these goals.
Figure 1: Brazilian Terrestrial Biomes - Amazonia, Cerrado (savanna), Caatinga (dry scrub forest), Atlantic Forest, Pantanal (swamplands) and Pampa (grasslands).
Source: IBGE, 2003. Available at http://www.ibge.gov.br/mapas_ibge/default.php or at http://www.ibge.gov.br/home/presidencia/noticias/noticia_visualiza.php?id_noticia=169
T able 9: Brazilian Continental Biomes – Absolute and Relative Areas.
biomes approximate area (ha) % of the area of Brazil
Amazonia 419,694,300 49.29
Cerrado 203,644,800 23.92
Atlantic Forest 111,018,200 13.04
Caatinga 84,445,300 9.92
Pampa 17,649,600 2.07
Pantanal 15,035,500 1.76
total area of Brazil 851.487.700 100%
Are these six Brazilian biomes covered in a balanced manner by federal conservation units? Units cover 76,848,765.00 hectares (about 9.02 per cent of the Brazilian territory; another 5,923,889.00 hectares affect transitional areas). A remarkable and positive fact is that units are found in each of the six continental biomes and in the Marine biome. Data organized in Table 10 (below) show the proportions of each biome protected by federal units.
Table 10: Areas (absolute and percentages) of Brazilian Biomes Protected by Federal Conservation Units – situation in 2010.
biomes approximate total area (ha)
approximate area of federal conservation
units (ha)
% of the biome protected by federal
conservation units
Amazonia 419,694,300.00 61,922,078.00 14.75
Cerrado 203,644,800.00 5,883,831.00 2.89
Atlantic Forest 111,018,200.00 3,488,903.00 3.14
Caatinga 84,445,300.00 3,399,941.00 4.03
Pampa 17,649,600.00 463,266.00 2.62
Pantanal 15,035,500.00 149,859.00 1.00
Marine --- a 1,540,887.00 --- a
totals 851,487,700.00 76,848,765,00 9.03
a No consensual area is attributed to this biome, making it impossible to compute the
percentage that is protected. Source: CNUC/MMA (July 2010).
There is a strong degree of imbalance among the protected percentages of each biome. Five of the six fi gures in the last column of Table 10 are quite
low and disparate from each other. Also, extreme fi gures are very distant from
each other – the Amazonia biome has 413 times more protected area than the Pantanal biome. Taking 10 per cent as an acceptable fi gure, the only adequately
Amazonia and Marine biomes; 5 (523,924.00 ha) are plotted between Caatinga and Cerrado biomes; 2 (334,612.00 ha) are located between Caatinga, Cerrado and Marine biomes; 2 (8,380.00 ha) lie between Caatinga and Marine biomes; 3 (491,218.00 ha) affect areas between Cerrado and Marine biomes; 1 (4,774.00 ha) is found between Cerrado and Atlantic Forest biomes; fi nally, 29 (1,402,570.00
ha) are located between the Atlantic Forest and Marine biomes. (CNUC/MMA (July 2010). Although these transitional units were not necessarily designed as such, their locations probably enrich the amount of biodiversity protected by the Brazilian conservation unit system as a whole.
Graph 9 (below) illustrates the distribution of the total area of federal units among biomes. Again the situation is unbalanced, as Amazonia alone hosts 80.57 per cent. It is too high a fi gure for the sake of a balanced status among biomes,
even considering that Amazonia is Brazil’s largest biome and has the country’s largest conservation units.
G raph 9: Distribution of the Areas of Federal Conservation Units, by Biome – situation in 2010 (in %).
Source: CNUC/MMA (July 2010).
3.2. STATE CONSERVATION UNITS10
This section examines briefl y the general situation of conservation units
created by Brazilian states, including the Federal District. Most state units are
10 Municipal units were excluded from our analysis because information about their types,
numbers and areas contains much uncertainty and has not been fully added to the database being used. In late 2009, however, the Brazilian Census agency recorded 689 municipal units, adding up to approximately 10,000,000 hectares, a fi gure that seems excessive to us. Source:
latecomers in the history of Brazilian conservation policies, but some of the most striking recent changes in the national conservation unit system have happened at the state level.11
According to the data in Table 11 (below), in 2010 there were 615 state conservation units, with a total area of 75,540,950.48 hectares.12 These fi gures
are quite signifi cant, because the number of state units (615) more than doubles
that of federal units and their combined area closely matches the total area of federal units (76,848,771.30 hectares). These are quite recent developments, which happened or were recorded only over the last half-decade. Thus, the combined area of federal and state units (152,389,721.78 hectares) now reaches the impressive
fi gure of 17.8 per cent of the Brazilian territory.
Table 11: State Conservation Units in Brazil – Groups, Types, Numbers and Areas – situation in 2009.
group type number of conservation units % of all state units area (ha)
% of the area of state units
fully protected
ecological stations 58 9.43 4,796,846.39 6.35 natural
monuments 13 2.11 62,599.41 0.08 parks 195 31.71 9,063,804.27 12.00 biological reserves 29 4.72 1,358,291.05 1.80 wildlife refuges 7 1.14 128,249.61 0.17 sub-total 302 49.11 15,409,790.73 20.40
sustainable use
environmental
protection areas 187 30.41 33,230,809.62 43.99 areas of relevant
ecological interest 25 4.07 37,278.89 0.05 forests 45 7.32 13,889,585.43 18.39 sustainable
development reserves
28 4.55 10,914,292.76 14.45
extractive reserves 28 4.55 2,059,193.06 2.73 sub-total 313 50.89 60,131,159.75 79.60
total 615 100 75,540,950.48 100
much larger than those of fully protected ones – 79.6 versus 20.4 per cent, although the balance between the numbers of units of the two groups of units is almost even – 49.1 versus 50.9 per cent). Until recently many state governments openly resisted the creation of federal conservation units in their territories and “dragged their feet” in the creation of their own units. A common compromise solution – recorded in Table 11 - is the creation of numerous state environmental protection areas. They are the second most numerous type of state unit and the one that accounts for the single largest share of the area protected by them (43.99 per cent). The fi rst reason for this is that they are the most “permissive” type of
conservation unit in Brazil. Factories, farms, roads, dams, transmission lines, ducts and even entire cities can be included in them, enhancing their acceptance by many social groups. Protection of natural features (commonly remnant or degraded) has a low priority. The second reason is that these units, besides being “politically cheap”, are also fi nancially cheap. They require no buy-outs of private properties
or indemnifi cation for installations.13
The data in Table 11 show also a strong imbalance between the numbers of some types of state units and their cumulative areas. This expresses a strong bias against fully protected units. The most striking example is given by the two most numerous types of units, state parks and environmental protection areas. There are 195 state parks (31.71 per cent of all state units) and 187 state environmental protection areas (30.41 per cent), but this balance is contrasted by the fact that parks comprise only 12 per cent of the total area of state units, against 43.99 per cent of the second. Biological reserves are few (29, or 4.7 per cent of state protected areas) and small on the average (1.8 per cent of the area of all state units). There is only one state biological reserve that can be considered large - Maicuru, in Pará, with 1,173,274.69 hectares, 86 per cent of the area of all such state reserves. Ecological stations, also fully protected, are numerous (58, or 9.4 per cent), but are typically small, protecting 4,796,846.39 hectares (6.35 per cent of the area of all state units). Again, the sole exception occurs in the state of Pará, in which the Grão-Pará unit, with 4,203,563.41 hectares, concentrates 87% of the area of all state ecological stations.
The bias in favor of sustainable use units is evident also in the fi gures for
state forests (7.3 per cent of the state units and 18.4 of the area of state units), extractive reserves (4 per cent and 2.8 per cent, respectively) and sustainable development reserves (4 per cent and 28 per cent, respectively). It is remarkable that the 28 state sustainable development reserves cover more area than the 195 state parks.
13 Carvalho 2004 addresses the management of the numerous environmental protection areas in
The next point to examine is how the different types of state units are distributed throughout the states in terms of numbers and areas. There are several features to be highlighted about the 302 fully protected state units. One of them is their strong regional and state concentration, as illustrated by the following data:
• Only four states lack any fully protected units of their own creation - Alagoas, Piauí, Sergipe (Northeast) and Roraima (North);
• Two states, Acre (North) and Sergipe (Northeast) created only one fully protected unit each;
• São Paulo (57), Minas Gerais (51) and Paraná (33) are the three states with the largest numbers of fully protected state units – 46.69 per cent of all state units (probably these three rich states have stronger capabilities for creating and managing conservation units);
• Mato Grosso (with 26 units, or 8.61 per cent of the total), a Midwestern state, is the next in the list of leaders, lessening the regional concentration mentioned in the previous item;
• Rio Grande do Sul and Rio de Janeiro come next, with 19 and 16 units, respectively;
• 21 other states have less than ten units each, for a total of 100 (33 per cent); • Curiously, in all states that have their own fully protected units, parks are always the most numerous type.
In reference to the areas of these same 302 state units, regional concentration is even stronger:
• Three states have more than 1,000,000 hectares under full protection: Pará, Amazonas and Mato Grosso, with respectively 34.9, 23.7 and 10.3 per cent (adding to 68.9 per cent) of the area of fully protected state units;
• Rondônia, São Paulo and Acre, with 6,35%, 5% e 4,5%, respectively, are the next in the ranking of areas;
these two types of units are not necessarily large. In São Paulo they cover only 4.2 per cent of the state territory. The corresponding fi gures for Minas Gerais and
Paraná are even slimmer, 1.0 and 0.32 per cent. Other comparisons yield intriguing results – the 8 fully protected state units of the huge state of Amazonas, although extensive in size, occupy only 0.8 per cent of the state territory, while the smaller state of Acre has 4.5 per cent of its territory covered by its single state park.
A surprising development is the state of Mato Grosso’s high rankings in both the number of fully protected state units and in their combined area. This is in stark contrast with the state’s systematic ranking as national champion in terms of deforestation rates, numbers of forest fi res, and areas of native landscapes
converted to agriculture.
Let us examine now sustainable use state units. There are 313 of them. They add up to 60,131,159.75 hectares and are found in 26 states.
• As noted earlier, environmental protection areas are the most numerous type (185), followed by forests (45) and sustainable development reserves and extractive reserves (28 each);
• More than half (55.26 per cent, 33,230,809.62 hectares) of the combined area of sustainable use units is under environmental protection areas;
• Another 41.25 per cent are protected by state forests (23.10 per cent, 13,889,585.43 hectares) and sustainable development reserves (18.15 per cent, 10,914,292.76 hectares);
• Bahia is the state with the largest number of environmental protection areas (32), but Pará responds for the largest area under this type of unit;
• Maranhão created only environmental protection areas in the sustainable use group. There are seven of them and they add up to 10 per cent of the area on this type of unit created by all states;
• São Paulo has the largest number of state forests (11), but Pará, Amazonas and Amapá are responsible for the largest share of the combined area of these units (91 per cent);
• Amazonas has the largest number of sustainable development reserves and 90 per cent of the combined area of this type of unit;
3.3 BRAZIL AND THE GOALS OF THE CONVENTION ON BIOLOGICAL DIVERSITY - CBD
As explained above, in 2006 Brazil pledged (under the infl uence of the CBD)
to protect 10 per cent of each of its biomes and 30 per cent of the Amazonia biome with conservation units. Table 12 (below) brings together data on the distribution of federal and state conservation units among Brazilian biomes. The data show that those goals have been achieved only partially. Amazonia is close to reaching its intentionally infl ated goal of 30 per cent, but Pampa and Pantanal
biomes remain severely under protected. Remaining biomes are fairly close to the goal of 10 per cent. However, note that in each biome the areas of sustainable use units surpass the areas of fully protected ones (the exception is the Pantanal biome). Considering the total area of conservation units (last line in Table 12), sustainable use prevails over full protection on a ratio of 2 to 1.
Table 12: Distribution of the Areas of Brazilian Federal and State Conservation Units, by Biome – situation in 2010.
biomes
area under full protection (ha)
(1)
area under sustainable use (ha) (2)
Total (1) + (2)
% of the biome under
protection
Amazonia 40,808,081 72,652,886 113,460,967 27.03
Caatinga 859,192 5,277,424 6,136,616 7.27
Cerrado 5,811,057 10,773,725 16,584,782 8.15
Atlantic Forest 2,423,476 7,292,632 9,716,108 8.75
Pampa 189,888 422,892 612,780 3.47
Pantanal 439,325 0 439,325 2.92
Marine 480,175 4,958,975 5,439,150 --- a
totals 51,011,198,86 101,378,522,92 152,389,721,78
---(a) It is impossible to compute the protected percentage of the Marine biome, because
there is no consensual defi nition of its size. Source: CNUC/MMA (July 2010).
importance of conservation units in which human presence or activities are scarce or non-existent (MILANO, 2002).
Table 13: Numbers and Areas of Federal and State Conservation Units, by Group and Type – situation in 2010.
group type area (ha) number of units
fully protected
ecological stations 11,659,106.88 89 natural monuments 106,779.14 15
parks 33,722,153.56 259
biological reserves 5,225,805.79 58 wildlife refuges 297,353.50 12
sub-total 51,011,198.86 433
sustainable use
environmental protection
areas 42,891,434.90 218
areas of relevant
ecological interest 80,711.39 42
forests 33,097,916.41 110
sustainable use reserves 10,978,734.04 29 extractive reserves 14,329,726.18 87
sub-total 101,378,522.92 486
totals 152,389,721.78 919
Source: CNUC/MMA (July 2010).
The number of sustainable use units grows substantially from 486 to 1,426 when the 940 private reserves are added to the picture, although the combined area of these private units is comparatively small - 673,983 hectares.14
4 CONCLUSION
Brazil’s conservation unit policy has existed for more than 70 years. It created roots, went through at least two deep conceptual changes (the 1979 plan and the 2000 law), interacted increasingly with foreign and international concepts, experiences and proposals, besides creating and improving management tools and strategies. An impressive amount of land and associated resources have been placed
14 Source: Cadastro Nacional de RPPNs: (http://www.reservasparticulares.org.br/relatorios/),
under different degrees of protection. This text examined only selected dimensions of the Brazilian conservation unit system, marked mostly by improvements. For other important dimensions in which lie the most serious problems – such as the units’ personnel qualifi cations, salaries and numbers, their land tenure status,
their management councils, their management plans, their visitation fi gures, their
installations, their support to scientifi c research, their management partnerships
etc. – data is lacking for the entire set of federal and state and federal conservation units. These dimensions will be analyzed in future texts as consolidated data become available.
We conclude that the expansion and more balanced distribution of the numbers and areas of conservation units are not enough to support the adequate protection of Brazil’s biomes, ecosystems, landscapes, communities, populations, species and genetic materials. Threats are strong and mounting – continuing conversion of native formations, habitat destruction and fragmentation, over-exploitation of native fl ora and fauna, invasions by exotic organisms, pollution,
contamination etc. Highly relevant is that Brazil, the probable world “champion” of biodiversity, lacks (in the company of almost all tropical countries) an extensive inventory of its biotic endowment. Basic and applied research in ecology, biology, conservation biology, geology and biogeography are required, but this is not the mission of the conservation unit system. Nonetheless, the system is present in hundreds of ideal locations and can provide support for such a grand research effort.
However, biodiversity protection requires priority for natural or ecological dimensions, even if they may be locally at variance with social or developmental concerns and directives. In this respect, there is an important shortcoming in the fi gures of the last column of Table 12 - they do not record fully protected
areas exclusively. If we consider only fully protected conservation units (column 1), Brazil’s stated protection goals are much more distant from being fulfi lled.
Indeed, with the exception of the Pantanal biome, all biomes are protected mostly by sustainable use units, which, by defi nition, do not offer the same degree of
Only fully protected units can achieve a satisfactory level of biodiversity protection. Sustainable use units are adequate for achieving social goals, but for the purpose of protecting biodiversity they should be considered as merely complementary to fully protected units, together with private lands subjected to restricted uses, indigenous homelands, escaped slave settlements (“maroon” communities) and even military areas. All these other protected areas are useful mainly as connections or “stepping stones” between fully protected units.
If Brazil honors its commitments to the CBD and its offshoots, especially by means of fully protected conservation units, it may achieve the status of a model (among others) for the large-scale conservation of tropical biodiversity (DOUROJEANNI; PÁDUA, 2001; MILANO, 2002; CÂMARA, 2002; TERBORGH; SCHAIK, 2002; DRUMMOND et al., 2006). Complementary strategies can and should also be deployed in order to lessen contradictions between the conservation of biodiversity and human needs – mosaics, ecological corridors, and biosphere preserves are some of them – not to mention dependable land tenure and technical support to poor rural dwellers. The proper management of sustainable use units is another requirement – sustainable activities must live up to their name. Also, the laws that require wise land and resource uses in private properties must be defended and more effectively enforced. These alternatives have a solid conceptual base in the ecosystemic approach defi ned in Decision V
of the 6th CBD Participant Meeting, held in Hague, in 2002, and in the framework
of bioregional management, developed since the 1960s by Kenton Miller (MILLER, 1997; DRUMMOND et al., 2006; ARRUDA, 2006; GANEM, 2006; ARAÚJO, 2007).
REFERENCES
ARAÚJO, M. A. R. Unidades de Conservação no Brasil – da República à Gestão de Classe Mundial. Belo Horizonte: Segrac, 2007.
ARRUDA, M. B. Corredores Ecológicos no Brasil: o enfoque ecossistêmico na implementação da Convenção da Biodiversidade. In: ARRUDA, M. B. (Orgs.). Gestão Integrada de Ecossistemas Aplicada a Corredores Ecológicos. Bra-sília: IBAMA, 2006.
CARVALHO, L. M. F. de. Gestão de Áreas de Proteção Ambiental no Estado da Bahia: Análise de um Modelo em Construção. 2004. Dissertação (Mestrado em Desenvolvimento Sustentável) – Universidade de Brasília. Brasília, 2004.
DEAN, Warren. With Broadax and Firebrand: the History and the Destruction of the Brazilian Atlantic Forest. Berkeley: University of California Press, 1995.
DINERSTEIN, E.; OLSON, D. M.; GRAHAM, D. J.; WEBSTER, A.; PRIMM, S.; BOOKBINDER, M.; FORNET, M.; LEDEC, G. A conservation assessment of the terrestrial ecoregions of Latin America and the Caribbean. Washington: World Wildlife Fund Report to the World Bank/LATEN, 1995.
DOUROJEANNI, Marc J. e PÁDUA, Maria Tereza Jorge. Biodiversidade: a hora decisiva. Curitiba: UFPR/Fundação O Boticário, 2001.
DRUMMOND, J. A. Brazil. In: SHEPARD KRECH III, J. R.; McNEILL, C. M. (Eds.). Encyclopaedia of World Environmental History. New York: Routledge, 2004. p. 161-169.
DRUMMOND, J. A. et al. Brazilian Federal Conservation Units – a historical overview of their creation and of their current status. Environment and His-tory, v. 15, p. 463-491, 2009.
DRUMMOND, J. A. et al. O Estado das Áreas Protegidas no Brasil – 2005. Brasília: CDS, agosto de 2006. Disponível em: <http://www.unbcds.pro.br/ conteudo_arquivo/150607_2F62A6.pdf>
DRUMMOND, J. A. O Sistema Brasileiro de Parques Nacionais: análise dos resultados de uma política ambiental. Niterói: EDUFF, 1997.
GANEM, R. S. Corredores Ecológicos: o que são? In: ARRUDA, M. B. (Org.). Gestão Integrada de Ecossistemas Aplicada a Corredores Ecológicos. Brasilia: IBAMA, 2006.
GROOM, M. J.; MEFFE, G. K.; CARROLL, C. R. (Eds.). Principles of Con-servation Biology. 3. ed. Sunderland: Sinauer Associates, 2006.
IBGE-INSTITUTO BRASILEIRO DE GEOGRAFIA E ESTATÍSTICA. Mapa de Biomas Brasileiros, 2003. Disponível em: http://www.ibge.gov.br/ mapas_ibge/default.php; <http://www.ibge.gov.br/home/presidencia/noticias/ noticia_visualiza.php?id_noticia=169>. Acesso em: 23 out. 2011.
KLEIMAN, D. G.; RYLANDS, A. B. (Eds). Micos Leões – biologia e conser-vação. Brasília, MMA, 2008.
MACEDO, J. A. C. Avaliação da Gestão Participativa dos Parques Estaduais da Bahia. 2008. Dissertação (Mestrado em Desenvolvimento Sustentável) – Universidade de Brasília. Brasília, 2008.
MAGNANINI, A. Política e Diretrizes dos Parques Nacionais do Brasil. Rio de Janeiro Instituto Brasileiro de Desenvolvimento Florestal, l970.
MANN, C. C.1491 – New Revelations of the Americas before Columbus.
New York: Knopf, 2005.
MANN, C. C.1493 – Uncovering The New World Columbus Created. New York: Knopf, 2011.
MERCADANTE, M. Uma Década de Debate e Negociação: a História da Ela-boração da Lei do SNUC. In: BENJAMIN, A. H. (Coord.). Direito Ambiental das Áreas Protegidas. Rio de Janeiro: Forense, 2001.
MILANO, M. S. Por que existem as unidades de conservação? In: MILANO, M. S. (Org.). Unidades de Conservação: atualidades e tendências. Curitiba: Fundação O Boticário, 2002.
MILLER, K. Em busca de um novo equilíbrio. Brasília: IBAMA, 1997.
MILLER, S. W. An Environmental History of Latin America. Cambridge: Cambridge University Press, 2007.
MMA-Ministério do Meio Ambiente. Pilares para a Sustentabilidade Financeira do Sistema Nacional de Unidades de Conservação. Brasília: Ministério do Meio Ambiente, 2009.
MORSELLO, C. Áreas Protegidas Públicas e Privadas: seleção e manejo. São Paulo: Annablume; FAPESP, 2001.
PRIMACK, R.; RODRIGUES, E. Biologia da Conservação. Londrina: E. Rodrigues, 2001.
QUAMMEN, D. The Song of the Dodo – island biogeography in an age of extinctions. New York: Scribner, 1996.
SOULÉ, M. (Ed.). Conservation Biology: The Science of Scarcity and Diversity. Massachusetts: Michigan, 1986.
TERBORGH, J.; SCHAIK, C. van. Why the World Needs Parks. In: TER-BORGH, J.; SCHAIK, C. van; DAVENPORT, L.; RAO, M. (Orgs.). Making Parks Work Strategies For Preserving Tropical Nature. Publisher: Island Press, 2002.
VILLAROEL, L. A evolução da política de criação de unidades de conservação no estado do Amazonas no período de 1995 a 2010. 2012. Dissertação (Mestrado em Desenvolvimento Sustentável) – Universidade de Brasília. Brasília, 2012
WILSON, E. The Future of Life. New York: Vintage, 2002.