Working Paper CEsA CSG 166/2018
PORTUGAL AND THE
EURO
1
António MENDONÇA
Abstract
This paper is divided in two parts. In the first part, we present some data of the Portuguese economy aiming to capture some of its main long trends and the way it reacts to the introduction of the single currency in Europe. Since Portugal follow a similar path with Spain in what concerns the European economic integration process, we developed a comparative analysis between the two Iberian countries trying to capture some dynamics that can aid to understand the different ways how the two economies reacted to the introduction of the euro and, in this phase of the economic integration in Europe, how they suffered the 2007-2008 international crisis and reacted to its effects. To evaluate and compare the two countries paths we use some fundamental macroeconomic indicators as, output and employment, investment, external accounts, budget balances and government debts. The comparison with Europe's average economic performance is also present, trying to understand which country follow a more “European path”.
In the second part, we concentrate on the euro system crisis trying to give some contributes to the ongoing discussion about the role and effectiveness of the euro as an internal adjustment variable. Not only in terms of the pre-creation of the better conditions for the European economy to respond to cyclical and structural crisis processes, but also in terms of dealing with the developments of the real crisis process that explode in Europe in 2007-2008 and gave origin to what was called the “sovereign debt crisis” that deeply harmed the most week economies, like Portugal but also like Spain. In particular, we discuss the issue of the effectiveness versus the exhaustion of monetary policy followed by the ECB in response to the Eurozone effects of the global economic and financial crisis.
Keywords
Portugal, Spain, Euro, Financial Crisis, Unconventional Monetary Policy
WORKING PAPER
CEsA neither confirms nor informs any opinions expressed by the authors in this document.
CEsAis a research Centre that belongs to CSG/Research in Social Sciences and Management that is hosted by the Lisbon School of Economics and Management of the University of Lisbon an institution dedicated to teaching and research founded in 1911. In 2015, CSG was object of the international evaluation process of R&D units carried out by the Portuguese national funding agency for science, research and technology (FCT - Foundation for Science and Technology) having been ranked as “Excellent”.
Founded in 1983, it is a private institution without lucrative purposes, whose research team is composed of ISEG faculty, full time research fellows and faculty from other higher education institutions. It is dedicated to the study of economic, social and cultural development in developing countries in Africa, Asia and Latin America, although it places particular emphasis on the study of African Portuguese-speaking countries, China and Pacific Asia, as well as Brazil and other Mercosur countries. Additionally, CEsA also promotes research on any other theoretical or applied topic in development studies, including globalization and economic integration, in other regions generally or across several regions.
From a methodological point of view, CEsA has always sought to foster a multidisciplinary approach to the phenomenon of development, and a permanent interconnection between the theoretical and applied aspects of research. Besides, the centre pays particular attention to the organization and expansion of research supporting bibliographic resources, the acquisition of databases and publication exchange with other research centres.
AUTHOR
António MENDONÇA
Professor of Economics at ISEG-Lisbon School of Economics & Management Universidade de
CONTENTS
INTRODUCTION ... 5
1.PORTUGAL AND SPAIN: SOME LONG-TERM TENDENCIES AND THE EURO ... 6
1.1.OUTPUT DYNAMICS ... 7
1.2.UNEMPLOYMENT DYNAMICS ... 12
1.3.1. PUBLIC INVESTMENT ... 19
1.4. BUDGET BALANCES ... 21
1.5.PUBLIC DEBTS ... 24
1.6.EXTERNAL BALANCES ... 26
1.6.1. NET LENDING – NET BORROWING ... 28
1.7.ADDITIONAL REMARKS ... 29
2. EFFECTIVENESS VERSUS EXHAUSTION OF THE MONETARY POLICY OF THE ECB: THE USE AND ABUSE OF THE SO-CALLED “UNCONVENTIONAL MEASURES” ... 32
2.1.THE FOUR PHASES OF DEVELOPMENT OF THE UNCONVENTIONAL MONETARY POLICY . 34 A.First phase: direct liquidity injection in the market (September 2008 - June 2014) ... 35
B.Second phase: approaching the role of “lender of last resort” (June 2014 – March 2016) . 39 C.Third phase: the liquidity trap (March 2016 - ….) ... 42
2.2.THE LIQUIDITY TRAP: SOME CONSIDERATIONS USING THE IS/LM MODEL ... 44
2.3.EXOGENEITY VERSUS ENDOGENEITY OF MONEY SUPPLY ... 49
3.FINAL REMARKS ... 53
Figures:
FIG. 1: THE MONETARY POLICY TRANSMISSION MECHANISM ("NORMAL" FUNCTIONING) ... 37
FIG. 2:THE MONETARY POLICY TRANSMISSION MECHANISM (MALFUNCTIONING) ... 38
FIG. 3: THE “BYPASS” OF UNCONVENTIONAL MONETARY POLICY ... 42
FIG. 4: “NORMAL” SIMULTANEOUS EQUILIBRIA IN BOTH THE MARKETS FOR GOODS AND SERVICES (IS) AND MONEY (LM) ... 46
FIG. 5: “ABNORMAL” SIMULTANEOUS EQUILIBRIUM ... 47
FIG. 6:THE ROLE OF FISCAL POLICY ... 49
Charts: CHART 1: REAL GDP: 1961 – 2019, % ANNUAL CHANGES (2018 AND 2019: FORECASTS) ... 9
CHART 2: REAL GDP: ANNUAL AVERAGE RATES, PERIODS: 1960 - 1974; 1975 – 1985; 1986 – 1998; 1999 – 2014; 2015, 2017, 2018 AND 2019, 2018 AND 2019: FORECASTS ... 11
CHART 3: REAL GDP: 1960 – 2019, ANNUAL INDEX - 1999 = 100, (2018 AND 2019: FORECASTS) ... 11
CHART 4: UNEMPLOYMENT RATES: 1960 – 2019 (2018 AND 2019: FORECASTS) ... 16
CHART 5: GROSS FIXED CAPITAL FORMATION AT 2010 PRICES: 1961 – 2019, ANNUAL CHANGES (%) (2018 AND 2019: FORECASTS) ... 17
CHART 6: GROSS FIXED CAPITAL FORMATION (VOLUME): 1960 – 2019, ANNUAL INDEX - 1999 = 100 (2018 AND 2019: FORECASTS) ... 18
CHART 7: GROSS FIXED CAPITAL FORMATION /GDP (%): TOTAL ECONOMY (2010 PRICES), 1960 – 2019 (2018 AND 2019: FORECASTS) ... 19
CHART 8: GROSS FIXED CAPITAL FORMATION/GDP (%): GENERAL GOVERNMENT (CURRENT PRICES), 1960 – 2019 (2018 AND 2019: FORECASTS) ... 21
CHART 9: NET LENDING (+) OR NET BORROWING (-): GENERAL GOVERNMENT (PERCENTAGE OF GDP AT CURRENT PRICES (EXCESSIVE DEFICIT PROCEDURE) ... 23
CHART 10: NET LENDING (+) OR NET BORROWING (-) EXCLUDING INTEREST: GENERAL GOVERNMENT. (PERCENTAGE OF GDP AT CURRENT PRICES (EXCESSIVE DEFICIT PROCEDURE) ... 23
CHART 11: STRUCTURAL BALANCE OF GENERAL GOVERNMENT: - ADJUSTMENT BASED ON POTENTIAL GDP EXCESSIVE DEFICIT PROCEDURE (PERCENTAGE OF POTENCIAL GDP AT CURRENTE PRICES) .... 24
CHART 12: GENERAL GOVERNMENT CONSOLIDATED GROSS DEBT (PERCENTAGE OF GDP AT CURRENT PRICES (EXCESSIVE DEFICIT PROCEDURE) ... 25
CHART 13:BALANCE ON CURRENT TRANSACTIONS WITH THE REST OF THE WORLD (NATIONAL ACCOUNTS) (PERCENTAGE OF GROSS DOMESTIC PRODUCT AT CURRENT PRICES) ... 28
CHART 14:NET LENDING (+) OR NET BORROWING (-): TOTAL ECONOMY (PERCENTAGE OF GROSS DOMESTIC PRODUCT AT CURRENT PRICES) ... 29
CHART 15: INFLATION IN THE EURO AREA ... 51
CHART 16: MONEY CREATION SEQUENCE... 51
INTRODUCTION
This paper has a double aim. First, we want to discuss some aspects of the long-term development of the Portuguese economy in order to better understand the way it reacted to the main consequences of the international financial crisis and the subsequent impacts at the Eurozone level. Second, we want to discuss the role of the monetary policy that has been adopted by the ECB, in order to deal with the asymmetries that have been produced in the Eurozone, particularly in the context of the so-called “sovereigndebt crisis”.
Having in mind these objectives, we divided the paper in two parts.
In the first part, we present some data of the Portuguese economy aiming to capture some of its main long trends and the way it reacts to the introduction of the single currency in Europe. Since Portugal follow a similar path with Spain in what concerns the European economic integration process, we developed a comparative analysis between the two Iberian countries trying to capture some dynamics that can aid to understand the different ways how the two economies reacted to the introduction of the euro and, in this phase of the economic integration in Europe, how they suffered and reacted to the 2007-2008 international crisis effects. To evaluate and compare the two countries paths we use some fundamental macroeconomic indicators as, output and employment, investment, external accounts, budget balances and government debts. The comparison with Europe's average economic performance is also present, trying to understand which country follow a more “European path”.
of dealing with the developments of the real crisis process that exploded in Europe in 2007-2008 and gave origin to what was called the “sovereign debt crisis” that deeply harmed the most week economies, like Portugal but also like Spain. In particular, we discuss the issue of the effectiveness versus the exhaustion of the so-called unconventional monetary policy followed by
the ECB in response to the Eurozone effects of the global economic and financial crisis.
1.
PORTUGAL AND SPAIN: SOME LONG-TERM TENDENCIES
AND THE EURO
In the aftermath of the democratization processes initiated, respectively, in 1974 and 1975, Portugal and Spain followed relatively similar paths with respect on the European economic integration options.
After the constitution of democratic constitutional governments, both countries started adhesion processes to the then called European Economic Communities which led to the simultaneous entry on the 1st January 1986. Since that date, they have always been together in
the fundamental steps towards the economic and monetary union, having shared the same vision about the importance of European integration for economic and social development of both countries, as well as the same desire to be in the forefront of the integration developments that have taken place and culminated in the creation of the euro.
events that have changed their economies functioning: i) a period before the crisis of the beginning of the 1970s, known as the oil crisis. A crisis which would mark the resurgence of liberal economic conceptions, in view of the exhaustion of Keynesian ideas and practices prevailing until then, and would have direct consequences in the very processes of democratization that began shortly thereafter; ii) a period that covered the preparation for adhesion to the Communities, which would extend from democratization to the end of 1985; iii) a period following the adhesion to the Communities until the introduction of the euro; iv) and, finally, the Euro period that also includes the effects of the great economic and financial crisis triggered by the particular crisis of the American subprime mortgage market.
Of course, these are arbitrary milestones, chosen according to the aims of the analysis. But they reflect the concern to identify decisive milestones of the structural changings of the functioning conditions of the two countries’ economies and, at the same time, extended enough to capture these changings.
1.1.
OUTPUT DYNAMICS
The need to rebuild the European economies created the conditions for a generalized acceptance of the idea of a strong state economic intervention, aimed at restoring the civil economy, restoring the levels of output and at absorbing the demobilized labour force. But the new political conditions in Europe, resulting from the defeat of Germany and strengthening of the Soviet bloc, also favoured the development of the new European projects of integration, the concern for growth and economic and social cohesion reducing, at the same time, the field of attraction of the more liberal ideas of the markets efficiency on the resources allocation, which, in fact, were in sharp decline since the 1930’s crisis.
The stability of growth in the almost three decades following the end of World War II, with average rates around 5% per year, the reduction of asymmetries within and between countries, the non-occurrence of serious crises such as those that occurred in the pre-war period, cemented the conviction that a new era of economic and social progress had begun, soon baptized by some authors as “post-cyclical capitalism”, wanting to reflect the idea that economic policy, inspired by Keynes' theory, had definitively overcome the "invisible hand" of neoclassical theorists.
For several reasons that it is not possible to develop within the scope of this intervention, the crisis of the 1970s represents an effective turning point in the functioning of the world economy and of the different countries’ economies which reflected, among other aspects, in the re-emergence of the economic cycle and in the general reduction of growth dynamics. The crisis of the 1970s was followed by the crisis of the 1980s, the crisis of the 1990s, the crisis of the beginning of the millennium and the crisis starting at the end of 2008, whose effects are still running.
Charts 1 and 2, below, show well what we said above, in what regards the economies of Spain and Portugal and also in what regards European Union and Euro zone. A declining trend, that accentuates after each crisis process, is well visible in each of the economies and in Europe as a whole.
Chart 1: Real GDP: 1961 – 2019, % annual changes (2018 and 2019: Forecasts)
Source: AMECO, Nov. 2017 -6
-4 -2 0 2 4 6 8 10 12 14
1961 1963 1965 1967 1969 1971 1973 1975 1977 1979 1981 1983 1985 1987 1989 1991 1993 1995 1997 1999 2001 2003 2005 2007 2009 2011 2013 2015 2017 2019
European Union (15 countries) Euro area (12 countries) Spain Portugal Linear (Euro area (12 countries)) Linear (Spain)
The trend is, however, more pronounced in the Portuguese economy which evolves from growth rates of more than 6% per year in the period prior to 1974, to a near stagnation after the entrance in the Eurozone, clearly beginning a diverging process from Europe.
As far as Spain is concerned, although we can detect a declining trend, which accentuates in the period that goes from the establishment of democracy to the adhesion to the Communities (1975-1985) reflecting, undoubtedly, the process of internal political adjustment, it is not so pronounced as the Portuguese trend. We can even see an inversion of relative positions after participation in the euro zone.
Chart 2: Real GDP: Annual average rates, Periods: 1960 - 1974; 1975 – 1985; 1986 – 1998; 1999 – 2014; 2015, 2017, 2018 and 2019, 2018 and 2019: Forecasts
Source: AMECO, Nov. 2017
To end the analysis of the output dynamics we highlight the effects of the adjustment program that was applied in Portugal between May 2011 and May 2014. If we look behind to find a year with an output level identical to the minimum reached in 2013 we need go back until 2000, practically the beginning of the euro. If we compare with the Spanish case the fall in output is much less significant with a decline to the level of 2005 (see Chart 3, bellow).
Of course, these falls provoked also deep structural changes in the economies of both countries with consequences that will persist for many years ahead. But it is not the aim of this paper to deal with this kind of problems. In any case, we will say that these effects can have direct consequences in terms of the conditions for growth sustainability, particularly in Portugal, a country with a not so strong economic base.
0 1 2 3 4 5 6 7 8
1960 1962 1964 1966 1968 1970 1972 1974 1976 1978 1980 1982 1984 1986 1988 1990 1992 1994 1996 1998 2000 2002 2004 2006 2008 2010 2012 2014 2016 2018
European Union (15 countries) Euro area (12 countries) Spain Portugal
Source: AMECO, Nov. 2017
1.2.
UNEMPLOYMENT DYNAMICS
Concerning the evolution of employment, the situations are also different between Portugal and Spain reflecting very different starting structural conditions and economic dynamics and, also, different economic policies priorities. And, above all, different adjustment dynamics to external shocks induced by the adhesion to the European economic integration process and by the economic crisis processes that have been produced in the meantime.
It is interesting to note the relatively low unemployment rates in the period ending in 1974 (less than 3%). Portugal verifies in this period a minimum rate of 1.7% in 1974 reflecting not only the post-war economic dynamism and the economic policy priorities of the time, centred on the goal of full employment, but also the emigration phenomenon to Europe and the
0 20 40 60 80 100 120 140 160
1960 1962 1964 1966 1968 1970 1972 1974 1976 1978 1980 1982 1984 1986 1988 1990 1992 1994 1996 1998 2000 2002 2004 2006 2008 2010 2012 2014 2016 2018
military mobilization to the colonial war. And is interesting to note also the explosion of unemployment in the aftermath of the crisis of the 1970s, accentuated by the political upheavals that took place in both countries after 1974 and 1975 and which, in the case of Spain, reaches historical proportions over a period spanning more than 20 years, with unemployment rates systematically above 15%, reaching a peak in 1994 with unemployment rate at 22% of active population and declining from that point on, until reaching a minimum in the year immediately prior to the 2007 crisis with 8.2% of the labour force.
Portugal experiences a different situation from Spain with unemployment contained at substantial low levels, despite the military demobilization following the end of the colonial war, the reduction of the emigration flows and the arrival of hundreds of thousands of returned people from the former colonies of Africa. The peak of unemployment is reached in 1985, the year before the adhesion to the European Communities, with an employment rate of 9,8% of active population, while reflecting the adjustment program agreed with the IMF for the period 1983 – 1985 (see Chart 4 bellow).
On the other hand, Spain, despite some inflection, continues to face high rates of unemployment, reaching as already mentioned, an historical peak in 1994, with 22% of unemployed people.
Unlike Portugal, Spain has experienced a stronger structural adjustment process, of economic renewal and modernization, while Portugal has witnessed the beginning of a resources transferring process to the non-tradable goods sector, fuelled by the injection of European funds and easy access to credit, which artificially secured unemployment, but inhibited the in-depth restructuring of the productive sector.
Since the second half of the 1990s, the process of structural adjustment in Spain seems to have ended, with a decline in unemployment, a trend that continues after the creation of the euro, despite the cyclical increase resulting from the beginning of the millennium crisis, to reach a record low of 8,2% in the year immediately prior to the crisis in 2007. From here, an exponential increase occurs, with unemployment rate reaching in 2013 the impressive peak of 26,1% of the active population.
As far as Portugal is concerned, the evolution is completely different. In throughout the period from adhesion to the creation of the euro, Portugal has rates of unemployment substantially below the European average, including during the years of recession in the first half of the 1990s. This situation is completely changed from the third year of the creation of the euro in 2002, when an ascending trajectory of unemployment begins reaching a historic peak in 2013 with a 16,4% rate of unemployment. A Chart that would substantially be higher did not have the emigration to Europe and to the ex-colonies working as exhaust valve returning to levels close to the 1960s.
The Spanish better economic performance, which seems to have positively reacted to the creation of the new European currency, contrary to what seems to have happened with Portugal, is reflected in a better behaviour of unemployment which reduces substantially until the outbreak of the 2007’s international crisis.
Chart 4: Unemployment rates: 1960 – 2019 (2018 and 2019: Forecasts)
Source: AMECO, Nov. 2017
1.3.
INVESTMENT PERFORMANCE
Charts 5, 6, 7 and 8 seek to capture the evolution of investment, through the behaviour of Gross Fixed Capital Formation, the total economy and government in particular. In this case too, there are substantial differences between the economic dynamics of the two countries.
The first finding that results from the observation of the behaviour of this economic variable in the two countries is the greater volatility in the Portuguese economy (Chart 5 bellow). Spain follows a more regular pattern, closer to the European average, whereas in Portugal there is a more erratic behaviour, with large fluctuations, showing certainly, a lower consistency of the Portuguese economy and a greater vulnerability to the evolution of demand or dependence on economic policy.
0 5 10 15 20 25 30
1960 1962 1964 1966 1968 1970 1972 1974 1976 1978 1980 1982 1984 1986 1988 1990 1992 1994 1996 1998 2000 2002 2004 2006 2008 2010 2012 2014 2016 2018
Nonetheless, there is some similarity in terms of general trends in both countries and the European average. But once again, the creation of the euro has changed everything.
In both countries, in the period up to 1974, there is a trend towards higher rates of investment, compared to the European average, reflecting a catching up process. In the following period (1975 – 1985) we can see a decline, more pronounced in Spain, once again to recover from 1985 onwards and during the post-adhesion period, with the exception of the crisis of the early 1990s where, as one would expect, there is a further decline.
Once again, after the introduction of the euro, the paths of the two countries have diverged significantly. Spain maintains relatively high rates of investment progress, above the European average, only interrupted by the 2008 crisis, while Portugal faces a period of loss of investment dynamism, with systematically negative growth rates, reflecting a structural disinvestment trend that sporadic recoveries in some years are not enough to counteract.
Chart 5: Gross fixed capital formation at 2010 prices: 1961 – 2019, Annual changes (%) (2018 and 2019: Forecasts)
Source: AMECO, Nov. 2017 -25
-20 -15 -10 -5 0 5 10 15 20 25
1961 1963 1965 1967 1969 1971 1973 1975 1977 1979 1981 1983 1985 1987 1989 1991 1993 1995 1997 1999 2001 2003 2005 2007 2009 2011 2013 2015 2017 2019
European Union (15 countries) Euro area (12 countries) Spain Portugal
Chart 6 bellow, is particularly illuminating in the investment performance of both countries, showing the Spain's relative good investment performance that continues after the euro until the arriving of the 2007 crisis stopped everything. In the case of Portugal, we can see clearly the declining trend of investment that develops from 2001 and which is accentuated by the crisis. If we look at the year 2013, we see that Portugal declined to investment levels similar to those of 1989, while Spain has fallen much less to 1999-2000 levels, in line with previous trends.
Chart 6: Gross fixed capital formation (Volume): 1960 – 2019, Annual Index - 1999 = 100 (2018 and 2019: Forecasts)
Source: AMECO, Nov. 2017
Chart 7, which shows the weight of GFCF on GDP, also illustrates the dynamics of investment in both countries. All of what was said above said has a concentrated expression
0 20 40 60 80 100 120 140 160 180
1960 1962 1964 1966 1968 1970 1972 1974 1976 1978 1980 1982 1984 1986 1988 1990 1992 1994 1996 1998 2000 2002 2004 2006 2008 2010 2012 2014 2016 2018
here, with the catching up phenomenon being clearly evident in both countries up to 1974, when they reach a ratio GFCF on GDP of around 25%, slightly higher than the European average, to follow up the general decline during the following 10 years, between 1975 and 1985.
With the adhesion to the Communities, begins a new upward trend which, in the case of Spain, accentuates in the post-euro period, until reaching a maximum of 29.6% of GDP in 2007. Portugal already sees the peak of GFCF in 2000, with a GDP weight of approximately 26%, declining from there to a low of 15% in 2013, that compares with around 20% in Spain and 19.3% and 19.6% in the EU 15 and EA 12, respectively.
Chart 7: Gross fixed capital formation /GDP (%): total economy (2010 prices), 1960 – 2019 (2018 and 2019: Forecasts)
Source: AMECO, Nov. 2017
1.3.1. PUBLIC INVESTMENT
0 5 10 15 20 25 30 35
1960 1962 1964 1966 1968 1970 1972 1974 1976 1978 1980 1982 1984 1986 1988 1990 1992 1994 1996 1998 2000 2002 2004 2006 2008 2010 2012 2014 2016 2018
European Union (15) Euro Area (12) Spain Portugal
Chart 8: Gross fixed capital formation/GDP (%): general government (current prices), 1960 – 2019 (2018 and 2019: Forecasts)
Source: AMECO, Nov. 2017
1.4. BUDGET BALANCES
In what concerns public finances, the performances of the two countries are very different, in result of the distinctive economic dynamics discussed above (See Chart 9 bellow).
Spain has shown a remarkable capacity for rebalancing public accounts, which has manifested since the beginning of the second half of the 1990s, being able to adjust deficits exceeding 7% of GDP into surpluses, starting in 2004 and reaching a value of 2% in the years immediately prior to the crisis, 2006 and 2007.
As far as Portugal is concerned, there is an adjustment in the period leading up to the euro, reflecting the concern for compliance with the Maastricht criteria. This is followed by swings that evolve towards a further deterioration in 2004 and 2005 to more than 6% of GDP, pushed by the crisis situation at the beginning of the new millennium. The new government
0 1 2 3 4 5 6 7
1970 1972 1974 1976 1978 1980 1982 1984 1986 1988 1990 1992 1994 1996 1998 2000 2002 2004 2006 2008 2010 2012 2014 2016 2018
European Union (15) Euro area (12) Spain Portugal
has succeeded in correcting it, reaching the targets one year earlier than agreed in 2008 (values in real time).
In both cases, the crisis has led to an understandable deterioration in budget balances to levels around 10 - 11% of GDP in 2009 and 2010, plunging the two countries into deep fiscal crises, giving strength to the sovereign debt crises thesis in peripheral countries.
Chart 9: Net lending (+) or net borrowing (-): general government (Percentage of GDP at current prices (excessive deficit procedure)
Source: AMECO, Nov. 2017
These same trends are evident in the numbers of the primary deficit (Chart 10, bellow), with Portugal, unlike Spain, registering primary surpluses in 2013 and 2014, reflecting the more drastic fiscal adjustment in relation to that was verified in the neighbour country.
Chart 10: Net lending (+) or net borrowing (-) excluding interest: general government. (Percentage of GDP at current prices (excessive deficit procedure)
-12 -10 -8 -6 -4 -2 0 2 4
1995 1996 1997 1998 1999 2000 2001 2002 2003 2004 2005 2006 2007 2008 2009 2010 2011 2012 2013 2014 2015 2016 2017 2018 2019
European Union (15 countries) Euro area (12 countries) Spain Portugal
Euro
-10 -8 -6 -4 -2 0 2 4 61995 1996 1997 1998 1999 2000 2001 2002 2003 2004 2005 2006 2007 2008 2009 2010 2011 2012 2013 2014 2015 2016 2017 2018 2019
In what concerns structural deficits, Portugal and Spain, as we can see on Chart 11 bellow, don’t match the commitments and it is possible to see some difficulties after 2014, when the economies began to recover. Of course, we are in presence of a controversial concept that needs more discussion, but in so far as it is a requirement of the Stability Pact it is possible to anticipate here a source of additional problems that can be used with political objectives.
Chart 11: Structural balance of general government: - Adjustment based on potential GDP Excessive deficit procedure (Percentage of potencial GDP at currente prices)
Source: AMECO, Nov. 2017
1.5.
PUBLIC DEBTS
The better overall performance of public accounts in Spain, as a result of the better overall economic performance in the period of the euro existence, is also present in the public debt behaviour, which shows a sustained reduction path from the peak of 65.6%, reached in 1996, to a 35.5% ratio, in the year immediately prior to the 2007 crisis. In contrast, Portugal having maintained the average debt around the 50% ratio of GDP, i.e., inside the Maastricht
-9 -8 -7 -6 -5 -4 -3 -2 -1 0
2010 2011 2012 2013 2014 2015 2016 2017 2018 2019
criteria, throughout all the period of European Union membership until 2000, when this debt reaches a minimum of 50.3% of GDP, it suffers a strong inversion of this reduction trajectory and the beginning of an upward trend that leads the debt to 68.4% of GDP in 2007, almost the double of that one registered in Spain (See Chart 12, bellow).
As has been the case in Europe in general, the crisis has triggered debt in both countries, reaching levels of 97.7% and 130.2% in Spain and Portugal, respectively, face a European average of 92% and 95% %, in the EU15 and EA12. What is important to emphasize in this case is once again the difference between the two countries structural dynamics, with Spain debt deteriorating as a direct consequence of the crisis, while Portugal verifies an accentuation of a trend that came from the past, seeing all the fragilities accumulated during the euro phase become more evident.
Chart 12: General government consolidated gross debt (Percentage of GDP at current prices (excessive deficit procedure)
Source: AMECO, Nov. 2017 0
20 40 60 80 100 120 140
1970 1972 1974 1976 1978 1980 1982 1984 1986 1988 1990 1992 1994 1996 1998 2000 2002 2004 2006 2008 2010 2012 2014 2016 2018
European Union (15 countries) Euro area (12 countries) Spain Portugal
1.6.
EXTERNAL BALANCES
In the case of both countries, external adjustment seems to have been the most successful objective since Spain and Portugal managed to move from high current account deficits, which reached peaks of 9.3% of GDP in 2007, in the first case, and 11.4% in 2008, in the second case, to surplus from 2013 onwards (Chart 13, bellow). To a large extent, the success of this adjustment lies in the decrease of economic activity that has taken place in both countries in the aftermath of the crisis and the austerity measures that have been adopted which caused a sharp fall in imports. But other factors have also played a role, both on the export side and on the import side, in particular the fall of the oil prices.
In any case, the adjustment in these countries is similar to the one that took place more generally in the euro area and which has resultedin a reduction of the imbalance that had been accumulated over the years, and particularly since the creation of the euro, between the current account of Germany and the current accounts of the generality of the euro zone countries.
Chart 13:Balance on current transactions with the rest of the world (National accounts) (Percentage of gross domestic product at current prices)
Source: AMECO, Nov. 2017
1.6.1. NET LENDING
–
NET BORROWING
Notwithstanding the need of a deeper analysis of the reasons that led to this apparent success of the ability to balance external accounts and the degree of their sustainability in the case of a stronger economic recovery, it is an evident fact that relieved external pressures by generating net lending capacity in both countries, starting in 2012 and following the European trend (Chart 14).
-20 -15 -10 -5 0 5
1960 1962 1964 1966 1968 1970 1972 1974 1976 1978 1980 1982 1984 1986 1988 1990 1992 1994 1996 1998 2000 2002 2004 2006 2008 2010 2012 2014 2016 2018
European Union (15 countries) Euro area (12 countries) Spain Portugal
Chart 14:Net lending (+) or net borrowing (-): total economy (Percentage of gross domestic product at current prices)
Source: AMECO, Nov. 2017
1.7.
ADDITIONAL REMARKS
From the brief comparison that has been made of the evolution and performances of the two Iberian economies, it is possible to draw some conclusions that, of course, need further study.
The first and perhaps the most significant conclusion is that both Spain and Portugal are following the general trend in Europe for the loss of economic dynamism that has been running since the crisis of the early 1970s but that has become more pronounced after the creation of the euro. In any case, the loss of dynamism seems lower in Spain than in Portugal. Spain seems
-14 -12 -10 -8 -6 -4 -2 0 2 4 6
1971 1973 1975 1977 1979 1981 1983 1985 1987 1989 1991 1993 1995 1997 1999 2001 2003 2005 2007 2009 2011 2013 2015 2017 2019
European Union (15 countries) Euro area (12 countries) Spain Portugal
average during this period, while the Portuguese economy practically stagnates, entering a period of clear divergence from the European average.
The second conclusion has to do with the differentiated role that unemployment seems to play in the two economies as an adjustment variable. Unemployment seems to be much more sensitive to economic cycles in Spain, possibly in result of different priorities of economic policy and the different functioning of the labour market vis-à-vis Portugal. Here too one can see the great difference between Spain and Portugal in reaction to the euro creation. Spain shows a better capacity to adapt to the new conditions, with a reduction of unemployment, only interrupted as a consequence of the crisis, while Portugal shows a loss of general economic dynamism that provoked the rise of unemployment in counter-cycle of the rest of Europe, a trend that the crisis only strengthened.
The third conclusion recognizes the better overall investment performance, in the case of Spain, including public investment, which is most evident in the period as European Communities membership, including in the euro phase. In Portugal, on the contrary, after some initial post-addition euphoria there is a significant loss of dynamism in this component of the output, which accentuates in the euro phase, including at public investment level. A symptom of this difference in performances is the fact that in 2014, in the aftermath of the effects of the international crisis, Spain has returned to the investment levels, measured by the GFCF, registered in 1999-2000, while Portugal returned to levels similar to those verified in 1989.
procedure, opened in 2005, to an end, one year earlier than it had agreed with the European Commission. There is also a less "austere" attitude in Spain regarding fiscal policy, which is certainly due to the slack allowed by the excellent pre-crisis performance, but also to the fact that it has managed to keep the country out of any direct intervention from the Troika, with the exception of the banking sector. In which concerns public debt, Spain verifies the general trend of post-crisis Europe, also in this case revealing a more relaxed situation than Portugal whose problems precede the crisis and are in line with its overall economic performance.
The fifth conclusion concerns external accounts. Once again it is evident the better overall performance of Spain but, curiously, both countries converge to a similar balance deterioration during the period of the euro. In Portugal and Spain, we see an increase of the current accounts imbalances. The adjustment verified in both countries, in the aftermath of the 2009 crisis, follows the general trend towards a rebalancing in Europe, with a reduction of Germany's surpluses in parallel with the reduction of the deficits of its euro partners. But above all this adjustment reflects the strong decline in domestic economic activity, and it is still to early for demonstrating its sustainability, particularly in the event of a significant resumption of the economic activity.
The sixth remark is more a comment than a conclusion. The estimates and projections for 2017 and for 2018 and 2019 point towards a certain strengthening of the ongoing economic recovery. But uncertainties are still present at the horizon and the risk of inversion of the present dynamics is high. That’s the main reason why the central banks keep the fundamental references
Finally, we can conclude from the significant difference in economic performances of the two countries over the last three or four decades, both shaped by significant changes in the international economic system and by shocks of diverse nature that profoundly affected the domestic and international dynamics of the different economies. In this period, Spain has shown a remarkable ability to adapt and take advantage of new situations, with particular emphasis in what concerns the functioning of the new European currency phase. On the contrary, Portugal has shown greater difficulties in adapting to the new demands of international competition, and these difficulties have been accentuated following the introduction of the single European currency, of which it was also a founding member like Spain. Certainly, the reasons behind the economic history of the two countries largely explain these differences, but one cannot exclude, on one hand, different domestic economic options, which have resulted in different uses of the opportunities offered by the accession to the European project and, on the other hand, different situations of vulnerability in the face of the progressive inefficiency of the institutions and internal adjustment mechanisms of the European Union, which were aggravated by the creation of the euro. Spain saw its economy strengthened. On the contrary, Portugal saw its vulnerabilities become more pronounced.
2.
EFFECTIVENESS
VERSUS
EXHAUSTION
OF
THE
MONETARY POLICY OF THE ECB: THE USE AND ABUSE OF
THE SO-
CALLED “UNCONVENTIONAL MEASURES”
prejudice to this primary objective, the ESCB supports the economic policies of the Union, considering the fulfilling of the objectives of this Union as defined in Article 3 of the Treaty on European Union. Of note among these objectives is point 3 of the Article which sets out growth and economic principles, based on price stability. The goal of full employment is also mentioned but at a secondary level and subordinated to the fulfilment of the main objective. The role of the ESCB in this context is to define and implement the monetary policy of the Union, through short-term interest rates management, thus influencing the development of economic conditions in order to ensure mid-term price stability in the euro area. Price stability is defined in terms of the annual increase in the Harmonised Index of Consumer Prices (HIPC), at a rate close but below 2% over the medium term. As monetary policy instruments, the ECB uses open market operations, designed to manage liquidity in the banking system and signal the stance of monetary policy, standing facilities, designed to provide or absorb liquidity in the overnight market, and reserve requirements, designed to maintain stabilization of interest rates in the money market and to create or enlarge a structural liquidity shortage. This is what is considered the conventional monetary policy tools.
Following the effects deepening of the international economic and financial crisis the ECB decided to improve the tool box of the monetary policy using more and more the so-called unconventional measures, to the exact extent of the loss of effectiveness of the so-called conventional measures.
The discussion will develop in four steps in addition to this introduction. First, we will consider the increasing use of unconventional monetary policy by the ECB as an answer to de deepening of the crisis and the inability of the European authorities and national governments to deal with its main consequences. Second, we discuss the so-called “liquidity trap” hypothesis in the context where the unconventional monetary policy brought the interest rates to the zero lower bound at which they still find themselves to this day. Finally, we recall the endogeneity
versus exogeneity hypotheses of money supply.
2.1.
THE FOUR PHASES OF DEVELOPMENT OF THE UNCONVENTIONAL MONETARY
POLICY
A.
First phase: direct liquidity injection in the market (September 2008 - June
2014)
With the introduction of this new type of measures, the ECB widened the range of intervention possibilities in managing the crisis, expanding the toolbox available to deal with the operational needs of the monetary and financial system. However, simultaneously, it pushed the limits of its own field of intervention, statutorily established in the treaties of the Union, in particular concerning the financing of states and public institutions, and approaching the traditional intervention of central banks as lenders of last resort.
This evolution of the ECB regarding the conduct of monetary policy in the context of the European crisis has led to a number of serious divergences between European leaders, which have deepened since then, with the Bundesbank and the German government being their main opponents. A situation that has led the main heads of the ECB to refine the theoretical argument and the practical justification in which to frame the progressive adoption of less and less "conventional" measures, especially that of the Vice-President, Vítor Constâncio, who has had the most active role in this respect (see, in particular, Constâncio, 2011, 2013, 2015a, 2015b and 2016).
The main argument for unconventional monetary policy is the idea that the conventional monetary policy transmission mechanism ceased to function properly, as a result of the dysfunctions produced in the financial markets, and proved itself unable to contain the deflationary pressures that followed the crisis and, consequently, failed to properly secure the objective of price stability - an inflation rate below but close to 2%.
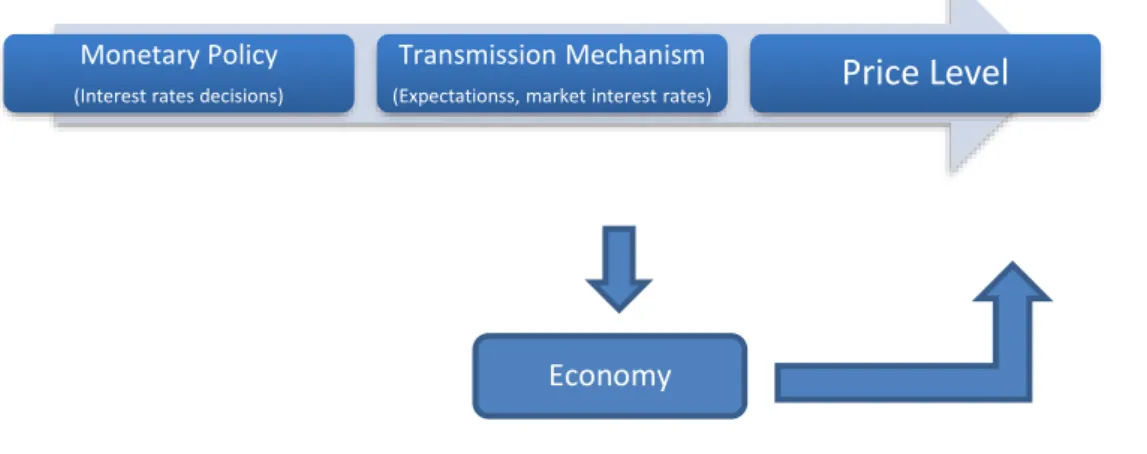
Fig. 1: The Monetary Policy Transmission Mechanism ("Normal" functioning)
This process can be disturbed by several factors that are not controllable by monetary policy, namely variation in risk premiums, changes in bank capital that affect their credit conditions, changes in the economic environment and in the global economy, changes in fiscal policy or changes in commodity prices. These are called shocks outside the control of the central bank.
At the same time, even in normal conditions, the transmission mechanism is characterized by operating dynamics that are somewhat lengthy, variable and uncertain, particularly in contexts where shocks outside central bank control become dominant. This has been the case with the economic and financial crisis triggered on 2008, making monetary policy uncertain in its effects or, in extreme cases, completely ineffective.
In this extreme situation, there has been a malfunction of the mechanism transmitting central bank decisions to the economy that has distorted or even prevented the arrival of the effects, at least in the desired way, to the ultimate goal of the ECB, which is the level of prices. This malfunction justified the adoption of exceptional measures, designated "unconventional",
Monetary Policy
(Interest rates decisions)
Transmission Mechanism
(Expectationss, market interest rates)
Price Level
Fig. 2:The Monetary Policy Transmission Mechanism (Malfunctioning)
According to the official justification of the ECB, the basis of the adoption of unconventional monetary policy was the malfunctioning of some segments of the financial markets that have prevented normal financing of the economy, thus disturbing the operating of the transmission mechanism (Fig. 3). Direct supply of liquidity to the market by the ECB seeks to prevent the collapse of important financial institutions, with the central bank assuming the role of lender of last resort in a liquidity crisis context.
A second justification for the introduction of unconventional monetary policy refers to the nature and scope of the measures. In addition, this domain introduces the so-called "separation principle" (Constâncio, 2011).
According to this principle, there is a clear separation between the purposes of conventional and unconventional measures. Unconventional measures are complementary to the former in having clearly defined and temporally limited objectives. They are intended to ensure that disruptions in financial markets do not prevent the conventional policy from doing
Monetary Policy
(Interest rates decisions)
Transmission Mechanism
(Expectationss, market interest rates)
Price Level
the malfunctioning of the monetary policy transmission mechanism is evident and withdrawn as soon as this feature is recovered.
In this sense, and also according to the heads of the ECB, non-standard measures are distinct from the "quantitative easing" that is used by the Fed or the BoE, because they are not intended as a substitute for conventional interest rate policy in the context of "zero lower bound" or as a way to manage the "trade-off" between inflation volatility in the short run and price stability in the long run. Rather, unconventional measures are designed to ensure that the conventional measures are effective in all timeframes.
They work thus as a support mechanism to the conventional policy in a period of exception when disruptions in the normal financing channels of the financial system and of the economy manifest. They are no longer necessary when the situation normalizes and conventional monetary policy regains its effectiveness, and must therefore be removed. This is what automatically occurs in those situations, where financing operations have a defined time horizon and are not an object of explicit renewal. This was the case with the first measures adopted after the 2008 crisis that materialized in a hugedirect liquidity injection in the market
B.
Second phase: approaching the role of “lender of last resort” (June 2014 –
March 2016)
the actual economic and financial crisis, successive new "unconventional" measures were used, namely, liquidity provided at fixed rates, full liquidity allotment, extension of maturities for loans granted by the ECB, including those granted for very long terms, widened eligibility conditions for collateral, direct purchases of government bonds and mortgage bonds, decreased requirements for minimum reserves, in a continuous process growing in scale, the creativity of which tending to accelerate.
In June and September 2014 more unconventional measures were introduced, considered of a new class: two programs of assets purchased from the private sector – an Asset Backed Securities Purchase Program (ABSPP) and a third Covered Bond Purchase Program (CBPP3), adopted in order to allow selective intervention in the markets with decisive influence on the financing of the non-financial sector; and a new series of Targeted Long-term Refinancing Operations (TLTROs), up to 4 years, to improve bank lending to the non-financial private sector in the euro area. According to officials of the ECB, the measures marked a new phase in the development of unconventional monetary policy. A stage where the ECB clearly stated the willingness to actively expand the size of its balance sheet up to the levels needed to ease the monetary policy stance, in a situation where interest rates reached their lowest level.
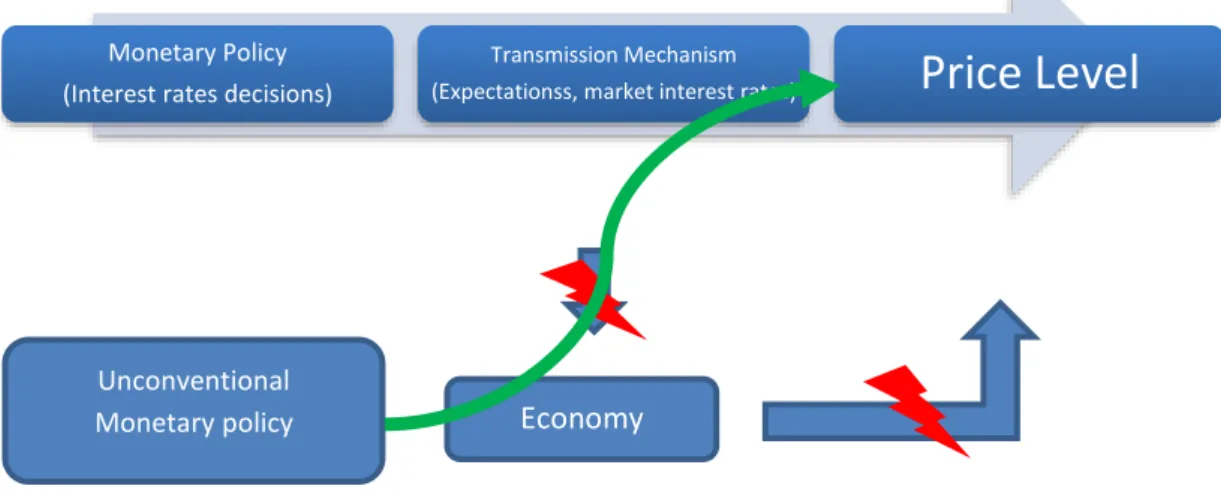
Fig. 3: The “bypass” of unconventional monetary policy
At the same time, the ECB aimed to create better conditions for the banking system itself to be able to make a correction of their balance sheets without this translating into a narrowing of credit for the economy.
It meant, in fact, a new attitude of the ECB involving a closer approach more of a "quantitative easing" stance, followed by the Fed and other central banks, in line with the role of "lender of last resort". A formally rejected stance, or at least not assumed up to here.
At the same time, these new measures also meant the ECB's commitment to the maintenance of low interest rates, in an extended time horizon, even beyond the achievement of economic recovery. A situation of inflation rate "overshooting" is even accepted, in the context of economic growth that is intended to encourage the use of these and other measures of an unconventional character.
C.
Third phase: the liquidity trap (March 2016 -
….)
Monetary Policy (Interest rates decisions)
Transmission Mechanism
(Expectationss, market interest rates)
Price Level
Economy
A third phase of unconventional monetary policy was opened following the decisions of the Governing Council meeting of March 10, 2016.
The "zero lower bound" is fully reached with the setting of the interest rate on the main refinancing operations at 0%. However, the most significant fact is the acceptance of the possibility of financing the economy at rates as low as the rate applicable to the permanent facility deposit existing at the operation start date – that is, at negative rates. This possibility is foreseen under the new target long-term refinancing operations (TLTRO II) in the case of banks exceeding a reference value of net credit provided to the economy.
With this decision, a new stage of intervention is opened. A real Pandora's Box from which no one truly knows what can result, despite all the declarations that monetary policy will continue to be able to use the interest rate instrument. The next step, with it still being necessary to reduce interest rates, can only be the setting of the main refinancing rate in negative territory. Which can only be considered as a denial of monetary policy theory, not to mention its actual practice.
The important question in this situation is this: will the unconventional monetary policy work? Despite all the positive reassurances on this issue, the reality is that the use of increasingly radical unconventional measures may only show otherwise. That is, unconventional monetary is entering a progressive exhaustion process in its ability to influence the economy in the desired direction, as a drug addict who requires increasingly stronger doses to address the symptoms of a disease, as the body will be used to the substance and the disease does not stop spreading.
2.2.
THE LIQUIDITY TRAP: SOME CONSIDERATIONS USING THE IS/LM MODEL
The analysis of the liquidity trap can be used as a reference for understanding the ongoing economic situation in Europe and also, with the necessary adaptations, the current situation of the global economy (see, among others, Krugman, 2012 and Temin & Vines, 2014). We are faced with significantly lower investment levels compared to pre-crisis levels. Furthermore, at the same time, interest rates have reached negative levels, if we refer to the banking system's relations with the ECB, with obvious effects over the non-financial sector.
The traditional IS/LM model, despite the simplifying assumptions that underpin it, can be a useful analytical framework for understanding what is happening to monetary policy, both in its conventional and unconventional components.
As it is known, the IS curve (Investment/Saving) is constructed from three relationships: the investment demand function; changes on aggregate demand as a result of changes on investment decisions when the interest rate varies; and the relationship between different levels of interest rate and output and the equality between savings and investment. On the other hand, the derivation of the curve satisfies the following propositions: an increase in the interest rate causes a reduction in investment demand, which in turn is reflected in an output reduction. The IS curve represents, therefore, the combinations of interest rate and output levels that ensure the equilibrium condition in the market of goods and services. That is, total demand
D, given the income level Y and the cost of credit i, equals the total supply Y, (D (Y, i) = Y), always bearing in mind the equality between investment and saving. Its slope is, therefore, negative, in the space of the interest rate and output dynamics.
money demand and interest rate; and the relation between the money market equilibrium (money demand and money supply balance) and the different levels of the real interest rate. The derivation of the LM curve conforms to the following propositions: an increase in output generates an increase in money demand which, in turn, generates an increase in the interest rate.
The LM curve represents, then, the different combinations of interest rate and level of output that ensure equilibrium in the money market. That is, the balance between money demand and money supply, Md (Y, i) = M/P, given the nominal supply of money M and the price
level P. The slope of the LM curve is therefore positive in the space of the interest rate and output dynamics.
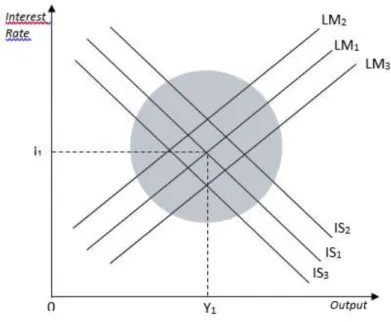
In "normal" conditions, simultaneous equilibrium in the market of goods and services and the money market produces a positive interest rate (i1) and a certain level of real output
(Y1). The equilibrium point is located graphically in the 1st quadrant, with movements to the left
Fig. 4: “Normal” simultaneous equilibria in both the markets for goods and services (IS) and Money (LM)
Consider, however, the case where the intersection of the IS/LM curves does not match in the 1st quadrant, but in the 4th quadrant. That is, a situation where theoretically the intersection occurs in an area of negative levels of interest rates for different output levels.
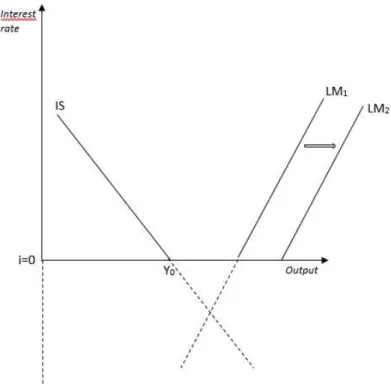
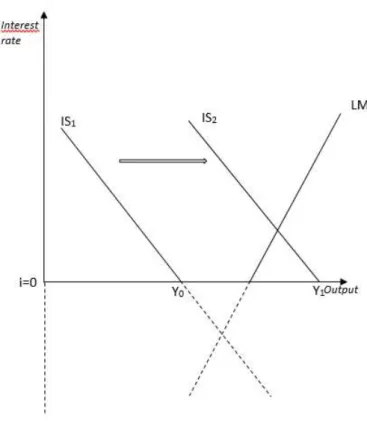
Fig. 5: “Abnormal” simultaneous equilibrium
In such a situation, represented in Fig. 5 above, equilibrium output is given by Y0 and the
interest rate is equal to 0. An increase in the money supply moves the LM curve to the right, (LM1 LM2) but has no effect on the interest rate that, at least theoretically, cannot go down
more. This means that investment can no longer be stimulated in this way. Monetary policy becomes ineffective.
and changes in autonomous money demand. The IS curve, in turn, is influenced by five factors: autonomous consumption spending, investment spending, government consumption, net exports and the level of taxes. This means that in a situation of monetary policy blocking, the IS curve can be shifted to the right, through the influence that fiscal policy directly or indirectly has on the economy through the operation of these channels.
The analysis using the IS/LM model can also explain the relationship between the two macroeconomic policies. Fiscal policy works through the economic relationship represented in the IS curve. In turn, monetary policy works through the relationship translated by the LM curve. However, as can be seen in Fig. 4, the LM curve only affects the economy when it intersects the IS curve with a positive interest rate. In a situation where the intersection between the two curves, theoretically, only operates in a negative interest rate zone, monetary policy become completely ineffective and the economy falls in the liquid trap.
Moreover, we come to the crux of the matter. Can monetary policy back to play a role in this situation?
No longer working through its normal channels, monetary policy may act indirectly facilitating the operation of fiscal policy to move the IS curve to the right (IS1 IS2) (Fig. 6). This
can be done through the accommodation of any public deficits, that result from the use of expansionary fiscal policy, through direct funding from the central bank.
Fig. 6:The role of fiscal policy
2.3.
EXOGENEITY
VERSUS
ENDOGENEITY OF MONEY SUPPLY
Another important issue for understanding the current situation relates to the discussion of the process of monetary creation by the economic system.
In the framework of the IS/LM model, the construction of the LM curve is associated with the hypothesis of exogenous money supply. That is, it is assumed that money supply is controlled by the central bank, being independent from the demand that results from the activity of economic agent.
the banks in their relations with economic agents. The money multiplier mechanism works between these, which is supposed to convey the changes in the monetary base, the central bank's responsibility, to the money supply, as represented in the movements in the LM curve.
This exogeneity of money supply, as described here, has always been controversial in economic theory. Moreover, the current situation involving the intervention of the ECB, in particular with its evident inability to influence the economy, with the desired strength, through its conventional and unconventional liquidity injections, has raised more doubts about this exogeneity hypothesis, giving strength to the opposite hypothesis of money supply endogeneity. That is, unlike the exogenous money supply hypothesis, banks first provide liquidity to the economy through the credit they grant and only then do they turn to the central bank for refinancing to establish the reserves needed to cover the deposits that they manage through lending. Therefore, the route is not from the central bank to the economy, but from the economy to the central bank.
Chart 15: Inflation in the euro area
The endogeneity hypothesis of money supply is very important and allows us to understand several difficulties that monetary policy is facing today.
Recalling the relation of the monetary base with lending by commercial banks, we can describe the following sequence:
Chart 16: Money creation sequence
Obviously, the demand for credit depends on the state of the economy and the level of confidence in the future by economic agents.
The fact that money supply can be considered endogenously determined means that the LM curve is horizontal for a given interest rate, the financing being elastic at this interest rate. The IS curve to the right (IS1 IS2) ceases to have any influence in determining the
interest rate. This situation is shown in Fig. 8, below.
Chart 17: Endogeneity of Money supply
policy obtains full importance. Somehow, this is what has happened in the Eurozone and other economic zones with the central banks expanding the reserves of the banking system beyond all limits through "quantitative easing", without having been able, at least until now, to expand the demand for funds by the non-financial sector as necessary to significantly influence the level of aggregate demand, as would be their intention.
3.
FINAL REMARKS
There is little left over to use regarding the "tool box" available by the ECB. And as regards what is left, only with a large degree of "elasticity" of interpretation will it fit within what the ECB is supposed to be able to do under the European Treaty and its own statutes.
An additional problem has to do with coordination of monetary policy with fiscal policy in the euro area. The former, increasingly oriented in an expansionary direction and the latter continuingly tied to a contractionary view, particularly with regard to the countries most affected by the crisis effects, more indebted and, therefore, more dramatically dependent on a stimulus demand to be able to get out of economic anaemia in which they find themselves.
There is, therefore, somewhat of a manifestation of an economic schizophrenia, which can be verified at the level of institutions with more responsibility in the conduct of international economic policies, particularly with regard to the ECB and the IMF.
policies should support economic recovery …", at the same time as affirming that “... while remaining in compliance with the fiscal rules of the European Union", to add at the end "at the same time, all countries should strive for a more growth-friendly composition of fiscal policies", ( Draghi, 2016a).
Discounting the aforementioned schizophrenia, evident in the contradictory statements between the call to use fiscal policy and the appeal for "compliance" with the rules of the Stability and Growth Pact, the ECB president's concern with the continued refusal of the use of fiscal policy in the euro area is clear, particularly by countries with economic surplus, with Germany at the head. But also, jointly by the EU and the euro area member states, as an instrument to streamline economic activity via aggregate demand stimulus. A situation that, if it continues, could accelerate even further the exhaustion process of monetary policy, both in its conventional and unconventional versions.
It is this awareness that justifies the growing concern of the ECB to build a theoretical and empirical justification for the need to promote public investment. There is a clear reorientation of economic studies in this direction, which also meet the need to provide institutional support to the Juncker Plan, "A new start for Europe", presented to the European Parliament on 15 July 2014, following his election as the new President of the European Commission.
short-term demand effects, including in short-terms of spill overs to other countries, with an anticipated accommodative monetary policy", and that " this finding strengthens the case for increasing public investment in the current low-inflation environment". Still following the study, it concludes that “... a debt or revenue financed increase in productive public investment implies
significantly larger short-term output gains compared with an increase in investment financed by cutting other public expenditure”. Conclusions which, however, do not seem to have
growth, some neo-liberal policies have increased inequality, in turn jeopardizing durable expansion.
This re-orientation of IMF concerns began to become evident in the WEO of October 2014 where, in the 3rd chapter it significantly raises the issue, "Is it time for an infrastructure push? The macroeconomic effects of public investment.", to give the answer “This chapter finds
that increased public infrastructure investment raises output in both the short and long term, particularly during periods of economic slack and when investment effectiveness is high. This suggests that in countries with infrastructure needs, the time is right for an infrastructure push: borrowing costs are low and demand is weak in advanced economies, and there are infrastructure bottlenecks in many emerg¬ing market and developing economies. Debt-financed projects could have large output effects without increas¬ing the debt-to-GDP ratio, if clearly identified infra¬structure needs are met through efficient investment.”
The OECD seems going in a similar direction when emphasising, in its Interim Economic Outlook, of February 16, 2016, following the recognition of the weak economic growth, that “A
strong collective policy response is urgent. Global macroeconomic policy, comprising monetary, fiscal and structural actions, must become more supportive of demand and resource allocation. Experience to date suggests that reliance on monetary policy alone has been insufficient to deliver satisfactory growth, so that greater use of fiscal and structural levers is required”.
However, if this intervention has proved crucial, it has also contributed to the accumulation of tensions that cyclically threaten to explode pushing the economy to limit situations. It is precisely these tensions accumulation dynamics that has driven ECB intervention toward increasingly unconventional measures.
However, these unconventional measures have not found, until now, the necessary support in terms of fiscal and budgetary policies, which continue to manifest a resistance to meet the real needs of the economy. Instead, as these policies continue to focus on issues of fiscal balance and public debt, they have acted in the opposite way, demanding more and more from monetary policy that, by its very nature, is limited in its ability to deal with all the problems that affect the economy.
It is, precisely, this contradiction between the stances of fiscal and monetary policies that has boosted the effect of exhaustion of monetary policy, discussed in this essay.
When called upon to use less and less conventional instruments, monetary policy that is supposed to be followed by the ECB reveals its weak institutional architecture and its inconsistent theoretical framework. While not being completely negative, in that it has enabled pragmatism in response to the crisis, the use of increasingly unconventional measures pushed monetary policy towards a boundary zone where it has begun to deny itself, when it accepted within its toolbox the use of negative interest rates.
To conclude, we will say that what is at stake in how Europe and the Eurozone in particular have reacted to the crisis, is the euro system itself.
accentuating these, denying the verification of the optimistic endogeneity hypothesis for the monetary area.
Within this perspective, ideas that point to a solution of a "more Europe" kind to address the problems do not seem realistic. This view runs the risk of accentuating the removal of decisions from the concrete realities of countries, strengthening theoretical approaches to the detriment of reality analyses and the power of distant bureaucracies to the detriment of agents subject to the direct scrutiny of citizens. This, ultimately, can lead to the denial of the very concept of economic and monetary integration applied to the reality of Europe and the Eurozone.
A general review of the euro system is therefore, justified in order to adjust it to the current dynamics of the different European economies and to their joint participation in the global economy. Furthermore, the immediate recovery of all rights of citizenship for fiscal policy is also justified in order to curb the monetary policy exhaustion process and enable it to bring back the economy to a sustained area reversing the stagnation tendencies that affect it.
A final word to the recovery of the European economy that seems finally to be running more firmly since the middle of 2016. There will be little doubt about the positive role that the ECB intervention has played in creating the conditions to give greater sustainability to the reversal of the long period of stagnation. But we discussed also the limits of the monetary policy, even in its broader unconventional use as an instrument to deal with all the needs of a sustainable recovery. In any case, there is no certainty that macroeconomic policy, beyond monetary policy, has finally found the appropriate way to deal with the weaknesses evidenced by the euro system throughout the crisis process.
the financial crisis, economic performance was lacklustre across advanced economies. Now, the global recovery is firming and broadening. A key issue facing policymakers is ensuring that this nascent growth becomes sustainable.
Dynamic investment that drives stronger productivity growth is crucial for that – and in turn for the eventual normalisation of monetary policy.
Investment and productivity growth together can unleash a virtuous circle, so that strong growth becomes durable and self-sustaining and, ultimately, is no longer dependent on a sizeable monetary policy stimulus”, (Draghi, 2017).