E S T U D O S I
Cidadania, Instituição e Património Economia e Desenvolvimento Regional Finanças e Contabilidade Gestão e Apoio à Decisão Modelos Aplicados à Economia e à Gestão A Faculdade de Economia da Universidade do AlgarveFaculdade de Economia da Universidade do Algarve 2004
F
COMISSÃO EDITORIAL
António Covas Carlos Cândido Duarte Trigueiros Efigénio da Luz Rebelo João Albino da Silva João Guerreiro Paulo M.M. Rodrigues Rui Nunes _______________________________________________________________________ FICHA TÉCNICA
Faculdade de Economia da Universidade do Algarve
Campus de Gambelas, 8005-139 Faro Tel. 289817571 Fax. 289815937 E-mail: [email protected]
Website: www.ualg.pt/feua Título
Estudos I - Faculdade de Economia da Universidade do Algarve Autor
Vários Editor
Faculdade de Economia da Universidade do Algarve Morada: Campus de Gambelas
Localidade: FARO Código Postal: 8005-139 Compilação e Design Gráfico Susy A. Rodrigues
Revisão de Formatação e Paginação Lídia Rodrigues
Fotolitos e Impressão
Serviços Gráficos da Universidade do Algarve ISBN 972-99397-0-5 - Data: 26.10.2004 Depósito Legal 218279/04 Tiragem 500 exemplares Data Novembro 2004
RESERVADOS TODOS OS DIREITOS REPRODUÇÃO PROIBIDA
Exploring the use of DEA for formative evaluation in
primary care:
An application to England
Carla A. F. Amado
Faculdade de Economia, Universidade do Algarve Resumo
Este artigo discute a avaliação do desempenho formativa no contexto da prestação de cuidados primários.
Na primeira parte do artigo, discutímos o contexto do trabalho: a prestação de cuidados primários em Inglaterra. Nesta introdução discutimos também os objectivos deste estudo.
Na segunda parte do artigo fazemos uma discussão da metodologia proposta para medir a eficiência e a efectividade organizacional. A técnica não paramétrica de análise de dados conhecida por Data Envelopment Analysis (DEA) é introduzida.
Na terceira parte do artigo fazemos uma revisão da literatura nesta área. Os estudos publicados que usam o DEA para comparar centros de saúde são revistos de uma forma critica. Esta revisão da literatura permite identificar as deficiências dos estudos até agora levados a cabo nesta área, no sentido de elaborar um novo framework para comparação de centros de saúde.
Este framework é apresentado na quarta parte do artigo e tem como objectivo estabelecer uma ligação entre as necessidades locais de saúde, os recursos usados, os serviços prestados e os resultados atingidos. Com base nas relações estabelecidas entre estes elementos, definímos quatro critérios para a avaliação do desempenho na prestação de cuidados de saúde primários: equidade na utilização dos serviços; eficiência na utilização dos recursos, efectividade clínica e efectividade de custos na prestação de serviços. Embora o framework desenvolvido seja específico para a área da saúde, pequenas alterações ao nível da terminologia são suficientes para o adaptar para a avaliação de desempenho na prestação de outros serviços públicos.
Palavras-chave: Data Envelopment Analysis, Avaliação de desempenho formativa, Cuidados de saúde primários.
Abstract
This paper discusses the formative evaluation of primary health care providers. In the first part of the paper, we discuss the context of study: primary health care delivery in England. In this introduction we also discuss the objectives of this study.
In the second section, we discuss the methodology used: Data Envelopment Analysis (DEA). This non-parametric technique was proposed to measure efficiency, service effectiveness and cost effectiveness, given the fact that it can handle multiple inputs and outputs without requiring the specification of a functional form for the production function.
In the third section, we present a critical literature review of the studies that have compared primary care providers using DEA. This literature review allows us to
identify the shortcomings of these studies, in order to identify the aspects that need to be addressed in the development of a new framework.
In the fourth section, we discuss the development of a new conceptual framework to compare primary care providers. This framework was developed in collaboration with two primary care groups and two primary care trusts in England and aims to establish a
link between the local needs, the resources used, the services delivered and the outcomes achieved in primary care. Based on the relationships between these elements, four performance assessment criteria were defined: equity, efficiency, service effectiveness and cost effectiveness. Despite the fact that this framework has been developed for the specific area of health care, little changes in the terminology would be sufficient in order to apply this framework to the formative evaluation in the delivery of other public services.
Keywords: Data Envelopment Analysis, Formative evaluation, Primary health care delivery.
1. Introduction 1.1. Introduction
Scarcity of public resources and increasing health care needs point towards the importance of constantly looking for better ways of delivering and managing health care services. Performance assessment in health care delivery is seen as a method of ensuring that taxpayers’ money is spent in the best possible way. As a result, performance assessment of health care systems is currently the subject of major interest, both nationally and internationally. Since 1983, when the first set of Performance Indicators (PIs) were introduced in the National Health Service (NHS) in the UK, calls for new ways to measure performance in health care delivery have not abated. From hundreds of PIs, numerous league tables have been produced and, despite continuous protest from health care professionals, the media uses the numbers to produce sensational headlines.
In the NHS the importance given to performance assessment is clear, as means to achieve care of uniformly high standards (The Department of Health 1997). Having recognised the limitations of the previous system of operation, management and control in place during the Conservative Government (in particular, a disregard for primary care management and equity considerations), the Labour Government has developed what they call ‘a third way’ of managing and delivering public services: a system based on partnership and driven by performance (The Department of Health 1997). A new framework for performance assessment (PAF) has been developed. In this framework six performance assessment criteria have been identified: (1) health improvement; (2) fair access to heath services; (3) effective delivery of appropriate health care; (4) efficiency; (5) patient/ carer experience and (6) health outcomes of the NHS care. Structures and agencies have also been introduced to guarantee that quality is reviewed and improved. The National Institute for Clinical Excellence and National Service Frameworks (NSFs) set the standards based on clinical evidence and cost effectiveness. The Commission for Health Improvement monitors the achievement of these standards. Furthermore, at a local level, each organisation and professional is
also responsible for continuous improvement of quality in clinical practice. The objective is to make ‘best practice the norm’.
For the first time, primary care has been characterised as central to the development of the ‘new NHS’ (The Department of Health 1997). Having recognised its importance, the Government implemented structural reforms regarding primary care provision, management and accountability.
The reforms initiated in 1997 appear to be based on three basic assumptions regarding the delivery and management of public services. Firstly, that the methods and models successful in the private sector can also lead to success in the public sector. In this respect, the emphasis is “on the development of more flexible, responsive and entrepreneurial forms of conduct which would overcome the assumed stasis, rigidity and inefficiency of ‘bureaucracy’” (Du Gay, 2000: 63). Secondly, that performance in primary health care can be appropriately measured. All that is required is a wide list of performance indicators (PIs) to collect data to support each one of them and then to develop a weighting system in order to rank organisations and identify best practice. Thirdly, that efficiency, effectiveness, fairness of access and patients’ responsiveness can be improved simultaneously. Altogether, it is assumed that as long as several dimensions of performance are outlined, regularly monitored and as long as clear incentives are in place, it is possible to identify and reward best practice, leading to its reproduction across the country.
However, only a few studies have attempted to compare the performance of several primary health care providers in order to provide some guidance regarding the validity of these assumptions in this context. In this paper we aim to contribute to a discussion regarding appropriate ways to compare the performance of primary care providers and the effective ways to use these results in order to improve performance in primary care.
We developed a conceptual framework for performance assessment in primary care, in collaboration with newly established Primary Care Groups and Trusts (PCG/Ts). It was our objective to use this framework to compare a sample of General Practitioners (GP) surgeries in terms of their delivery of primary care as a whole. However, considering the Government’s strategy of moving towards speciality based delivery and performance assessment, and data availability, it became necessary to focus on a speciality: diabetes care. We propose the following criteria for evaluation: equity, efficiency, service effectiveness and cost effectiveness. These criteria and the whole framework for evaluation were developed in collaboration with the participating PCG/Ts and validated with the participating surgeries.
1.2. Research objective
This research study had the following objective: to develop a comprehensive performance assessment framework for formative evaluation in primary care, that encompasses the following aspects:
The existence of multiple, incommensurable and often conflicting values underlying public service delivery. This points towards the development of a framework that takes into account the trade-offs between the different
criteria. We are particularly interested in studying the relationships between equity, efficiency and effectiveness;
The intrinsically different nature of primary care provision when compared with other forms of service delivery. Primary care provision involves a relationship established between the patient and the professional, which relies on trust and is characterised by a strong asymmetry of knowledge and information. This means that performance assessment of primary care providers is necessarily partial, because there are essential elements that are very difficult to measure, such as the quality of the diagnosis;
The difficulties in measuring the ultimate outcomes of primary care delivery;
The existence of many non-controllable factors impacting on the outcomes of primary care, such as area deprivation and patient compliance;
The potential for responsive dysfunctional behaviour to any performance assessment exercise. This is particularly relevant in primary health care because of the asymmetry of information and the partiality of the assessment.
1.3. Outline of this paper
This introductory section provided an overview of this research study and of its objectives.
Section 2 provides an introduction to Data Envelopment Analysis (DEA). Firstly, we discuss the basic DEA model developed by Charnes, Cooper and Rhodes (1978). This is followed by a discussion of cost efficiency and allocative efficiency, and a method to calculate it by using a DEA model.
Section 3 reviews the relevant literature. We review the studies that have been undertaken using DEA to compare primary care providers. By reviewing the performance assessment studies in primary health care, we identify the main issues that still need to be addressed.
Section 4 discusses the development of a conceptual framework for formative evaluation of GP surgeries. This conceptual framework aims to establish a link between the local needs, the resources used, the services delivered and the outcomes achieved. The difficulties encountered in applying this conceptual framework to evaluate primary care as a whole are discussed and the decision to focus on a speciality is justified. The advantages and limitations of comparing primary care providers based on a speciality are also discussed.
Section 5 concludes the paper and outlines the main contributions of the study. The limitations of this study and suggestions for further research in this area are also included.
2. Methodology: An introduction to data envelopment analysis 2.1 Introduction
In this section we introduce the technique proposed to compare primary care providers: DEA. We begin with a discussion of the measurement of technical efficiency by using the standard constant returns to scale model known as the CCR model (Charnes, Cooper and Rhodes 1978). This is followed by a discussion of the measurement of cost efficiency. The decomposition of cost efficiency into technical and allocative components is also presented.
2.2 Using DEA to measure efficiency
Since it was first proposed by Charnes, Cooper and Rhodes (1978), DEA has been widely used to compare the efficiency of homogeneous Decision Making Units (DMUs) that use a set of inputs to produce a set of outputs. This technique calculates efficiency by comparing the ratio of weighted sum of outputs to the weighted sum of inputs across DMUs.
Koopmans (1951) is associated with the first definition of technical efficiency: a DMU is technically efficient if and only if an increase in one of the outputs cannot be made without either decreasing some of the other outputs, or increasing the inputs. Debreu (1951) proposed the first radial measure of productive efficiency: a coefficient of resource utilisation. Farrell (1957) drew on the work of these two economists and proposed a method to empirically calculate the relative efficiency of several DMUs. He also suggested a way to decompose productive efficiency into two measures: technical efficiency and allocative or price efficiency.
Farrell (1957) is considered to be the first author to lay down the foundations of DEA, by proposing the construction of an empirical production frontier from several observed levels of input and output. This defined inefficiency as the radial distance from a point below the frontier to a point on the frontier. This distance represents the maximal radial expansion of the outputs while keeping inputs constant (output orientation), or the maximal radial contraction on the inputs, while keeping outputs constant (input orientation). One minus the equi-proportionate reduction in all inputs is a measure of input oriented radial efficiency. A score of unity is a necessary condition for relative efficiency. Similarly, a score of less than unity means that there is at least another DMU achieving the same level of outputs, using fewer inputs.
Charnes, Cooper and Rhodes (1978) extended Farrell’s work and defined a linear program in order to obtain efficiency values, for a production system characterised by multiple inputs and multiple outputs. They also introduced an innovation to Farrell’s measure of efficiency. They introduced slack measures to account for non-radial adjustments to the frontier. This model became known as the first DEA model, the CCR Model. We now present a graphical illustration of the measurement of efficiency by using DEA.
2.2.1 Graphical representation of DEA – radial and non-radial efficiency measures
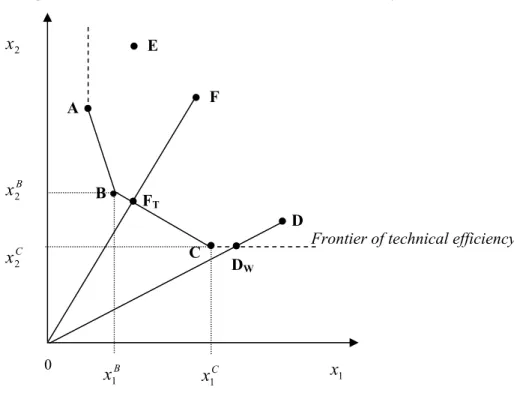
Let us assume that there are 6 DMUs (A, B, C, D, E and F) using two inputs (x1
and x2) to produce one output (y). For simplification, let us also assume that all six
DMUs produce one unit of output. Figure 2.1 below represents the input space of the production technology. Units A, B, and C are technically efficient because they are located on the frontier of technical efficiency. These units envelop all the other units, which are located to their right. The space to the right of the convex frontier is known as the Production Possibility Set. We have no evidence that it is possible to produce one unit of output y, using a combination of inputs situated to the left of the convex frontier formed by points A, B, and C. The vertical extension from point A upwards is also part of the frontier, but is a dominated part of the frontier, given that any point along this vertical line, is dominated by point A. Here, there is evidence that one unit of output y can be produced using the same quantity of x1 and less quantity of x2. Any point along this vertical line is said to be weakly efficient, and a slack quantity of input
x2 can be identified. Reduction of the input usage by that amount of slack would make the DMU technically efficient. A similar situation happens to any points along the horizontal line from point C.
Units D, E and F are technically inefficient, because it is possible to reduce both inputs, while producing the same amount of output. For example, in order for DMU F to become efficient, it has to reduce its inputs from point F to point FT. This reduction in inputs is a radial reduction, without altering the input mix (that is the ratio between
x1 and x2). Its technical efficiency (TEF) can be calculated as: TEF (x, y) =
OF OFT
(2.1)
The optimal quantities of inputs for DMU F result from a convex combination of observed quantities of inputs used by DMUs B and C, by using the following formula:
B( 1B, 2B) C( 1C, 2C)
T x x x x
F (2.2)
where B and C are the intensity variables associated with each of the two peer
DMUs. The projection of DMU F into FT represents the shortest projection to the frontier, given that it respects the current mix of inputs used by DMU F. Assuming that DMU F wants to keep its current input mix, its peer group is constituted by DMUs
B and C, with greater intensity being given to DMU B.DMUs B and C can provide
DMU F with useful information on how to produce the same level of outputs using fewer resources, and the path F to FT can be seen as a path for performance improvement over time. Using this path, several intermediate targets can be identified and progress towards the frontier can be monitored.
Figure 2.1: The measurement of technical efficiency
DMU D is a special case, because it is enveloped by the extension from the best practice frontier. DMU D is said to be improperly enveloped. After a radial reduction of all its inputs up to point Dw it is still possible to reduce one of its inputs without worsening the other input and without worsening the output level. In this example, a radial reduction of all its inputs to point Dw puts it on a position of weak efficiency or Farrell efficiency. In order to obtain a position of Koopmans efficiency, a further reduction of input x1 is necessary to achieve point C on the frontier, which is a non-dominated point.
2.2.2 The measurement of technical efficiency – The CCR Model
Let us consider a general case characterised by the existence of n Decision Making Units (DMUj, j = 1, …, n) to be compared, which use m inputs (xi, i = 1, …, m) to produce s outputs (yr, r = 1, … s). We define the intensity variables attached to DMUj as j. The input weight or multiplier associated with input i is vj i and the output
weight or multiplier associated with output r is ur. Let us assume that constant returns to scale (CRS) prevail at the frontier, i.e., that changes in the inputs should lead to proportional changes in the outputs. Furthermore, let us take an input orientation to the frontier, i.e., we aim to minimise all the inputs, while keeping the outputs constant.
In order to simplify the notation used, let us define the following matrixes and vectors:
Frontier of technical efficiency
FT F A D DW E C B x1 x1 2 x 0 B C x1 C x2 B x2
u
u
u
v
v
v
y
y
y
y
x
x
x
x
y
y
y
y
y
y
y
y
y
x
x
x
x
x
x
x
x
x
s m s m sn s s n n mn m m n n u v Y X ... ... ... ... ... ... . ... . . . ... . . ... ... ... . ... . . . ... . . ... ... 2 1 2 1 0 20 10 0 0 20 10 0 n 2 1 2 1 2 22 21 1 12 11 2 1 2 22 21 1 12 11We can calculate the technical efficiency (TE) of DMU0 by solving one of the
linear programs presented in Model 2.1. The envelopment form and the multiplier form are two ways of presenting the same problem, given that one is the dual of the other.
Model 2.1: The CCR Model – input oriented
Envelopment Form Multiplier Form
TE0 (x, y)CRS = Min Subject to: 0 0 X x Y y0 0. TE0 (x, y)CRS = Max 0 uy Subject to: . 0 , 0 0 1 0 u v uY vX vx
At this point we believe that it is prudent to define Farrell efficiency. A DMU is radially efficient if, and only if, it is not possible to improve all the inputs (or all the outputs) by a certain rate without worsening some other inputs or outputs. In this respect, a DMU is radial or Farrell efficient if the solution to Model 2.1 produces * = 1.
However, as previously shown, further non-radial input reductions or non-radial output augmentations may still be feasible. In order to identify these input shortfalls and output augmentations, we can solve a second stage DEA model, aiming at maximising the input and output slacks, while keeping = *. In this respect, let us define the following ‘slack vectors’:
0
0 X , s Y y
x
Also, let us define a vector of ones: s r r m i si and es s s e that so e 1 1 ... 1 , : 1 1 (2.4)
In order to identify the maximum non-radial reduction in inputs (s ) and the maximum non-radial improvement in outputs (s ),, we use the optimal value of * determined from Model 2.1, and solve a second stage model (Model 2.2), using
s and s
,
as the variables.
We can now return to the definition of Koopmans efficiency. A DMU is Koopmans efficient if, and only if, it is not possible to improve any input or output without worsening some other input or output. That can be obtained by stipulating the following conditions in relation to the solutions of models 2.1 and 2.2:
*=1 and * i s = 0 (for all i, i = 1, …, m) (2.5) and * r s = 0 (for all r, r = 1, …, s) (2.6)
Model 2.2: The CCR Model – Stage 2: maximisation of slacks
Max es es Subject to: . 0 , 0 , 0 0 0 * s s y Y s X x s
2.2.3 Measurement of allocative efficiency and cost efficiencyWhen information about input prices exists, a DEA model can be formulated to measure cost efficiency, i.e., the efficiency of a DMU in producing a set of outputs at minimum cost. Figure 2.2 represents 6 DMUs (A, B, C, D, E and F) using two inputs (x1 and x2)
to produced one unit of output (y). For simplification purposes, let us assume that all DMUs produce one unit of output. We have represented the frontier of technical efficiency and two isocost functions, given the current input prices (w1 and w2).
Based on this example, DMU C is the only unit that is cost efficient. Unit C is the only unit that produces the one unit of output at minimal cost: Point C is the point of intersection between the performance frontier and the minimal isocost. DMU C is said to be both technically and allocativelly efficient. It is technically efficient because there is no evidence that it is possible to reduce all the inputs whilst producing one unit of output. It is allocativelly efficient because it uses the optimal input mix given the current inputs prices. Units A and B are only technically efficient, given that their current mix of inputs is sub-optimal. When we consider the current input prices, both DMUs A and B use too much of input x2, when in fact they should use greater quantities of input x1. If these two DMUs operated with the same mix as that of DMU C, they could produce the same amount of output with reduced costs. DMU F is both
technically and allocativelly inefficient. Its measure of allocative efficiency is calculated as: AEF (x, y) = T A OF OF . (2.7)
Figure 2.2: The measurement of technical, allocative and cost efficiency
x2 0 x1
Cost efficiency can be obtained by multiplying the measure of technical efficiency by the measure of allocative efficiency (Farrell 1957):
OEF (x, y) = OF OFT T A OF OF = OF OFA . (2.8) A DEA model can be formulated to measure allocative efficiency. Let us define a price vector containing the unit prices of each input: w w1 w2...wm . Assuming constant returns to scale and taking an input orientation, the minimum cost (MC) of production for DMU0 can be calculated by solving the Linear Program presented in Model 2.3 (Färe, Grosskopf and Lovell 1994).
Model 2.3: The cost minimisation model
MC0 (x, y, w)CRS = Min wx0 Subject to: . 0 0 0 0 y Y X x
Model 2.3 aims to minimise the total input cost, allowing the input mix to be changed, in a way that suits the current input prices. This is in contrast with the envelopment form of model 2.1 presented above, where the input mix is assumed to
Minimal isocost for output level = w1x1* w2x*2 Isocost = w1x1 w2x2
FT
F
A
Frontier of technical efficiency
D E
B
C FA
remain constant, and only a radial reduction is allowed. This difference is evident in the first set of restrictions, where in Model 2.3 the quantities of inputs are variables to be optimised. Once the optimum quantities of inputs have been identified, the minimum feasible cost for DMU0 can be calculated and is equal to: MC0(x,y,w). This
value represents the minimum feasible cost, at which one unit of output for DMU0 can be produced, considering the current input prices. If DMU0 is cost efficient, then its current cost (w0x0) is already the minimum cost, and its cost efficiency is equal to one. Otherwise, its current cost is superior to the minimum feasible cost, and its cost efficiency is smaller than one. In this case, the vector of optimal input quantities is given by
x
x
x
x
m* T 0 * 20 * 10 * 0 ... (2.9)where the superscript T indicates vector transposition. Cost efficiency (also known as overall efficiency) can be calculated using the following formula (Färe, Grosskopf and Lovell 1994):
Overall or cost efficiency = OE0 (x, y, w) =
0 0 0( , , ) x w w y x MC . (2.10) Cost efficiency includes the two components of efficiency. Firstly, it includes the component of technical efficiency, which does not take into consideration the input prices: it focuses solely on input quantities, and aims at achieving the maximum possible radial reduction. Secondly, it includes an allocative component, which takes prices into consideration and aims to choose the optimal input mix, given current input prices. If we want to isolate this allocative component, we need to run both Model 2.1 and 2.3, and calculate the allocative component using the following formula (Färe, Grosskopf and Lovell 1994):
Allocative efficiency = AE0 (x, y, w) = ) , ( ) , , ( 0 0 y x TE w y x OE (2.11) Given this relationship, cost efficiency can be decomposed into two components as shown below:
OE0 ( x, y, w) = AE0 (x, y, w) TE0(x,y) (2.12)
So far we have focused on the measurement of technical and allocative input efficiency. The measurement of cost efficiency assumes the existence of input prices. If information regarding the exact input prices is not available, an alternative is to include information regarding a range of technologically realistic trade-offs between the different inputs. Similarly, information regarding the technologically realistic trade-offs between the different outputs can also be included in order to obtain more reliable estimates of efficiency. In DEA, this type of information is introduced via the use of weight restrictions. We will now briefly review the studies that have applied DEA to primary health care.
The number of applications of DEA to primary health care is limited (Hollingsworth, Dawson and Maniadakis 1999). A substantial part of these studies have used DEA to compare primary health care providers in the UK (Szczepura, et al. 1993, Thanassoulis, Boussofiane and Dyson 1995, Bates, Baines and Whynes 1996, Salinas-Jiménez and Smith 1996, Giuffrida 1999, Buck 2000 and Giuffrida and Gravelle 2001). Pina and Torres (1992), Göni (1999) and Garcia et al. (1999) compared the efficiency of Spanish primary care centres. Luoma et al. (1996) used DEA to compare the efficiency of Finish health centres, and Zavras et al. (2002) have used DEA to compare Greek primary care centres. In America, DEA has been used to compare primary care clinics (Huang and McLaughlin 1989) and to compare mental health care programs (Schinnar et al. 1990). DEA has also been applied to Health Maintenance Organizations (HMOs) (Rosenman, Siddarthan and Ahern 1997, Siddarthan, Ahern and Rosenman 2000), and individual physicians (Chilingerian and Sherman 1996, 1997, Ozcan 1998, Wagner, Shimshak and Novak 2003).
A large number of applications of DEA have focused on the measurement of efficiency of hospitals. Examples include Nunamaker (1983), Grosskopf and Valdmanis (1987), Rosko (1990), Ozcan (1992), Byrnes and Valdmanis (1994), Parkin and Hollingsworth (1997), Mobley and Magnussen (1998), Solà and Prior (2001) and Tsai and Molinero (2002). A full review of these studies is outside the scope of this paper, as our main focus is on primary care evaluation.
Given the wide range of services delivered by primary care providers, the identification of outputs of primary care is a great challenge. A common feature in most of the studies reviewed here is that the number of patients registered is used to measure output. The use of the number of patients registered is particularly common in America, due to the publication of this data by HMOs. For example, Ozcan (1998) used the number of patients registered as outputs, separated by severity categories: low severity, medium severity and high severity. Chilingerian and Sherman (1996 and 1997) also used the number of patients registered with each physician, in this case separated into sex and age groups.
There are two problems associated with using the number of registered patients to compare the performance of primary health care providers. Firstly, it assumes that all the patients registered with a particular health care organisation are receiving the necessary services. Secondly, it assumes that the services provided to the patients registered are appropriate and of similar quality. These problems have been addressed by some of the studies and we shall focus on them.
Recognising that having patients on the lists does not necessarily mean service delivery, we find some studies that have used the number of consultations undertaken as an output measure in primary health care. Huang and McLaughlin (1989) used the number of consultations by physicians, nurses and non-health care professionals. Pina and Torres (1992) used output measures related to the average number of consultations per inhabitant and the average number of consultations by professional. Similarly, Luoma et al. (1996) included several output measures related to the number of patient visits to physicians.
Using the Whole Time Equivalent (WTE) health care professionals as inputs and using the number of consultations as outputs will lead to a system that rewards
shorter consultations. For this reason, Göni (1999) has used output measures related to the number of consultations and also related to the time devoted to the consultations. However, despite the fact that a consultation is an opportunity for contact with the health care professional, frequent consultations, per se, do not mean better primary health care. It is desirable to include measures of output that aim to capture the appropriateness of the consultations in terms of the delivery of the services deemed necessary to improve health outcomes. We will now review some studies that have attempted to include data regarding the appropriateness of service delivery.
Szczepura et al. (1993) studied the efficiency and effectiveness of General Practices in the region of Warwickshire in England. Unfortunately, unavailability of adequate data prevented the authors from building a more comprehensive model. The outputs used to measure efficiency refer solely to preventive care.
Schinnar et al. (1990) have also investigated the relationship between the efficiency and effectiveness in their comparison of 54 mental health care programs in the USA. They concluded that for lower than average levels of efficiency, there is a positive correlation between efficiency and effectiveness. However, for higher than average levels of efficiency, they were unable to find a clear relationship. Moreover, it was suggested that at an average level of efficiency, programs may be able to achieve the highest levels of effectiveness.
Thanassoulis, Boussofiane and Dyson (1995) used data on the provision of perinatal care in England to build three alternative DEA models for target setting. The main objective of the study was the proposal of several technical enhancements in the DEA model formulation.
Chilingerian and Sherman (1996, 1997) were also concerned with incorporating managerial preferences for target setting with DEA. They used a Cone Ratio DEA model to incorporate this information. Both of the studies focus on the same aspect: the evaluation of practice patterns of individual physicians, in order to achieve resource savings. The model also provides targets for performance improvement according to the chosen practice pattern. However, it was suggested that more research is needed to improve the measures of service quality, before we can be confident that these results genuinely represent resource saving potential.
Salinas-Jimenéz and Smith (1996) were also concerned with the need to include quality indicators in the measurement of efficiency. In this study, data from 90 District Health Authorities in England is used to compare their relative efficiency. Due to non-availability of outcomes data, the DEA model constructed uses structure and process indicators as proxies for the quality of the service, such as the proportion of practices employing a practice nurse and the proportion of practice premises that satisfied the minimum quality standards. Salinas-Jiménez and Smith (1996) recognized the potential of DEA as a benchmarking technique in primary care, whilst emphasizing the need to include more reliable measures regarding the quality of services delivery in this context.
García et al. (1999) made another attempt to include information about the quality of primary care services in a DEA study. They studied the efficiency of 54 Primary Health Centres in the province of Zaragoza, Spain. Using the results from a previous study analyzing the opinion of primary health care managers in Spain (Urbina
perspective, two of the most important output variables were found to be: (1) ‘The Synthetic Index Product’, which provides “information about the coverage of the different services and the special effort (burden) that the services imply” (García et al. 1999: 71); and (2) ‘The Minimal Technical Standard’, which measures the compliance with the minimum standards of quality in the delivery of preventive and curative services. These two variables were used in this study, respectively, as a measure of the access to services according to need, and the quality of services delivered. Despite the progress made in the output variables used, the authors still pointed to the need to improve the definition of quality and case-mix in primary care in order to undertake a more comprehensive evaluation of providers.
Our review of the literature so far points towards the fact that most DEA studies applied to primary care focused on structure and outputs, but have not included outcomes. It is argued however that evaluation in general practice does need to be holistic in the sense that it is the general service as a whole that should be evaluated rather than the individual aspects and in principle DEA can provide such a methodology.
Evaluation in public services tends to be of a summative nature involving rankings, classifications and targets often set arbitrarily and in isolation from the overall performance. This approach can be dysfunctional and it is argued that for service improvement a formative approach, engaging the decision-makers is appropriate. It is thus argued that for DEA to be useful in performance improvement in primary care it needs to be deployed in the formative mode.
In summary it is argued that evaluation and performance improvement in primary care needs to be inclusive of structure, process, outputs and outcomes; that evaluation in primary care must be holistic in recognition that it is a general health care service; that evaluation must be formative, engaging stakeholders, if it is to lead to performance improvement; and in principle DEA provides the basis of an appropriate methodology. In the following section a model is developed for holistic, inclusive and formative evaluation of primary care.
4. Development of a new conceptual framework to compare primary care providers
In this section we discuss the development of a new conceptual framework for formative evaluation of primary care providers. This framework was developed during a series of workshops with Board members of two PCGs and two PCTs in England. This conceptual framework is to be used at the level of GP surgeries and aims to establish a link between local needs, resources usage, service delivery and outcomes achieved in primary care.
Our purpose of undertaking a performance assessment in primary care was a formative one, from the perspective of a PCG/T. In order to identify the criteria for evaluation and to decide on how to measure each criterion, we used the workshops with the participating PCG/Ts to develop and validate a simplified representation of primary care delivery in England.
4.1. A new conceptual framework to compare primary care providers
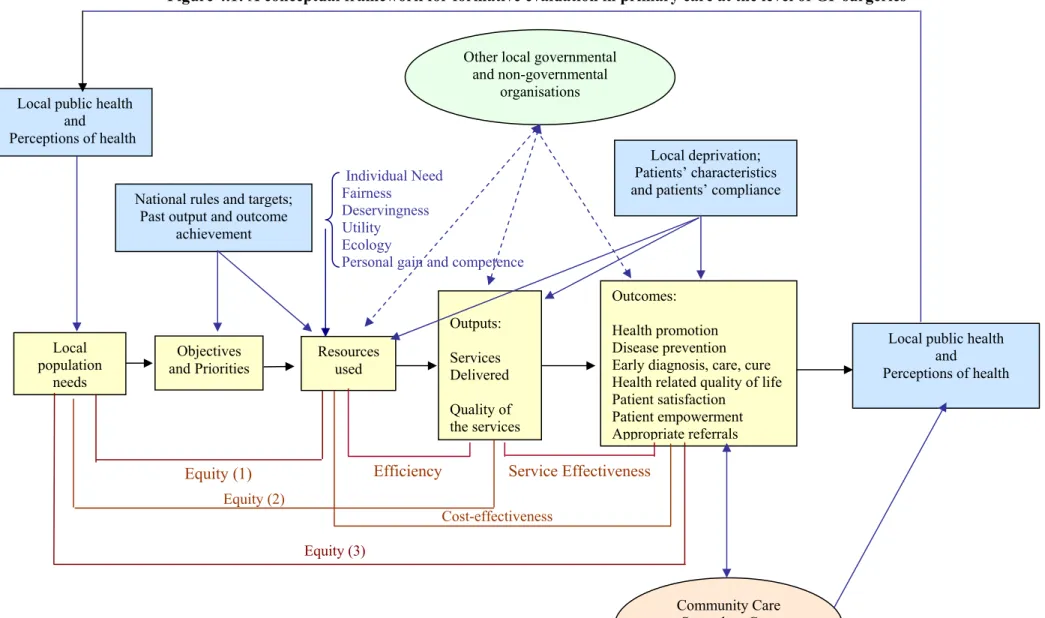
Figure 4.1 presents the new conceptual framework developed to compare primary care providers. In the rectangular light grey boxes we have the elements that characterise primary care delivery, the elements that drive it and the impact of this activity on the population’s health. Graphically shown below these boxes are four criteria that can be used for performance assessment: (1) equity, (2) efficiency, (3) service effectiveness and (4) cost effectiveness. For example, efficiency is considered to be a measure of how well each provider is able to use its resources to deliver relevant services of high quality. An important aspect we would like to emphasize is that the measurement of the different dimensions of performance requires the use of different models. A single model would not be appropriate to measure all the dimensions as they relate to different parts of the process.
The simple ‘one way’ causality assumed to exist between needs, resources, service delivery and outcomes achievement represents a strong abstraction from the complex problem that characterises health care delivery. In order to make an attempt to conceptualise some of the complexities involved, we have added other elements to this simple representation.
In the rectangular dark grey boxes, we have factors that impact upon the performance of each surgery, but are not directly controllable by the surgery. For example, perceptions of local health and need will drive the demand for primary care services and surgeries have to respond to that demand by consulting the patients. The guidelines and targets imposed by the government will necessarily have an impact on the objectives and priorities followed by each surgery. The surgery’s past achievement in terms of performance can also be expected to influence the level of resources allocated to a particular type of service delivery, particularly if past performance results were the subject of political scrutiny (Smith 1992). Finally, the characteristics of the population covered by each surgery, patients’ propensity to consult and willingness to comply with treatment will also have a great influence on the level of resource usage, service delivery and outcomes achievement.
It is important to recognise that decision-making and resource allocation is not only driven by utility considerations. In fact, a number of multiple and potentially conflicting values inform decision-making from individual need considerations to personal gain, habit and competence.
The elliptical boxes represent the organisations with which GP surgeries most directly engage, and which indirectly affect their performance. For example, the quality of the services provided by the local hospital can certainly be expected to impact on the level of resource usage, service delivery and outcomes achievement of the surgery.
This type of representation is not intended to accurately describe primary care delivery and the decision-making process associated with it. Instead, this representation is only intended to be an auxiliary device to understand how the different values and factors can relate to each other in a single decision. This leads to the recognition of the limitations involved in using a simple production metaphor to compare primary care providers.
Despite being a simplification, by focusing on the complexities involved in primary care delivery, this representation makes clear that a strong abstraction process is required in order to measure performance using the production metaphor. Firstly, if decision-making results from the heuristic application of multiple and potentially conflicting values, is it valid to assume that a clearly defined homogeneous ‘decision making unit’ (or agent) exists? We need to recognize that this metaphor results from an abstraction from many other aspects. However, we also need to recognize that such an abstraction can be useful, as it can lead to the identification of large discrepancies in the use of resources and the delivery of services, leading to a process of inquiry.
Finally, it is essential to recognise that performance assessment in the public sector will always be incomplete. Stewart and Walsh (1994: 47, emphasis added) make this point quite clearly. “The reason why adequate performance measures cannot be found in the public domain is, therefore, not a matter of technical problems alone, it is
inherent in its character. It means that no set of indicators can ever be assumed to be
complete, since in the public domain no relevant issues can be excluded”. In this respect, it is essential to recognise the limitations of any performance assessment framework in the public sector and proceed with great caution in terms of its use.
Figure 4.1: A conceptual framework for formative evaluation in primary care at the level of GP surgeries Individual Need Fairness Deservingness Utility Ecology
Personal gain and competence Equity (2) Cost-effectiveness Equity (3) Local population needs Objectives
andPriorities Resources used
Outputs: Services Delivered Quality of the services Outcomes: Health promotion Disease prevention Early diagnosis, care, cure Health related quality of life Patient satisfaction
Patient empowerment Appropriate referrals
Community Care Secondary Care Other localproviders Local public health
and Perceptions ofhealth
Local deprivation; Patients’ characteristics and patients’ compliance Other local governmental
and non-governmental organisations
Local public health and Perceptions of health National rules and targets;
Past output and outcome achievement
4.2 Performance assessment criteria
During the workshops, four essential criteria were identified for performance assessment: (1) efficiency, (2) service effectiveness, (3) cost effectiveness and (4) equity. Below we discuss each one of these criteria and the methodology proposed to measure them.
4.2.1 The measurement of efficiency
One of the objectives of performance assessment in the public sector is to answer the question about whether an organisation is achieving ‘value for money’ (The Audit Commission 2000). This is, first of all, a managerial concern regarding the optimal use of public resources. In this respect, performance assessment is often associated with the measurement of efficiency.
The measurement of efficiency relies on the production metaphor. A set of inputs is used to produce a set of outputs. Inputs are the resources that are used to produce goods or deliver services. These may be materials or labour (human energy). Outputs are the goods produced or the services delivered. In primary health care, we are interested in services delivery. Services can be characterized as an action or set of actions that are desirable because of their effects (the outcomes). In particular, in health care, services delivery is desirable because it aims to help in maintaining or improving patients’ health or patients’ perceptions of it. In primary health care, this may be done by performing a diagnosis of patients’ health status, by prescribing appropriate medication or treatment, or simply by providing advice or comfort to the patients.
There are two types of efficiency: (1) technical efficiency and (2) allocative efficiency. Technical efficiency assesses the relationships between the outputs produced and the resources used. It aims to maximize the amount of outputs produced from a certain level of resources usage (output orientation). Alternatively, it involves the minimization of resource usage in order to produce a certain level of outputs (input orientation). In order to perform a fair assessment of efficiency both the resources used and the outputs produced are assumed to be of similar quality.
As previously discussed, allocative efficiency relates to an assessment of the optimality of the mix of resources used given their current prices and the optimality of the outputs produced given the relative valuations placed on them. A provider may be technically efficient, but allocativelly inefficient. If the perfect set of values could be identified for the resources and the outputs, a measure of overall efficiency could be obtained.
In the public sector, we are usually faced with situations where we do not have good measures for the prices of the resources or for the valuations of the outputs. Therefore, the use of a technique like DEA is advantageous, because it allows each provider to choose the best set of weights for its inputs and outputs. In this respect, and in the absence of any information regarding the trade-offs between the different inputs and outputs, DEA legitimizes all possible trade-offs and provides a conservative measure of technical efficiency.
Therefore, we express the measurement of technical efficiency using the following formula:
WeightedSumof Inputs Outputs of Sum Weighted Efficiency Technical (4.1) This is a relative measure and for our study, it results from a comparison of several different providers.
4.2.2 Service effectiveness and cost effectiveness
Carter, Klein and Day (1992) discuss the ambiguity and confusion associated with the concept of effectiveness. An effective organisation can be defined as an organisation that achieves its objectives. Schinnar et al. (1990) proposed an alternative definition of effectiveness that we find very useful. They defined effectiveness as the ratio of outcomes achieved to services delivered and proposed the use of DEA to compare the effectiveness of different organisations. This is done by using an output-oriented DEA model, which aims to maximise the level of outcomes achieved, given the amount of services delivered; and aims to evaluate the ‘added value’ of the services delivered, independently of the resources used. Lovell, Walters and Wood (1994) have used DEA to measure service effectiveness in the education sector. Porto (2000) used this approach to compare the service effectiveness of substance abuse programs.
In this study, we use the definition proposed by Schinnar et al. (1990) to measure service effectiveness. Furthermore, we have extended this approach to measure cost effectiveness. This can be done by solving a DEA model that aims to minimise the total cost of production (or the level of resources used), whilst maintaining the amount of outcomes achieved. Alternatively, a comparison can be established by aiming to maximise the outcomes from a given level of resource usage. Below we present the formulas proposed to calculate service effectiveness and cost effectiveness: (4.3) (4.2) Inputs of Sum Weighted Outcomes of Sum Weighted ess Effectiven Cost Outputs of Sum Weighted Outcomes of Sum Weighted ess Effectiven Service
The formulation presented for the measurement of service effectiveness highlights the potential trade-offs between efficiency and service effectiveness given that in terms of efficiency measurement; the outputs appear in the numerator whilst in the measurement of service effectiveness, they appear in the denominator. The need to make this trade-off explicit was emphasised during the workshops. It was believed that one of the ways to improve service effectiveness was by focusing on the delivery of services towards a restricted number of more cooperative patients.
Despite the importance of ‘Value for Money’ assessments, this type of assessment is only concerned with the value of utility. Concerns for individual need
and fairness are also legitimate and performance assessment cannot ignore these values. As pointed by Ozcan and Smith (1999: 1), “it may be the case that perfectly efficient managerial solutions may be unacceptable to patients, and can be implemented only if they also satisfy additional criteria relating to fairness”. We now discuss the criteria of equity in terms of performance assessment and three alternative approaches for its measurement.
4.2.3 Equity between groups of patients
Equity is concerned with justice and fairness in the treatment of cases. With regards to health care provision, equity is concerned with justice in the treatment of different patients and particularly in the treatment of different groups of patients. An equitable health care system provides services of the same standard independently of, for example, patients’ income group, age, sex and area of residence.
Aristotle provided two essential definitions of equity. (1) Horizontal equity: equal treatment of equals; and (2) vertical equity: unequal but fair treatment of unequals. Each one of these definitions can be operationalised in a number of ways, and it is within this process that one finds divergences. For example, how do we assess ‘equalness’? The most basic criterion is one of being human, and in that respect one can say that there should be equal treatment of human beings (Culyer and Wagstaff 1992). This criterion is behind the health care budget allocation of some countries, where the formulas for distribution aim at equal expenditure per capita. This approach fails to recognise an important aspect, that of need. Human beings can have different levels of health care need, and equality of treatment only becomes meaningful if there is need for that treatment. Therefore, horizontal equity can be re-defined as ‘equal treatment for equal need’. Identically, vertical equity would be re-defined as ‘more favourable treatment of those with higher need’.
Given the difficulties associated with the assessment of vertical equity, in this study we have concentrated on assessing horizontal equity only. We will now clarify what we mean by equal need and equal treatment.
4.2.3.1 The concept of need
Need for health care is an ambiguous concept, and we can find different definitions in the literature, as well as different approaches to its assessment. One definition that has been used in several recent studies (Smaje and Le Grand 1997, Waters 2000, Urbanos-Garrido 2001) equates need with patient self-reported illness. For example, Smaje and Le Grand (1997: 488), define need for health care as “the presence of long-term illness which limits activities and/ or an illness experienced within the previous two weeks”.
We believe that using a single indicator of need derived from patient reported illness has some limitations. Firstly, there are different levels of need, given that the health care needs of a patient reporting being ill in the previous week (for example having flu) cannot be compared with the health care needs of a patient who reports suffering from a chronic illness. Secondly, different groups of patients may have different pre-dispositions to recognize and report morbidity (Goddard and Smith
1998). Finally, and more fundamentally, equating self-reported illness with need for health care can be misleading for two reasons. (1) A patient might need health care without being ill, or perceiving to be ill. Preventive health care and disease screening are two examples. An undiagnosed person suffering from diabetes might feel perfectly fine at the moment, but is in fact in great need of health care. (2) A patient might be ill or perceive to be ill and not need health care, in the sense that currently available health care will not be of benefit to the patient.
Williams (1974) and Culyer (1976) proposed an early definition of need, which in our view, is preferable. This definition equates need for health care with the patient’s capacity to benefit from the consumption of health care. In this respect, if someone cannot benefit from health care, although ill, he/ she is not said to be in need of health care. More recently, Culyer and Wagstaff (1992) proposed a modification to this definition in order to quantify need. They define need as the minimum amount of expenditure required to eliminate patients’ capacity to benefit from health care. Despite the obvious advantages of such a definition, we believe that its operationalisation can bring additional difficulties. The amount of resources needed to eliminate the patients’ capacity to benefit will depend on the efficiency of the health care system as well as on the effectiveness of the services provided. We have to assume that the term minimum amount of expenditure refers to the resources needed to deliver the necessary services, using efficient and effective systems. Given the difficulties involved in estimating this minimum amount of expenditure, we choose to work with the earlier definition where need is equated with capacity to benefit, although acknowledging that different patients can have different levels of need.
One question remains to be answered. How is the judgment about the capacity to benefit made? In practice, this judgment is made by health care professionals, patients and carers and it is the interplay of these judgments that drives health care delivery. In this study, we consider that a group of patients has health care need if it is
clinically expected that their health status would improve (or deteriorate slower) due to
receiving appropriate primary care. Having clarified what we mean by need for primary care, we now turn to the conceptualisation of equality of treatment.
4.2.3.2 The concept of equality of treatment
Equality of treatment can be measured using three criteria (Culyer 1991):
(1) Service inputs - resources used in the provision of health care for population groups;
(2) Service outputs - services delivered to population groups;
(3) Service outcomes - the impact of the services delivered on population groups.
Based on these three criteria to assess equality of treatment, we can operationalise three definitions of horizontal equity:
(1) Equal resources for equal need;
(2) Equal service provision for equal need; (3) Equal health care outcomes for equal need.
The first definition (inputs/need) is an important one, and tends to be the one that is most used. However, it can be misleading, if we do not adjust for the relative
inefficiencies of the providers. For example, the fact that provider A has a higher ratio of expenditure for need than provider B, does not imply that the patients serviced by provider B are suffering from inequity of health care. In fact, they might receive a relatively higher level of services per need. This is because provider A might be inefficient when compared to provider B.
The second definition proposed (services/need) overcomes this problem, when we consider that it compares the amount of services provided with the needs of different population groups. At the most basic level, this definition is concerned with equality of access to services. However, given the difficulties in assessing equality of access, most studies have focused on equality of utilisation of health care. This poses some challenges because different people have different propensities to consult. Goddard and Smith (1998) state that it is important to distinguish between the inequity that is caused mostly by poorer supply of services to certain groups and the inequity that is explained mostly by different propensities to utilise services. These two types of inequity require very different types of policy intervention.
Definition (2) does not consider how effective each service provider is. It might be the case that provider A, although inefficient, delivers the right services to patients, in such a way that the effect these services have on the patients is higher than the impact of the services provided by B. If we are concerned with an equitable distribution of health care outcomes, then we need a different definition. The last definition (outcomes/need) is the most ambitious of all; it requires equal health outcomes across the different groups of patients. Regardless of health care efficiency and effectiveness, this definition requires that all groups have equal levels of health care outcomes for equal needs. In this respect, its achievement requires positive
discrimination, towards those patients for which health services are less effective.
Despite the support shown by some researchers towards the use of definition (3) (Culyer and Wagstaff 1992), we feel that its use poses some challenges. We are back into the fact that people have different attitudes towards health care and towards health. The goal of ‘outcomes equality’ presupposes that everyone has the same preference for ‘being healthy’, puts the same effort into ‘being healthy’ and has the same attitude to risk. Mooney and Jan (1997: 82) make this point: “Even if we had a society which started from a position of equal health (with the same genetic endowment for all) and even if we all had perfect knowledge of the health effects of all activities in which we might indulge [and had equal access to effective health care], it is unlikely that within one year or two we would all have the same level of health”. The question becomes whether it is reasonable to measure health care equity by assessing equality of outcomes. Sen (1992) states that equity is better assessed in terms of freedom to achieve rather than actual achievements. Others might propose that we should discard definition (3), and work solely with definitions (1) and (2), focusing particularly on equality of access. Fair access to services is in fact one of the founding principles of the NHS and the White Paper published in 1997 makes it one of the six dimensions of performance. Nevertheless, we feel that a comparison of health outcomes across different groups is relevant because it allows us to assess if different groups appear to be systematically subject to less effective care and point towards providers who may need extra resources in order to secure similar standards in terms of outcomes achievement.
4.2.4 Conflicts between the different performance criteria
One consequence of using several criteria for evaluation is that this may lead to alternative and potentially conflicting views of best practice. Furthermore, if the objective is to identify strategies for performance improvement, it may lead to several potentially conflicting views regarding the need and direction for change. For example, in our case study, we found a set of surgeries that are performing very well under the equity criterion, but these surgeries are not necessarily efficient or effective in their services delivery. Furthermore, we have identified surgeries that are clinically effective, but are not efficient. The question is, do these surgeries need to change the way they operate, and if so, what direction for improvement should they take? This is in fact a difficult question, and one which appropriate discussion is outside the scope of this paper. Nevertheless, some tentative suggestions regarding methods to handling this question are proposed below.
One method is to admit that each organisation will have to undergo a process of negotiation and decide based on its priorities and values if it wants to change, and if so, what is the direction of change it wants to take. The problem with this solution is that it can lead to the perpetuation of the values of the most powerful stakeholders. We propose two alternative strategies regarding performance assessment and improvement whenever we are in presence of multiple incommensurable and conflicting objectives. The first alternative uses the concept of robustness proposed by Dryzec (1983):
“Optimisation is a legitimate procedure only if we are in possession of a single theoretical perspective in which we have a high degree of confidence, and believe there is only a single possible context in which the effects of policy will be felt. Given, though, that the components of our system are unreliable, one should pursue robustness rather than optimisation. A robust policy alternative is one expected to perform tolerably well across the whole range of scenarios given any one of the pertinent theoretical perspectives.”
Dryzec (1983: 360)
This alternative assumes that all values and criteria are equally legitimate and desirable. Furthermore, it assumes that a hierarchy of importance cannot be established between values. Therefore, no limits are imposed on the types of trade-offs that are to be accepted between the different values. However, depending on the context, it might be more appropriate to use a ‘qualified robustness’. This would entail an identification of the levels of trade-offs that were to be deemed acceptable between specific values and evaluation criteria. For example, we might want to impose that no decrease in the level of equity is to be accepted, independently of the increases in efficiency or effectiveness that it may generate. Le Grand (1991) defends that equity should be the primary objective in public services provision. Only when this criterion has been satisfied, should we be concerned with an improvement in the level of efficiency. Alternatively, we may say that the level of equity should never fall below a particular level, independently of the benefits it may generate in the other measures. A further alternative is to say that a decrease in the level of equity is only accepted if it leads to increases in the other evaluation criteria of a certain magnitude.
Independently of the criterion used to handle the trade-offs between the multiple values that underlie public services delivery, the important aspect to recognise is that this is a political decision that should be explicitly made. The complexity and responsibility involved in making such a decision should not be overshadowed by rhetoric about delegation of decision-making power. It is a political decision, whose effects should lead to a clear chain of central accountability independently of local decision-making (Du Gay 2000).
4.3 The impact of environmental variables in the assessment of performance in primary care
There are some factors outside the clinicians’ control that can impact on the relative performance of each surgery. As a result it is important that these factors not be overlooked. During the workshops we identified the following factors that can contribute to the level of resources used, services delivered and outcomes achieved by each surgery:
(1) The case-mix of the patients registered with each surgery, in terms of age, gender, ethnicity and health status;
(2) The level of socio-economic deprivation of the area covered by each surgery. Socio-economic deprivation aims to measure the extent to which one area is disadvantaged in terms of the essential socio-economic factors. The Department of the Environment, Transport and the Regions (DETR 2000), suggests six domains of area deprivation: (1) income, (2) employment, (3) health deprivation and disability, (4) education skills and training, (5) housing and (6) geographical access to essential services. Area deprivation can influence the patients’ propensity to pursue health care and the patients’ lifestyle;
(3) The level of patient compliance with the treatment and recommendations of the clinicians;
(4) The quality of the services delivered by other local providers; (5) Random variation in the data.
4.4 The appropriateness of the production metaphor for primary care delivery The importance of measuring outcomes and linking the achievement of outcomes with the level of resource usage and the level of services delivered relates with the need to make an assessment regarding which structures and processes of care appear to lead to best value for money. However, it has been stated that measuring the outcomes of primary care delivery poses considerable challenges (Harris 1993, Salinas-Jeminéz and Smith 1996). These difficulties relate to several essential aspects. Firstly, different groups of people have different objectives for primary care and therefore give value to different outcomes. This emphasises the pluralistic nature of primary care delivery and implies that any outcome assessment in primary care is necessarily partial. Secondly, some outcomes of primary care are only visible after many years of intervention, for example the outcomes of preventive care. Thirdly, some outcomes are difficult to quantify because they relate to subjective aspects of quality. For example, it is very difficult to assess the appropriateness of diagnosis and