Departamento de Química
I
In vitro
studies of Gum Arabic-coated
Magnetic Nanoparticles with Mammalian
Cell Cultures
Por
Ana Sofia Cardoso
Dissertação apresentada na Faculdade de Ciências e
Tecnologia da Universidade Nova de Lisboa para
obtenção do grau de Mestre em Biotecnologia
Orientadoras: Ana Cecília Afonso Roque
Ana Isabel Dias Bicho dos Santos
3
Acknowledgements
I would like to acknowledge first and foremost my dear supervisors Prof. Ana Cecília Afonso Roque and Dr. Ana Isabel Dias Bicho dos Santos for all the endless support, guidance and especially for their friendship. To my fellow co-workers and also friends from the "NanoLab" and from the other laboratories, namely Ana Pina, Vera Castro, Dr. Abid Hussain, Telma Barroso, Íris Batalha, Ana Bárbara Santos, Ana Lanham, Nuno Costa, Ines Gomes, Pedro Quaresma, Tânia Carvalho, Leonor Morgado, Dr. Pedro Vidinha... I want to express my deepest gratitude for all the fruitful discussions and never ending support. I would also like to thank Dr. Paulo Lemos at the Bioengineering group (FCT-UNL) for all the help with the microscopy analysis, Dr. Pedro Baptista and Gonçalo Dória (CIGMH, FCT-UNL), for the help with the microplate reader, Dr. António Lopes at CoPos (ITQB - UNL) for allowing me to perform the DLS and Zeta Potential analysis, Eng. Isabel Nogueira (IST- UTL) for the TEM analysis and Prof. Isabel Fonseca (FCT-UNL) for the BET analysis. I would also like to acknowledge the help of Eng. Lúcia Pereira, Maria José Carapinha, Maria da Palma Afonso, Joaquina Lopes, Maria da Conceição Martins and Idalina Martins for all the help they provided throughout the work.
4
Index
ACKNOWLEDGEMENTS ... 3
INDEX ... 4
INDEX OF FIGURES ... 6
INDEX OF TABLES ... 7
GLOSSARY ... 8
ABSTRACT ... 9
RESUMO ... 10
CHAPTER 1 – LITERATURE REVIEW ... 11
1.1. MAGNETIC NANOPARTICLES ... 11
1.2. SYNTHESIS AND MODIFICATION OF IRON OXIDE MAGNETIC NANOPARTICLES 12 GUM ARABIC ... 14
1.3. INTERACTION OF MAGNETIC IRON OXIDE NANOPARTICLES AND CELLS ... 16
1.4. AIMS OF THE WORK ... 18
CHAPTER 2 – SYNTHESIS OF MAGNETIC NANOPARTICLES ... 19
2.1. INTRODUCTION ... 19
2.2. MATERIALS AND METHODS ... 20
2.2.1. Materials ... 20
2.2.2. Equipments ... 20
2.2.3. Methods ... 20
2.2.3.1. Synthesis of Magnetic Nanoparticles at different reaction times ... 20
2.2.3.2. Synthesis of Magnetic Nanoparticles with different stirring conditions 21 2.2.3.3. Synthesis of Magnetic Nanoparticles by co-precipitation with GA ... 21
2.2.3.4. Characterization of synthesized Magnetic Nanoparticles ... 22
2.3. RESULTS AND DISCUSSION ... 23
2.4. CONCLUSIONS ... 29
CHAPTER 3 – SURFACE MODIFICATION OF MAGNETIC NANOPARTICLES WITH GUM ARABIC ... 31
3.1. INTRODUCTION ... 31
3.2. MATERIALS AND METHODS ... 32
3.2.1. Materials ... 32
3.2.2. Equipments ... 32
3.2.3. Methods ... 33
3.2.3.1. Characterization of Gum Arabic in Aqueous Solution ... 33
3.2.3.2. Adsorption of Gum Arabic onto Magnetic Nanoparticles (MNP_GAADS and MNP_GA_GAADS) ... 34
3.2.3.3. Covalent Coupling of GA onto Aldehyde functionalized Nanoparticles (MNP_GAAPTS) ... 34
3.2.3.4. Covalent Coupling of EDC activated Gum Arabic onto amine functionalized Nanoparticles (MNP_GAEDC) ... 36
5
3.3. RESULTS AND DISCUSSION ... 37
3.4. CONCLUSIONS ... 46
CHAPTER 4 – STUDIES ON THE INFLUENCE OF MAGNETIC PARTICLES ON THE GROWTH OF MAMMALIAN CELL LINES AND CELLULAR VIABILITY ... 48
4.1. INTRODUCTION ... 48
4.2. MATERIALS AND METHODS ... 49
4.2.1. Materials ... 49
4.2.2. Equipment ... 49
4.2.3. Methods ... 50
4.2.3.1. Functionalization of GA with FITC ... 50
4.2.3.2. Protocol for the establishment and maintenance of Cell lines... 51
4.2.3.3. in vitro studies of Mammalian Cell lines grown in the presence of MNPs 52 4.2.3.4. Cell Viability Trypan Blue exclusion Test ... 53
4.3. RESULTS AND DISCUSSION ... 53
4.3.1. Assays of MNPs with different cell lines (HEK293, CHO and TE671) ... 53
4.3.2. Assays with HEK293 cells at different incubation times (30 min to 30 hours) 57 4.3.3. Trypan Blue exclusion test for cellular viability ... 62
4.3.4. Localization studies of MNPs ... 63
4.4. CONCLUSIONS ... 65
CHAPTER 5 – CONCLUDING REMARKS ... 67
6
Index of Figures
Figure 1-1 Proposed structure for GA. ... 15
Figure 2-1 (a) Massart’s Synthesis equipment; (b) Nanoparticle (MNP) solution as taken from the reactor; (c) Washing of MNP solution with deposition of magnetic nanoparticles by means of a magnet. ... 21
Figure 2-2 Massart synthesis results. (a) Particle size as a function of time of synthesis; (b) Zeta Potential as a function of time of synthesis. ... 23
Figure 2-3 TEM micrographs of magnetic nanoparticles taken at different magnifications (a) cluster of particles; (b) dotted circle indicates a single particle witthin the cluster. ... 26
Figure 2-4 TEM micrographs of GA-co-precipitated magnetic nanoparticles taken at different magnifications (a) cluster of particles; (b) dotted circle indicates a single particle witthin the cluster. ... 28
Figure 3-1 Gum Arabic adsorption onto magnetic nanoparticle surface. ... 34
Figure 3-2 Covalent coupling between Gum Arabic and functionalized MNPs ... 34
Figure 3-3 Covalent coupling between aminated MNPs and EDC functionalized Gum Arabic ... 36
Figure 3-4 Adsorption isotherms of GA at the surface of MNPs using different methods. ... 38
Figure 3-5 TEM micrographs of GA coated magnetic nanoparticles taken at different magnifications: (a), (b) MNP_GAADS; (c), (d) MNP_GA_GAADS; (e), (f) MNP_GAAPTS; (g), (h) MNP_GAEDC. ... 41
Figure 3-6 DLS results for the nanoparticle size (nm). ... 43
Figure 3-7 TEM results for the nanoparticle size (nm). ... 43
Figure 3-8 DLS results for the nanoparticle Zeta potential (mV). ... 43
Figure 3-9 Displacement of adsorbed or covalently bound Gum Arabic on magnetic nanoparticles by different phosphate buffer solutions. ... 45
Figure 4-1 Phase contrast photographs of mammalian cell lines grown in the absence or in the presence of different MNPs. ... 54
Figure 4-2 Comparison of the amount of MNPs observed at cellular surface between (a) HEK293, (b) CHO and (c) TE671 cells. ... 56
Figure 4-3 Phase contrast photographs of HEK293 cells grown in the absence or in the presence of different MNPs. ... 59
Figure 4-4 Comparison of the amount of MNPs observed at cellular surface of HEK293 cells at different incubation times. ... 60
Figure 4-5 Phase contrast (left) and fluorescence microscopy photographs (right) of cells grown for 24 hrs in the absence or presence of GA. ... 62
7
Index of Tables
Table 1-1 Potential applications for magnetic iron oxide (Fe3O4) nanoparticles ... 12 Table 1-2 Different compounds which can be used for nanoparticle coating. ... 14 Table 1-3 Interaction studies of magnetic iron oxide nanoparticles and cells. ... 17 Table 2-1 Massart's synthesis results: Particle size and Zeta potentials as a function of stirring speed and time of synthesis ... 24 Table 2-2 Size distribution and zeta potential results for bare magnetite and the Gum Arabic-co-precipitated magnetic nanoparticle synthesis. ... 27 Table 2-3 Comparison of FTIR results obtained for bare magnetite nanoparticles, Gum Arabic and GA-co-precipitated nanoparticles. ... 28 Table 3-1 Adsorption and covalent coupling maxima. ... 38 Table 3-2 Nanoparticle and MNP agglomerate average diameter determined from TEM micrographs. ... 40 Table 3-3 Size distribution and Zeta potential results for the surface modified
8
Glossary
BET – Brunauer, Emmet and Teller CHO – Hamster Chinese Ovary cells DLS – Dynamic Light Scattering FITC – Fluorescein isothiocyanate
FTIR – Fourier Transform Infrared Spectroscopy GA – Gum Arabic
GA–FITC – Gum Arabic marked with Fluorescein isothiocyanate HEK293 – Human Embryonic Kidney cells
MNPs – Iron Oxide Magnetic Nanoparticles MNP – Magnetic Nanoparticles (uncoated)
MNPagg– Magnetic Nanoparticles (uncoated) analyzed several days after synthesis
MNP_GAADS – Magnetic Nanoparticles with adsorbed Gum Arabic
MNP_GAAPTS – Magnetic Nanoparticles with covalently coupled Gum Arabic via Gum Arabic amine groups
MNP_GAEDC – Magnetic Nanoparticles with covalently coupled Gum Arabic via Gum Arabic carboxyl groups
MNP_GA – Magnetic Nanoparticles co-precipitated with Gum Arabic
MNP_GAagg – Magnetic Nanoparticles Co-precipitated with Gum Arabic analyzed 23 days after synthesis
MNP_GA_GAADS – Magnetic Nanoparticles co-precipitated with Gum Arabic and with adsorbed Gum Arabic
MNP_GAADS – FITC – Magnetic Nanoparticles with adsorbed Gum Arabic marked with Fluorescein isothiocyanate
MNP_GAAPTS – FITC – Magnetic Nanoparticles with covalently coupled Gum Arabic via Gum Arabic amine groups marked with Fluorescein isothiocyanate
MNP_GAEDC – FITC – Magnetic Nanoparticles with covalently coupled Gum Arabic via Gum Arabic carboxyl groups marked with Fluorescein isothiocyanate
MNP_GA_GAADS – FITC – Magnetic Nanoparticles co-precipitated with Gum Arabic and with adsorbed Gum Arabic marked with Fluorescein isothiocyanate
9
Abstract
10
Resumo
11
Chapter 1 – Literature Review
The term "nanotechnology" was firstly used by Professor Norio Taniguchi in 1974: “'Nano-technology mainly consists of the processing of, separation, consolidation, and deformation of materials by one atom or by one molecule [1]. Although there is not a uniformly agreed definition of nanotechnology (derived from the Greek word nano meaning dwarf), the widely accepted National Nanotechnology Initiative (NNI) definition states: “[Nanotechnology refers to] the understanding and control of matter at dimensions of roughly 1 to 100 nanometers, where unique phenomena enable novel applications [2].
Nanoparticles are structures between 1 and 100 nanometers, which may be synthetic (e.g. catalysts and probes) or naturally occurring (e.g. colloids, aerosols). These particles may be subclassified, as being organic (carbon containing) or inorganic, and relatively to their structure, as sphere, tube, colloid, quantum dot, fiber, rod, crystal, fullerene or other. Nanoparticles may also contain oxides, metals, salts, polymer and aerosol that are critical to function. Colloids, aerosols, and even viruses are examples of naturally occurring organic nanoparticles, synthetic nanoparticles include catalysts and probes [3, 4]. Nanoparticles are one of the important building blocks in the fabrication of nanostructured materials and devices with adjustable physical and chemical properties. As intermediates between the molecular and the solid states, inorganic nanoparticles combine chemical accessibility in solution with physical properties of the bulk phase, displaying unique electrical, optical, mechanical and magnetic properties. Nanotechnology can be roughly divided into categories that include nanobiotechnology, biological micro-electromechanical systems, microfluidics, biosensors, microarrays [5] , and tissue microengineering [6].
1.1. Magnetic
Nanoparticles
12 most commonly studied and employed for biomedical applications (5-20 nm in diameter) [18, 19]. Several applications of magnetic iron oxide nanoparticles are summarized in Table 1-1. Magnetite is considered to be a very promising candidate because its biocompatibility has been already proven [18, 20, 21].
Table 1-1 Potential applications for magnetic iron oxide (Fe3O4) nanoparticles
MNP Type Applications References
Medical
50 – 100 nm sized Fe3O4 nanoparticles
Drug targeting and delivery - Local chemotherapy
[7, 10-13, 22] MNPs with ligands
attached
Recognition and attachment to damaged or diseased tissue followed by release therapeutic compound e.g.
Buckyball-based treatment for AIDS
Fe3O4 nanoparticles Hyperthermia treatments against cancer [17]
Tissue repair and engineering [23]
Diagnostic
Fe3O4 nanoparticles
Electrochemical immunoassay [24]
Magnetic imaging applications (MRI) [3, 10, 12]
Cell labelling (in vivo) [25]
Separation/selection, Magnetofection Magnetorelaxometry and Magnetic
ELISA
[18, 26-28]
Detection of early stage diseases such as cancer to allow early treatment
[29]
Portable diagnostic labs for pharmaceutical chemical industry or
disease prevention and control
[29]
Bioremediation / Bioseparation
Fe3O4 nanoparticles treated with Gum
Arabic
Environmental contaminant remediation - removing copper ions from aqueous
solutions
[30]
Iron/iron oxide nanoparticles
Removal of trace catalyst impurities
(Co2+, Ni2+, Rhx+, Pd2+, Ag+ and Pt4+)
from coordinating environments.
[31] Other Biotechnological applications Modified Fe3O4 nanoparticles
Biomagnetic separation and purification [24, 32-34]
Biomolecules immobilization [35, 36]
Catalysis [9]
In the absence of any surface coating, magnetic iron oxide particles have hydrophobic surfaces. Nevertheless, due to anisotropic dipolar attraction, arising out of large surface area to volume ratio, unmodified magnetic nanoparticles of iron oxide tend to aggregate into large clusters that are non-biocompatible [37].
1.2. Synthesis and modification of Iron Oxide Magnetic
Nanoparticles
13 Nanoparticles may be synthesized by gas phase deposition, electron beam lithography, thermal decomposition of iron pentacarbonyl and sonochemical decomposition of Iron carbonyl [19, 21]. Nanoparticles may also be prepared by partial oxidation of aqueous ferrous hydroxide gel [39], sol-gel preparation or polymer matrix-mediated synthesis [19]. The wet chemical routes to prepare magnetic nanoparticles such as reduction of Iron Salts and Oxides (“arrested precipitation”) are considered to be simpler and efficient, controlling size, composition and sometimes the shape of the nanoparticles. Magnetite particles can be prepared by alkalinizing stoichiometric mixtures of ferrous and ferric ions with aqueous NH3 in aqueous solutions or in microemulsions at room temperature. The most used method for the synthesis of iron oxides (Fe3O4 or γ-Fe2O3) is the co-precipitation of Fe2+ and Fe3+ aqueous salt solutions by addition of a base, conventionally, magnetite is prepared by adding a base to an aqueous mixture of Fe2+ and Fe3+ chloride at a 1:2 molar ratio (Massart’s Method) [38]. The control of size, shape and composition of nanoparticles depends on the Fe2+ and Fe3+ ratio, the type of salts used (e.g. chlorides, sulphates, nitrate and perchlorates), pH and ionic strength of the media. Removing the oxygen from the environment, not only protects critical oxidation of the magnetite but also reduces the particle size [19].
14 covalent bond. Nonionic, water compatible, flexible and well-hydrated polymers are preferred [49]. Several types of coatings have been studied for the surface modification of nanoparticles, such as natural and synthetic polymers [7]. The table summarizes some of the different coatings used for nanoparticle modification [7, 25].
Table 1-2 Different compounds which can be used for nanoparticle coating (adapted from [7]).
Compounds References
NAT
UR
AL
Albumin [15, 50]
Alginate [51]
Chitosan [48, 52-55]
Dextran Dextrin
[48, 56] [15, 57]
Fatty acids [58]
Gelatin [14]
Gum Arabic [48, 58-62]
Polypeptides [63, 64]
Phosphorylcholine [65]
Silica [51, 54, 66]
Oleic acid [55, 67]
Oleylamine [59]
SYNTHETIC
Polyacrylic acid [67]
Polyethylene glycol (PEG) [7, 16, 49, 56, 59, 68]
Poly (D, L-lactide) [50]
Poly(N-isopropylacrylamide)
(PolyNIPAAM)
[69]
Polyvinyl alcohol (PVA) [70]
Polyvinylpyrrolidone (PVP) [71]
Gum Arabic
15
β-D-(1→3) linkages and side chains or branched oligosaccharides linked to the main chain by β-D-(1→6) linkages. The oligosaccharides may contain terminal rhamnosyl units linked (1→3) or terminal arabinofuranosyl units linked (1→4) to internal galactosyl or glucuronosyl units [72]. The proposed “waddle blossom” structure for GA with a number of polysaccharide units linked to a common polypeptide chain is presented in the figure:
Figure 1-1 Proposed structure for GA (after Islam et al [73]).
GA is a substance that is generally recognized as safe (GRAS) for direct addition to human food and cosmetic formulations. It has been used in various industries as an emulsifier and stabilizer for oils and flavourings [73-76]. Is negative in several genotoxicity assays, is not a reproductive or developmental toxin, and is not carcinogenic when given intraperitoneally or orally. Clinical testing indicated some evidence of skin sensitization with GA [72]. Pharmacologically, GA has been claimed to act as an anti-oxidant, to protect against experimental hepatic-, renal- and cardiac toxicities in rats, and to alleviate the adverse effects of chronic renal failure in humans. Reports on the effects of GA on lipid metabolism in humans and rats are at variance, but mostly suggest that GA ingestion can reduce plasma cholesterol concentrations in rats. GA has proabsorptive properties and can be used in diarrhoea. GA enhances dental remineralization, and has some antimicrobial activity, suggesting a possible use in dentistry. No significant adverse or toxic actions have been associated with the use of GA [77].
This remarkable and complex material has displayed the ability to sustain colloidal stability for carbon nanotubes in aqueous solutions due to unspecific physical adsorption [61], acts as a steric stabilizer in the preparation of colloidal copper particles [62] and in the preparation of biocompatible quantum dot nanocolloids [78].
16 for very different applications (as it can be seen from Table 1-1 and Table 1-2). Wilson et al (2008) [59], used Gum Arabic for the surface modification of magnetic nanoparticles, in order to stabilize the colloidal suspension of magnetic nanoparticles to be used in interaction studies with L929 fibroblast cells. In the same study magnetic nanoparticle co-precipitation with oleylamine was also tested. Banerjee et al (2007) [60] grafted Glucose into Gum Arabic modified magnetic nanoparticles so as to study the specific interaction with concanavalin A. In 2007 and 2008, the same group [79, 80] fabricated a novel magnetic nanocarrier for targeted anticancer drug delivery by conjugating cyclodextrin onto Gum Arabic modified magnetic nanoparticles using hexamethylene diisocyanate as a linker. Jayakrishnan et al, in 2007 [81], prepared a self-gelling primaquine-(periodate-oxidized)Gum Arabic conjugate for injectable controlled delivery system for primaquine in anti malaria and antileishmanial therapies, and also in 2007, the same group synthesized and evaluated ampicillin-conjugated (periodate-oxidized) Gum Arabic microspheres for sustained release [82].
1.3. Interaction of Magnetic Iron Oxide Nanoparticles and Cells
All nanoparticles synthesized and surface modified with the proper coating materials and developed for biomedical applications, need to be further tested in contact with cells – in vitro studies to ascertain the influence on cellular growth and viability. Table 1-3 summarizes the examples of such studies.
17
Table 1-3 Interaction studies of magnetic iron oxide nanoparticles and cells.
Nanoparticle Coating Cell type Application Reference
- Lung epithelium cells Study of pulmonary
response to MNPs
[83]
2-aminoethyl-phosphonic acid/Folic acid
Human cervix adenocarcinoma HeLa and human osteosarcoma,
MG-63 cell lines
Cancer-specific targeting [37] (5-hydroxy-5,5 -bis- (phosphono) pentanoic acid
MDA-MB-231 and MDA-MB-435 breast cancer cells
Diagnostics and therapy
[84]
Ceruloplasmin and lactoferrin
Human dermal fibroblasts Targeting cell surface
receptors
[85]
Chitosan Human dermal fibroblasts Cell invasion in tissue
engineering
[52]
Citrate anions Mammalian cells: Immune cells:
raw macrophages (mouse); hybridomas (mouse); dendritic cells
(human); OT-1 lymphocytes (mouse); EL4-B lymphocytes
(human).
Therapeutic adult cells: hepatocytes (mouse); gingival fibroblasts (human); smooth muscle cells (rat).
Therapeutic stem cells or progenitor cells: myogenic precursor cells (pig); endothelial
progenitor cells (human).
Tumor cells: HeLa ovarian carcinoma (human); PC3 prostatic carcinoma (human); HuH7 hepatic
carcinoma (human).
Cell labeling [86]
Dextran Human natural killer (NK) T cells Cell labeling [25]
Dextran Adherent human prostate cells
(DU-145) and murine suspension lymphoma cells
Cancer therapy, blood purification, lymph
node imaging, hyperthermia
[87]
Dimercaptosuccinic acid Human monocytic cell line, U937 MRI [88]
Gum Arabic and Oleylamine
L929 fibroblasts Cell targeting [59]
Polyethylene glycol (PEG) and folic acid
Mouse macrophage (RAW 264.7) and human breast cells (BT20)
Improve cell internalization and
target cancer cells
[56]
Polyethylene glycol (PEG)
Human dermal fibroblasts Drug delivery and
targeting
[16]
Silica/Polyethyleneimine (PEI)
HEK293 T cells DNA-binding and
transfection
[89]
Transferrin Human dermal fibroblasts Drug targeting [90]
18
1.4. Aims of the work
The main goals of this project were the functionalization of magnetic nanoparticles (MNPs) with a biocompatible polymer known as Gum Arabic (GA) and the study of the effect of these modified particles on the growth and survival of mammalian cell cultures.
19
Chapter 2 – Synthesis of Magnetic Nanoparticles
2.1. Introduction
Magnetic nanoparticles (MNPs) are particles composed of a magnetite Fe3O4 or maghemite (γ- Fe2O3) core, with sizes ranging from 5 – 100 nm. Applications of MNPs cross through industry, biomedicine and other biologically related fields [17, 23]. Powder or composite MNPs are being studied for in vivo and in vitro applications. The former involves applications in medical diagnostic (magnetic resonance imaging (MRI) [11, 12, 17]) and in therapeutics (hyperthermia treatments against cancer [17], drug targeting and drug delivery [11-13]); the latter involves cellular therapy, bioseparation processes, tissue repair, magnetofection and gene therapy [26, 27], magnetorelaxometry and magnetic ELISA [28]. For these purposes, MNPs must have combined properties of high magnetic saturation, biocompatibility and interactive functions at the surface. MNPs surface modification can be performed by the creation of a few atomic layers of an organic polymer, an inorganic metal (e.g. gold), or oxide surfaces (e.g. silica or alumina), suitable for further functionalization with various bioactive molecules [19]. Several surface modification studies have been performed in iron oxide nanoparticles, including the use of surfactants for control of nanoparticle size by reduction of agglomerates formed during and after MNP synthesis [91, 92]. MNPs tend to agglomerate during synthesis in order to reduce surface energy, a process facilitated by strong magnetic dipole-dipole attraction [62]. Tetramethylammonium hydroxide (TMA) has been also used efficiently in redispersing nanoparticle agglomerates [92] but it is not biocompatible due to its high alkalinity. Other surface modifications may include materials so as to improve biocompatibility [62]. Many materials have been used in several experiments although few act as dispersing agents in aqueous solutions in an efficient and lasting way. The most commonly studied polymers for MNP coating for biomedical applications are dextrin [15, 57] and polyethylene glycol (PEG) [7, 16, 49, 56, 59, 68].
20 nanoparticle agglomeration during synthesis. Nanoparticle characterization was performed using Dynamic Light Scattering (DLS), Transmission Electron Microscopy (TEM), Fourier Transformed Infra Red spectroscopy (FTIR) and Brunauer, Emmett and Teller (BET) analysis.
2.2. Materials
and
Methods
2.2.1. Materials
Iron (III) chloride hexahydrate (FeCl3.6H2O), Iron (II) chloride tetrahydrate (FeCl2.4H2O) and Ammonium hydroxide solution puriss. p.a., 25% NH3 in H2O (NH4OH) were purchased from Fluka. Gum Arabic and KBr were purchased from Sigma-Aldrich.
2.2.2. Equipments
Solid reagents were weighed in an Analytical Balance Sartorius BL6100. Magnetic nanoparticle synthesis was performed using an Electronic Overhead Stirrer RZR 2051 Control from Heidolph. Sonication of MNPs solutions was performed in a Bandelin Sonorex super RK25577 sonicator. Size distribution and Zeta Potential measurements of nanoparticle samples were performed in a Dynamic light scattering Zetasizer Nano ZS from Malvern. FTIR spectra were performed in a Satellite FTIR Mattson Spectrometer. Transmission electron microscopy of the nanoparticle samples was performed in an Analytical TEM Hitachi 8100 with Rontec standard EDS detector and digital image acquisition. BET analysis was performed in a Micromeritics ASAP2010 analyzer.
2.2.3. Methods
2.2.3.1. Synthesis of Magnetic Nanoparticles at different reaction times
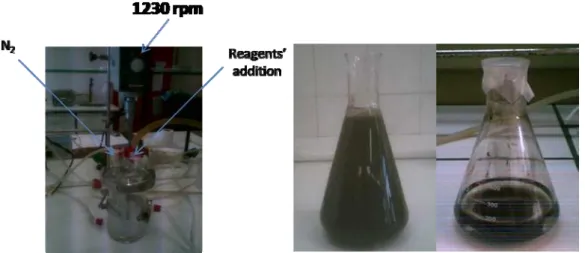
21 water was added drop wise to the ammonium hydroxide solution. The reaction proceeded up to 4,5 hours under a continuous flow of N2 (Figure 2-1 (a)). A sample was taken every 30 minutes and the pH was monitored and maintained at 10 by the addition of NH4OH solution. Afterwards, the particles were left to deposit by means of a magnet at room temperature (Figure 2-1 (b)-(c)). The supernatant was discarded and the particles washed several times with de-ionized water to remove the ammonia left in solution. The nanoparticle solution in de-ionized water was kept at 4ºC until further use. Dynamic light scattering (DLS) and Zeta potential measurements were used for MNP sample characterization.
Figure 2-1 (a) Massart’s Synthesis equipment; (b) Nanoparticle (MNP) solution as taken
from the reactor; (c) Washing of MNP solution with deposition of magnetic nanoparticles
by means of a magnet.
2.2.3.2. Synthesis of Magnetic Nanoparticles with different stirring conditions
Magnetic nanoparticles (MNP) were synthesized as described in 2.2.3.1. with the exception that the stirring speed was varied during synthesis (600, 1230 and 1600 rpm). Also, the reaction proceeded up to 4,5 hours under a continuous flow of N2 and samples were taken at 2 and 4,5 hours.
2.2.3.3. Synthesis of Magnetic Nanoparticles by co-precipitation with GA
22 iron oxide solution. The reaction proceeded up to 4,5 hours and samples were taken at 2 and 4.5 hours.
2.2.3.4. Characterization of synthesized Magnetic Nanoparticles
Nanoparticles synthesized by the methods described in sections 2.2.3.1 to 2.2.3.3 were characterized using DLS, TEM, FTIR and BET analysis.
DLS was utilized for the determination of hydrodynamic size and zeta potential values of MNPs. These indicate the size distribution of MNPs and the electrokinetic potential in colloidal systems (an indication of colloidal stability), respectively. Nanoparticle samples with a final concentration of 1 mg/ml in distilled water were filtered through a 30 µm pore filter. Before each measurement, samples were sonicated and the sample chamber was washed with deionized water to remove any residues.
The TEM analysis was utilized for the characterization of particle morphology and estimation of the size of the magnetic core. The nanoparticle samples were dried under vacuum for 5 hours. The dried nanoparticle samples were observed by Eng. Isabel Nogueira (IST – UTL). All samples were prepared by evaporating dilute suspensions on a carbon-coated film.
FTIR spectra were generated for untreated magnetite nanoparticles as well as those nanoparticles precipitated with Gum Arabic to help identify the differences between functional groups of the various samples. Nanoparticles were dried under vacuum for 5 hours. Nanoparticle samples were prepared as a crushed powder weighing approximately 1 mg and mixed together with 100 mg of crushed KBr. Spectra were taken between 500 and 4000 cm-1.
23
2.3. Results and Discussion
The main goal of the studies on the MNP synthesis was to prepare dispersed particles at the nanometer scale. In order to choose suitable protocols for nanoparticle synthesis two parameters were considered: particle size and Zeta potential values. Particles with Zeta potentials more negative than -30 mV or more positive than +30 mV were considered stable [93]. Nanoparticles synthesized at different times and by varying stirring conditions were analysed by DLS and TEM. In Figure 2-2 plots of particle size and Zeta potential as a function of time of synthesis are respectively presented.
Figure 2-2 Massart synthesis results. (a) Particle size as a function of time of synthesis
(n=12); (b) Zeta Potential as a function of time of synthesis (n=12).
24 size distribution and Zeta potentials are high comparing to the values they are referring to, but there is no evident variation of these parameters with time. The size and zeta potential values stabilize after 120 minutes of reaction time.
Further studies were addressed, by varying stirring conditions for a 2 and 4,5 hours reaction. In our laboratory, it was previously observed that particles synthesized at periods shorter than 2 hours presented low magnetic response [94]. Accordingly, a 2 hour reaction time was chosen. A 4,5 hours reaction time was used for comparison. The commonly used stirring speed is at 1230 rpm and therefore was selected as a starting point for variation. The variation of particle size and zeta potential as a function of stirring conditions and time are presented in Table 2-1.
Table 2-1 Massart's synthesis results: Particle size and Zeta potentials as a function of
stirring speed and time of synthesis
Stirring 600 rpm (n=1) 1230 rpm (n=3) 1600 rpm (n=1)
Time (min) Size (nm) Zeta (mV) Size (nm) Zeta (mV) Size (nm) Zeta (mV)
120 933±53 -15,8±0,7 923±128 -14,2±4,2 1014±202 -15,7±1,8
270 1091±156 -18,8±0,9 982±354 -14,8±1,5 1183±75 -14,5±2,6
The results presented in Table 2-1 show that the nanoparticle sizes for all the stirring conditions tested (600, 1230 and 1600 rpm) are similar, although the nanoparticle size obtained in the 2 hour synthesis is lower for the nanoparticles synthesized at 1230 rpm. The zeta potential values for the 2 and 4,5 hour reaction is less negative for the 1230 rpm samples, and more negative for the other stirring speeds, specially the 600 rpm, for the 2 and 4,5 hour reaction. The zeta potentials varied between -14,2 ± 4,2 and -18,8 ± 0,9 mV, within the +30 to -30 mV range that is related to nanoparticle instability in solution. The approximation to more negative zeta potentials (-30 mV) shows a tendency to an increase in particle stability [93].
25 as favorable as the size results for the chosen conditions, a small nanoparticle size was considered more important than stability as a parameter for the optimization of MNP synthesis. This is because small particles are usable in many applications and the stability of MNPs may be improved later with an appropriate surface modification of the synthesized nanoparticles [19].
The nanoparticle synthesis was performed for 2h reaction time, with 1230 rpm stirring speed and the synthesized nanoparticles were further characterized by DLS, TEM, FTIR and BET analysis. The DLS experiments were repeated on the same MNPs one month after synthesis.The MNPs presented an average size of 1477 ± 136 nm, showing minor peaks at 200 nm and 5000-6000 nm, which reflects the formation of agglomerates after particle synthesis leading to a greater sample heterogeneity. The correspondent zeta potential values were 19,6 ± 1,2 mV, which apparently reflects an improvement in colloidal stability.
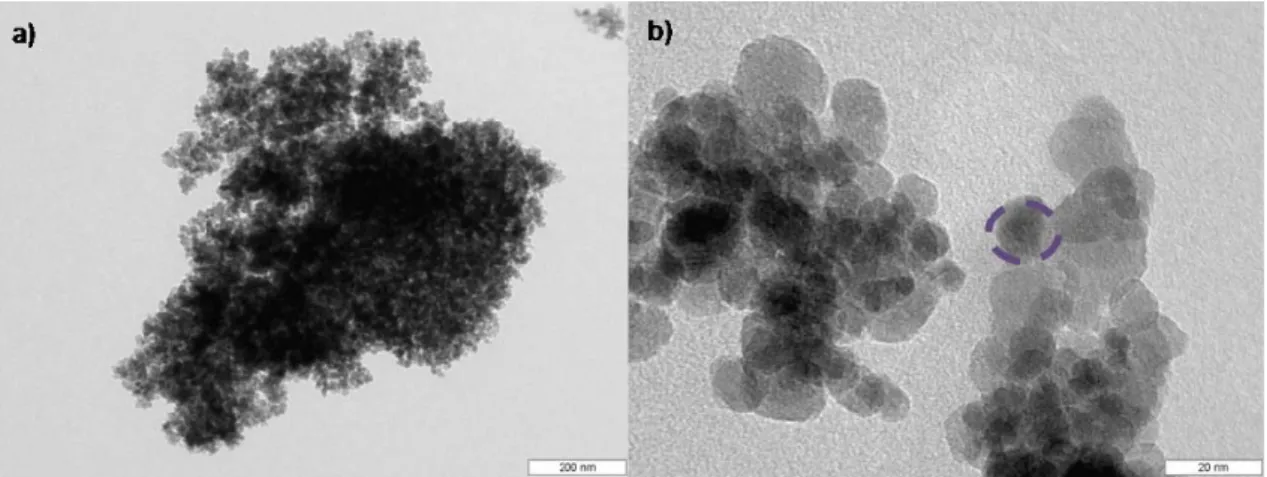
26
Figure 2-3 TEM micrographs of magnetic nanoparticles taken at different magnifications
(a) cluster of particles; (b) dotted circle indicates a single particle witthin the cluster.
The BET analysis of the magnetic nanoparticles synthesized by the Massart’s method resulted in a specific area of 908 m2/g, a micropore volume of 0,65 cm3/g and a total pore volume of 0.83 cm3/g.
The FTIR spectrum of the iron oxide nanoparticles showed characteristic OH stretching (ν OH) and HOH bending (δ OH) vibrational bands at 3443 cm-1 due to the adsorbed water in the sample. A peak at 1614 cm-1 is identified. A ν(Fe-O) peak is observed for the bare magnetite sample at 571 cm-1 .
27
Table 2-2 Size distribution and zeta potential results for bare magnetite and the Gum
Arabic-co-precipitated magnetic nanoparticle synthesis (n=3).
Sample Size (nm) Zeta potential (mV)
MNP 923±128 -14,2±4,2
MNPagg 1477±136 -19,6±1,2
MNP_GA 341±69 -22,1±2,8
MNP_GAagg 1108±263 -13,4±2,1
The GA-co-precipitated MNPs are clearly smaller than bare magnetite. On the other hand, as previously observed, the MNPs analyzed approximately one month after synthesis reflected agglomeration. There are minor peaks at 100-200 nm and 5000-6000 nm, showing some degree of heterogeneity in the GA-co-precipitated MNP samples. These results contradict the ones obtained by Williams et al. (2006) [62] and Wilson et al. (2008) [59], as in these works larger agglomerates were obtained for GA-co-precipitated nanoparticles than for bare magnetite nanoparticles. These agglomerates presented an average size of 1000 nm which is within the range of the MNP_GAagg. The agglomeration of GA-co-precipitated MNPs after synthesis may be due to complex bridging interactions, formed when part of the large GA molecule is adsorbed onto the surface of two or more particles [62].
Comparing the zeta potential values for the GA-co-precipitated MNPs and bare magnetite before agglomeration, it is clear the stabilizing effect of GA [62]. However, after agglomeration occurs two sets of results can be observed. For the bare magnetite particles, the agglomeration leads to a more negative zeta value. For the GA-co-precipitated MNPs, the agglomeration leads to less negative zeta values and therefore a loss of colloidal stability.
28 ± 3 nm). In the micrographs (Figure 2-4 (a)-(b)) smaller agglomerates of MNPs (950 nm) are observed in comparison with those observed in bare magnetite particles.
Figure 2-4 TEM micrographs of GA-co-precipitated magnetic nanoparticles taken at
different magnifications (a) cluster of particles; (b) dotted circle indicates a single particle
witthin the cluster.
A FTIR spectrum was generated for Gum Arabic and for GA-co-precipitated nanoparticles so as to identify the functional groups present in the samples. The FTIR results for the bare magnetite nanoparticles, Gum Arabic and GA-co-precipitated magnetic nanoparticles are comprised in Table 2-3.
Table 2-3 Comparison of FTIR results obtained for bare magnetite nanoparticles, Gum
Arabic and GA-co-precipitated nanoparticles.
MNP opt (cm-1) GA-co-precipitated MNP (cm-1) GA (cm-1)
3450 3443 3450
- - 2926
2371 – 2272 2329 2397 – 2349
1614 1614 1638 – 1600
- - 1424
- - 1032 – 1076
- 1000 977
29 The analysis of the FTIR spectra was not facilitated by the superposition of many peaks characteristic of GA and MNPs. From FTIR results, it can be seen that, the spectrum of the iron oxide nanoparticles (untreated and treated) and Gum Arabic contain characteristic OH stretching (ν OH) and HOH bending (δ OH) vibrational bands at 3443 - 3450 cm-1 due to the adsorbed water in the sample. The 2926 cm-1 peak in GA is characteristic of stretching vibrations of the C-H bond (ν C-H of –CH2). In GA the absorption band at 2397 – 2349 cm-1 is usually due to CO2 vibration. A carboxylate group associated with the Gum Arabic molecule shows a strong peak at 1600 - 1638 cm -1
(C=O stretch and N-H bending) in GA sample [43] and a peak at 1614 cm-1 is identified in optimized MNP and GA-co-precipitated MNP. Bands in the regions of 1424, 1000 and 977 cm-1 in GA and GA-co-precipitated MNPs are due to the C-O bond stretch indicating GA presence in GA-co-precipitated MNPs. A ν(Fe-O) peak is observed for the bare magnetite sample at 571 cm-1. A superposition of a GA peak at 552 cm-1 with a characteristic ν(Fe-O) peak (566) [30, 57, 68, 96] at 571 cm-1 is observed for the GA-co-precipitated MNP sample. Adsorption bands for amine groups in GA, bands due to N-H stretch for primary amine (3400 - 3500 cm-1) and secondary amine (3310 – 3350 cm-1), have not been clearly identified in these samples. An explanation possible is that Gum Arabic is made up of a high molecular weight glycoprotein and a higher amount of a lower molecular weight polysaccharide and the adsorption bands due to the N-H stretch may be covered by the broad adsorption band at 3000 – 3600 cm-1 due to the O-H stretch of the polysaccharide [97] . These results confirm the success of the adsorption of GA onto bare MNPs.
2.4. Conclusions
30 Aggregates formed during time after synthesis for bare magnetite (MNPagg)(1477 ± 136 nm) displayed higher sizes compared to GA-co-precipitated nanoparticle aggregates (MNP_GAagg)(1108 ± 263 nm). Zeta potential measurements provided further confirmation of Gum Arabic contribution to MNP stability in aqueous solution. Zeta potential values obtained for MNP and MNP_GA showed an increase in the MNPs dispersivity provided by GA during MNPs synthesis. GA-co-precipitated MNP agglomeration over time led to an increase in zeta potential values, showing a reduction in nanoparticle stability in solution due to particle agglomeration. Gum Arabic presence in MNP_GA was identified by FTIR spectra, as a characteristic GA peak (977 cm-1) was observed in GA-co-precipitated nanoparticle samples (MNP_GA) at 1000 cm-1.
31
Chapter 3 – Surface Modification of Magnetic
Nanoparticles with Gum Arabic
3.1. Introduction
Magnetic nanoparticles (MNPs) have a tendency to aggregate during and after synthesis as a way to reduce surface energy. In order to prevent nanoparticle aggregation and to improve biocompatibility, the surface of the magnetic nanoparticles can be modified with polymers such as dextrin [15, 57], polyethyleneglycol (PEG) [7, 16, 49, 56, 59, 68], oleylamine [59], chitosan [52-55], oleic acid [55, 67], dextran [48, 56] and albumin [15, 50]. Recently, a polymer known as Gum Arabic (GA) has been shown to sustain colloidal stability for carbon nanotubes in aqueous solutions [61], to act as a steric stabilizer in the preparation of colloidal copper particles [53], and in the stabilization of MNPs [28, 59, 62]. GA is found in nature as a mixture of calcium, magnesium and potassium salts of a polysaccharide acid (Arabic acid). It is predominantly a carbohydrate with about 2% of protein rich in hydroxyprolyl, prolyl and seryl residues, being responsible for its emulsifying activity [73, 98]. GA has a waddle-blossom structure with a number of polysaccharide units (blocs) linked to a common polypeptidic chain.
32
3.2. Materials and methods
3.2.1. Materials
APTS (3-Aminopropyl) triethoxysilane, 99% (lot 12915KD-106), Gum Arabic, N’, N’’ – dimethylformamide (DMF) ≥99,8% A.C.S Reagent (319937) and KBr were purchased from Sigma-Aldrich.
Acetone p. a. (44477), Dimethylsulphoxide (DMSO) puriss p. a. ≥99,5% (GC) (41644), EDC (N-(3-dimethylaminopropyl)-N’-ethylcarbodiimide) (39391), Hydrochloric Acid (84426), Ninhydrin puriss p.a. ≥99% (33437), Phenol purum ≥99,0% (GC) (77612) and Potassium cyanide puriss p. a. ≥98,0% (AT) (60179) were purchased from Fluka. Bicinchoninic Acid Kit for Protein Determination (BCA1) for 200-1000 μg/ml protein (096K9802), 6-APA (ε-Amino-n-caproic acid) (A-2504), Glutaraldehyde 50 wt. % in H2O (lot S36104-217) and Sodium Hydroxide, reagent grade, 97%, beads (367176) were supplied by Sigma.
Sodium Chloride puriss p.a. (31434) was purchased from Riedel de Haën.
Sodium dihydrogen phosphate monohydrate (NaH2PO4 * H2O) (A896946607) and Sodium tetraborate (Na2B4O7) (6306 – A655106) were supplied by Merck.
3.2.2. Equipments
Solid reagents were weighed in an Analytical Balance Sartorius BL6100. Nanoparticle solution sonication was performed in a Bandelin Sonorex super RK25577 sonicator. The amination reaction, Kaiser and TNBS tests were performed in a water-bath from Memmert. Gum Arabic stock solution and Nanoparticle solution centrifugations were performed in a Beckman Avanti Centrifuge J-25 – Beckman Rotor JA-25-50 and in an Eppendorf Centrifuge 1-15K from Sigma Sartorius, respectively. Throughout the laboratory work solutions were homogenized with Magnetic stirrer KMO2 electronic Janke Kunkel IKA from Labortechnik and with a Vortex TM1 from Techmatic. During functionalization reactions, samples of nanoparticle solution were shaken in a Swinging Shaker Rotabit from P Selecta.
33 Spectrometric readings were performed in a Helios Alpha UV-Vis spectrophotometer from Spectronic Unicam (Thermo Unicam) in cuvettes UV transparent from 220 nm (D-51588) from Sarstedt. Readings of microplates were performed in a Microplate reader Infinite M200 from Tecan with i-control interface software. Size distribution and Zeta Potential measurements of the nanoparticle samples were performed in a Dynamic light scattering Zetasizer Nano ZS from Malvern. FTIR spectra were performed in a Satellite FTIR Mattson FTIR Spectrometer. Transmission electron microscopy (TEM) of the nanoparticle samples was performed in an Analytical TEM Hitachi 8100 with Rontec standard EDS detector and digital image acquisition. BET analysis was performed in a Micromeritics ASAP2010.
3.2.3. Methods
3.2.3.1. Characterization of Gum Arabic in Aqueous Solution
In order to determine the concentration of free carboxylic acid groups in Gum Arabic solutions, titrations with NaOH 0,05 M were performed. The pH value for a 40 mg/ml GA solution at room temperature is 4,52. A volume of 0,475 ml of NaOH 0,05 M was added to 10 ml of 40 mg/ml GA solution, yielding 5,9×10⁻⁸ moles COOH/mg GA.
34 The concentration of GA in aqueous solutions was determined by the microplate bicinchoninic acid test (BCA test) [101]. The BCA reagent for was freshly prepared by mixing reagent A and B in a 50:1 proportion [28]. 50 μl of the samples to be tested were individually added to wells of a 96-well microplate. Then, 200 μl of the BCA reagent were added to each well. The microplate was incubated in the dark at 37ºC for 20 minutes. Absorbance was read at 562 nm and for each assay a calibration curve with GA Standards (0-70 mg/ml) was performed. The calibration curve obtained was Abs=0,014*C+0,021, R2=0,998 (n=10).
3.2.3.2. Adsorption of Gum Arabic onto Magnetic Nanoparticles
OH
OH
OH
Gum Arabic OH
O H OH HC O Gum Arabic
Figure 3-1 Gum Arabic adsorption onto magnetic nanoparticle surface.
Solutions of MNPs (MNP and MNP_GA) (14x1ml of 12 mg/ml nanoparticle suspension) were placed in 14 Eppendorf tubes and washed 6 times with de-ionized water. The volume was completed with 1 ml of standard solutions of GA (0-70mg/ml). The MNP solutions were shaken, sonicated at 10 Watts for 10 minutes and incubated for 1 hour at room temperature under orbital shaking. The solutions were then washed 3 times with de-ionized water, supernatants were removed and stored. The samples were centrifuged in each washing step at 9167g for 15 to 20 minutes. The supernatants were analyzed using the microplate BCA method to determine GA adsorption onto MNPs. DLS, TEM and FTIR were used for MNP characterization (see Chapter 2).
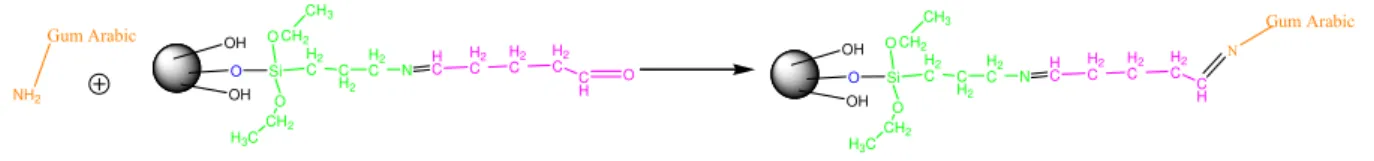
3.2.3.3. Covalent Coupling of GA onto Aldehyde functionalized Nanoparticles (MNP_GAAPTS)
O OH OH Si O O CH2 H2 C C H2 H2 C N CH3 CH2 H3C
H C H2 C H2 C H2 C C H O Gum Arabic O OH OH Si O O CH2 H2 C C H2 H2 C N CH3 CH2 H3C
H C H2 C H2 C H2 C C H NH2 Gum Arabic N
35 MNPs were aminated with APTS reagent. An appropriate volume of nanoparticle solution (14 ml of 12 mg/ml nanoparticle suspension) was washed 6 times with distilled water. The supernatants were discarded and the volume was completed with de-ionized water (14 ml). APTS (2968 μl, 0.4% v/v) was added to the nanoparticle solution. The solution was shaken, sonicated at 10 watts for 10 minutes and incubated for 1 hour at 70ºC in a water-bath [41]. After incubation, the nanoparticle sample was washed 6 times with de-ionized water and the volume was completed with de-ionized water (14 ml). The amount of amine groups at the surface of the MNPs was determined by the Kaiser test using 1ml solutions of MNPs. Typical values were 39,2 ± 11,5 µmol NH2/mg of nanoparticles.
A volume of 0.775 ml of glutaraldehyde (5% v/v) was added to 14 ml of 12 mg/ml the aminated MNP solution. Glutaraldehyde is added in a 1:1 molar ratio relatively to the aminated MNP concentration determined by the Kaiser test. The solution was shaken, sonicated for 10 minutes and incubated for 1 hour at room temperature with orbital shaking. After incubation, the solution was washed 6 times with de-ionized water, the volume was completed with de-ionized water (14 ml). This solution containing aldehyde-functionalized MNPs was divided in 14 aliquots. The particles were left to deposit and the supernatant removed.
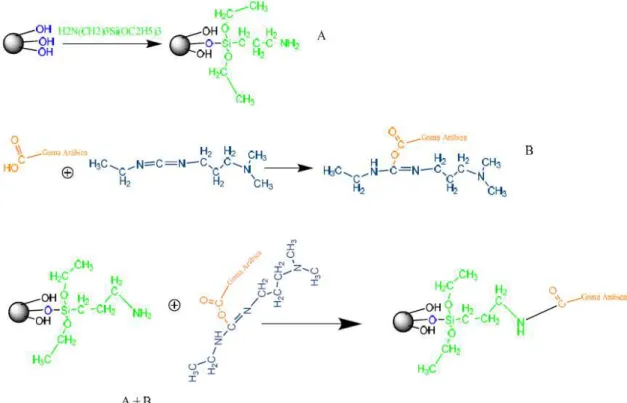
36 3.2.3.4. Covalent Coupling of EDC activated Gum Arabic onto amine
functionalized Nanoparticles (MNP_GAEDC)
A solution of EDC (73μl, 3 equivalents excess of the amount of aminated MNPs) in de-ionized water (1ml) was prepared, and a volume of 91 μl was added to each standard solution of Gum Arabic (1 ml, 0 - 70 mg/ml) and incubated for 15 minutes (Solution A). 14 ml of MNPs functionalized with amines [41] were divided in 14 aliquots (Solution B). The particles were left to deposit and the supernatant removed. A volume of 1 ml of activated-GA (0-70 mg/ml) (Solution A) was added to each aliquot. Samples were shaken, sonicated at 10 watts for 10 minutes and incubated for 2 hours, at room temperature, with orbital agitation. After incubation, samples were washed 3 times with de-ionized water, supernatants were removed and stored. The samples were centrifuged in each wash at 9167 g for 15 to 20 minutes. The supernatants were analyzed using the microplate BCA method to determine GA deposited at the MNPs surface. DLS, TEM and FTIR were used for MNP characterization (see Chapter 2).
Figure 3-3 Covalent coupling between aminated MNPs and EDC functionalized Gum
37 3.2.3.5. GA Displacement Studies
Samples of MNP_GAADS, MNP_GA_GAADS, MNP_GAAPTS and MNP_GAEDC were tested. A phosphate buffer stock solution was prepared (1 M NaH2PO4.H2O and 150 mM NaCl) in de-ionized water. Phosphate buffer standard solutions 100, 10, 1 and 0,1mM were prepared with pH 7,5. Supernatants of MNP sample (1ml) were discarded and 1 ml of phosphate buffer solutions (1000, 100, 10, 1 and 0.1 mM) were added. Samples were shaken, sonicated at 10 watts for 10 minutes and incubated at room temperature for 2 hours in a orbital shaker. After incubation, samples were washed 2 times with de-ionized water and the supernatants were kept. In each washing the samples were centrifuged at 9167 g for 15 to 20 minutes. The supernatants were analyzed using the microplate BCA method to determine GA concentration left in solution (3.2.3.2.).
3.3. Results and Discussion
The quantity of free amine groups present in a 40mg/ml aqueous solution of GA (6×10⁻⁷ mol [NH2]/mg GA) was ten-fold the quantity of carboxylate groups (5,9×10⁻⁸ moles COOH/mg GA). The different amount of amines and carboxylate groups in GA may account for the different values obtained for the covalent coupling either via reaction of GA amine groups with aldehyde functionalized nanoparticles (MNP_GAAPTS), or via reaction of GA carboxylic groups with amine functionalized nanoparticles (MNP_GAEDC).
38
C omparis on between the ads orption and c ovalent binding of G um Arabic on MN P s
0 0.5 1 1.5 2 2.5 3
0 5 10 15 20 25
[G A] m g /m l (e quilibrium )
g a d so rb ed or b o un d G A /g n a nopar ti cl
Figure 3-4 Adsorption isotherms of GA at the surface of MNPs using different methods.
Key: ♦ - GA adsorbed on MNPs; ○ - Covalent binding of GA on glutaraldehyde
functionalized MNPs; ∆ - Covalent binding of GA on aminated MNPs; ■ - GA adsorbed
on GA-co-precipitated MNPs.
The adsorption isotherms followed a Langmuir pattern. The amount of GA adsorbed per gram of particles was distinct for each method Table 3-1.
Table 3-1 Adsorption and covalent coupling maxima.
Sample [GA] (eq.) mg/ml g GA (ads)/ g MNP
MNP_GAADS (n=4) 11,85 ± 0,59 1,09 ± 0,42
MNP_GA_GAADS (n=3) 1,78 ± 0,07 1,05 ± 0,21
MNP_GAAPTS (n=4) 8,62 ± 0,00 0,79 ± 0,00
MNP_GAEDC (n=2) 2,62 ± 0,00 2,80 ± 0,00
39 coupled on amine functionalized MNP (2,80 ± 0,00 g GA /g MNP). This may be due to cross-linking between adjacent GA molecules after EDC activation of Gum Arabic. The carboxyl groups in GA are activated with EDC and may react with the amine groups of other GA molecules forming bridges between neighbor molecules. The remaining activated COOH groups may then react with the amine groups of the MNPs, forming a covalent bond. The maximum of GA adsorption onto bare magnetite, MNP_GAADS (1,09 ± 0,42 g GA/ g MNP) indicates that GA has a high affinity to the iron oxide surface. The binding interaction between GA and the magnetite nanoparticles is probably due to the Gum Arabic COOH group interaction with the hydroxyl groups of bare magnetite nanoparticles [93]. For the MNP_GA_GAADS samples, an adsorption maximum of 1,05 ± 0,21 g GA/g MNP is obtained, a value very close to the maxima obtained for MNP_GAADS. In MNP_GA_GAADS, it is possible that the adsorbed Gum Arabic forms multilayers around the nanoparticles, explaining the adsorption maximum obtained [28]. The values for GA deposited at MNPs surface here presented are 2 to 6-fold higher than data previously obtained by our group [102]. The main difference between these assays was that in the present studies all nanoparticle samples were sonicated before all functionalization and coating steps. With the sonication, better dispersed nanoparticle samples were prepared, allowing for a better nanoparticle coating with Gum Arabic.
From Figure 3-4, an order of saturation of GA adsorption or covalent coupling may be determined: the first sample to reach a saturation stage of GA coating is GA covalently coupled onto amine functionalized MNPs (MNP_GAEDC), then GA adsorbed onto GA-co-precipitated nanoparticles (MNP_GA_GAADS), followed by GA adsorbed on MNPs (MNP_GAADS) and GA covalently bound onto glutaraldehyde functionalized MNPs (MNP_GAAPTS). The same order of saturation was obtained previously by our group.
40 magnetic nanoparticles. Agglomerates of nanoparticles were also observed; the 8000X magnification micrographs show a larger fragment of agglomerated MNPs: 1773 nm for the small and 2818 nm for the large agglomerates of MNP_GAADS, 2045 nm for MNP_GA_GAADS, 1727 nm for MNP_GAAPTS and 1772 nm for MNP_GAEDC.
Table 3-2 Nanoparticle and MNP agglomerate average diameter determined from TEM
micrographs.
Sample MNP Diameter (nm) Agglomerate Diameter (nm)
MNP 11 ± 3 2652
MNP_GA 14 ± 4 950
MNP_GAADS 14 ± 1 1773, 2818
MNP_GA_GAADS 14 ± 1 2045
MNP_GAAPTS 11 ± 3 1727
MNP_GAEDC 12 ± 3 1772
41
Figure 3-5 TEM micrographs of GA coated magnetic nanoparticles taken at different
magnifications: (a), (b) MNP_GAADS; (c), (d) MNP_GA_GAADS; (e), (f) MNP_GAAPTS; (g),
(h) MNP_GAEDC. (a), (c), (e), (g) cluster of particles; (b), (d), (f), (h) dotted circle indicates
42 Size Distribution and Zeta Potential values for the MNP_GAADS, MNP_GA_GAADS, MNP_GAAPTS and MNP_GAEDC samples were performed using DLS. The results obtained are comprised in Table 3-3.
Table 3-3 Size distribution and Zeta potential results for the surface modified
nanoparticles (n = 3).
Sample Size (nm) Zeta (mV)
MNP 1476,67±135,77 -19,63±1,21
MNP_GA 341,33±69,06 -22,07±2,77
MNP_GAADS 1306,67 ± 41,63 -24,67 ± 1,94
MNP_GA_GAADS 1128,67 ± 227,74 -26,00 ± 0,78
MNP_GAAPTS 1500,00 ± 196,98 -26,63 ± 0,49
MNP_GAEDC 1120,00 ± 60,00 -24,53 ± 0,42
The average hydrodynamic diameter of the MNP_GAADS, MNP_GA_GAADS, MNP_GAAPTS and MNP_GAEDC are all similar and within the range 1100-1500 nm. These are similar to the value obtained for bare magnetite (MNP). The particles displaying the smallest diameter are those where GA was added during synthesis (MNP_GA).
43
Figure 3-6 DLS results for the nanoparticle size (nm).
Figure 3-7 TEM results for the nanoparticle size (nm).
44 FTIR spectra were generated for nanoparticles functionalized with amine groups and all the nanoparticle samples coated with GA, in order to identify the functional groups present (Table 3-4).
Table 3-4 Comparison of FTIR results obtained for surface modified nanoparticles with
Gum Arabic. MNP cm-1 GA cm-1 MNP_GA_GAADS cm-1 MNP_GAADS cm-1 MNP_GAAPTS cm-1 MNP_GAEDC cm-1
3450 3450 3429 – 3450 3650 3677 3650
- 2926 2942 2928 2923 2923
2371 – 2272 2397 – 2349 2371 2361
1718 1772 1774
1614 1638 – 1600 1643 1600
1500 1490 1500
- 1424 1458 1458
1386 1384 1384 1384
- 1032 – 1076 1043 1035 - 1065 1035 - 1072
977
- 857 874
802 804 803
571 552 571 566 585
From FTIR results, it can be seen GA is present at the surface of GA coated MNPs. The spectra of the coated iron oxide nanoparticles contains characteristic OH stretching (ν OH) and HOH bending (δ OH) vibrational bands at 3429 - 3450 cm-1 and at 3650 – 3677 cm-1 due to the adsorbed water in the sample. The 2923 - 2942 cm-1 peak is characteristic of GA stretching vibrations of the C-H bond (ν C-H of –CH2) and was observed in all MNPs modified with GA. In GA the absorption band at 2361 – 2371 cm -1
45 respectively [43, 57, 68, 96]. Adsorption bands for amine groups in GA, bands due to N-H stretch for primary amine (3400 - 3500 cm-1) and secondary amine (3310 – 3350), have not been clearly identified in these samples. An explanation possible is that Gum Arabic is made up of a high molecular weight glycoprotein and a higher amount of a lower molecular weight polysaccharide and the adsorption bands due to the N-H stretch may be covered by the broad adsorption band at 3000 – 3600 cm-1 due to the O-H stretch of the polysaccharide [30, 97].
Experiments were conducted in order to ascertain the possible displacement of adsorbed or covalently coupled GA by phosphate ions when the nanoparticles are maintained in phosphate buffer. This test was performed because further tests of the MNPs in mammalian cell cultures include the use of phosphate-based buffers. The displacement studies were performed once and the results are presented in Figure 3-9.
MN P _ G A a d s MN P -G A _ G A a d s MN P _ G A a p ts MN P _ G A e d c 0 0.1 1 10 100 1000 0 10 20 30 40 50 60 %G A r e le a s e d mM phosphate buffer
Figure 3-9 Displacement of adsorbed or covalently bound Gum Arabic on magnetic
nanoparticles by different phosphate buffer solutions (n = 1).
46 a competition for the iron oxide surface occurs between phosphate and GA. A GA displacement is then observed for the highest concentration of phosphate tested. The displacement values obtained are smaller than those reported previously for GA adsorbed at the surface of bare magnetite [28]. The displacement value of 52% for MNP_GAAPTS is very high and was not expected considering that GA is expected to be covalently linked to MNPs.
3.4. Conclusions
Surface modification of MNPs with GA via adsorption or covalent coupling was studied. A range of 0,8 to 2,80 g GA/g MNP was observed for the adsorption and covalent coupling of GA onto functionalized nanoparticles. The maximum of GA deposited at the MNP surface was obtained for MNP_GAEDC (2,80 ± 0,00 g GA/ g MNP), followed by the maximum obtained for the MNP_GAADS (1,09 ± 0,42 g GA/ g MNP). The lowest value was observed for the MNP_GAAPTS.
The modified nanoparticles presented mean average sizes in the range of 11-14 nm, very similar to the values for bare magnetite (MNP)(11 ± 3 nm) and GA-co-precipitated nanoparticles (MNP_GA)(14 ± 4 nm) in Chapter 2. Agglomerates of nanoparticles were identified in all samples studied in TEM and DLS analysis; the agglomerate diameters determined were in the range of 950-2818 nm for the TEM analysis and 1120-1500 nm in the DLS measurements, the discrepancy of values was accounted for the difference of analytical method. Nanoparticle agglomerate diameters determined by TEM and DLS were very similar to the values for MNP (2652 and 1476,67 ± 135,77 nm) and MNP_GA (950 and 341,33 ± 69,06 nm) (Chapter 2).
The lower zeta potential values obtained for GA treated nanoparticles further corroborated the increase in nanoparticle dispersivity due to GA coating. Values from -22,07 to -26,63 mV were obtained for GA treated nanoparticles comparing to the -19,63 mV obtained for MNP.
48
Chapter 4 – Studies on the Influence of Magnetic
Particles on the Growth of Mammalian Cell Lines and
Cellular Viability
4.1. Introduction
An important step during the development of nanoparticles that may be used for biomedical applications is to test them for biocompatibility. One possible experimental strategy is to grow mammalian cell lines in the presence of MNPs and to determine the effects that the particles may have on the cellular growth and viability. The observed effects will dictate the fate of the synthesized and surface modified nanoparticles. In case of toxic effects, the biocompatibility of the MNPs can be improved by different surface modifications. Several groups have performed cell interaction studies with nanoparticles [16, 25, 52, 56, 86, 87, 89, 90]. Recently, Wilson et al. (2008) [59], synthesized magnetite MNPs in the presence of oleylamine (OLA) or Gum Arabic (GA) and used the particles to study the effect of these surface modifications on the dispersivity of the MNPs and on the cellular level of bioactivity of L929 fibroblasts (indicated by the level of cytotoxicity). OLA modified MNPs displayed the highest level of cytotoxicity with approximately 27% of L929 fibroblast cells dead after an exposure period of 24 hours to OLA, while untreated magnetite, GA treated and cells grown in the absence of MNPs displayed only a 10% decrease in cellular density. These authors reported that untreated and OLA treated MNPs were observed in the cell cytoplasm while GA-modified MNP clusters were located at the cell membrane. They related these results to the observations that the bare magnetite and OLA modified nanoparticles exhibited the highest dispersivity values and that the MNPs with GA adsorbed onto the MNP surface formed large particle agglomerates during synthesis. Accordingly, they suggested that GA may prove useful as a coating material for the preparation of biocompatible MNPs.
In this work, bare magnetite MNPs, and particles functionalized with GA (MNP_GAADS, MNP_GA_GAADS, MNP_GAAPTS and MNP_GAEDC) were used for in
49 grown in the absence of MNPs. The tests were performed on different cell lines, namely HEK293 (Human Embryonic Kidney cells), TE671 (Human Caucasian Medulloblastoma) and CHO (Hamster Chinese Ovary). These assays were performed to investigate for possible common effects of the particles on cells from different origins and characteristics. HEK293 cells were the most sensitive to the presence of MNPs and were used to follow the development of the toxic effects over time. Additionally, GA coated MNPs were functionalized with the fluorophore Fluorescein isothiocyanate (FITC) and these particles were tested in the cell cultures as an attempt to determine if the particles may be internalized by the cells.
4.2. Materials
and
Methods
4.2.1. Materials
Gum Arabic was purchased from Sigma-Aldrich.
Trypan blue Standard stain ((3Z)-5-amino-3-[[4-[4-[(2Z)-2-(8-amino-1-oxo-3,6-
disulfonaphthalen-2-ylidene)hydrazinyl]-3-methylphenyl]-2-methylphenyl]hydrazinylidene]-4-oxonaphthalene-2,7-disulfonic acid) (2704540) was purchased from The British Drug Houses LTD (BDH) Laboratory Chemicals division. N’, N’’ – dimethylformamide (DMF)≥99,8% A.C.S Reagent 319937-1L Sigma-Aldrich Ethanol Absolute PA was purchased from Panreac.
Dulbecco´s Modified Eagle Medium, Ham's F12 Medium, Foetal bovine serum, Penicillin, Streptomycin and Fungizone were purchased from Gibco.
Fluorescein isothiocyanate, Isomer I (FITC) (F7250) and Di-methil-sulfoxide (DMSO) were purchased from Sigma.
4.2.2. Equipment
Solid reagents were weighed in an Analytical Balance Sartorius BL6100.
50 Fluorescence assays were performed under an Olympus Bx51 microscope (400x amplification), with Olympus Fluorescence Filters U-MWB2 and U-MWG2, an Olympus U-RFL-T lamp, an objective Uplan FL N, 40x, PH1 and PH2 and a Cell F-View Image System Software for monitoring. Photographs were taken of 6 to 10 random fields of each sample.
The Fluorescence Filter U-MWB2 (λexc = 460-490 nm, λem = 520 nm IF) was used to observe the emitted fluorescence from FITC, the Fluorescence Filter U-MWG2 (λexc = 510-550 nm, λem = 590 nm) was used to observe the Trypan Blue dye emitted fluorescence. Optical analysis of the samples was performed in Phase contrast.
Cell culture handling operations were performed in sterility inside a Sanyo laminar flow chamber.
Cell cultures were grown in a Nuare-IR CO2 and Temperature controlled incubator.
4.2.3. Methods
The nanoparticles used for the in vitro assays were synthesized and further coated with GA (Chapters 2 and 3). The cell cultures were grown in the presence of bare magnetite MNPs (MNP) and GA-functionalized MNPs (MNP_GAADS, MNP_GA_GAADS, MNP_GAAPTS and MNP_GAEDC). Cellular viability was accessed by the Trypan Blue exclusion test and by comparing the cellular density of the cultures with those grown in the absence of MNPs (control).
4.2.3.1. Functionalization of GA with FITC
Two different approaches for the FITC labeling of MNPs were tested: (A) FITC functionalization of Gum Arabic before MNP coating and (B) Gum Arabic functionalization with FITC at the surface of MNPs.
51 MNPs were coated with Gum Arabic-FITC following the adsorption and covalent coupling protocols used in Chapter 3.
(B) Solutions of MNPs synthesized using Massart’s Method and coated with Gum Arabic containing FITC as a fluorescent marker were prepared in Phosphate buffer saline. An aliquot of the master solution prepared in (A) (100 µl) was added dropwise to the MNPs-PBS solutions, which were then incubated for 1 hour with stirring on a gyratory shaker.
The exposition time for the photographs taken of cells in the presence of FITC was of 140 milliseconds which was the minimum time needed to observe fluorescence of the tagged particles.
4.2.3.2. Protocol for the establishment and maintenance of Cell lines
52 Sub-culture was performed by trypsinization when cellular growth reached approximately 70% confluence. All solutions were warmed in a water-bath at 37ºC before use. The old medium was removed from each culture flask and the cells were washed with PBS (5 ml, phosphate buffered saline: 8g NaCl, 0.2g KCl, 1.44g Na2HPO4, 0.24g KH2PO4 per liter, pH 7.4, autoclaved) in order to remove the remaining serum, an inhibitor of trypsin. PBS was discarded and trypsin was added to the cell cultures (8 drops, 0.05% in EDTA.4Na) to digest the extracellular matrix. The trypsinization reaction was stopped by the addition of culture medium (3 ml) to the cells, which were further ressuspended with a Pasteur pipette. The cellular suspensions were used to propagate the cultures in new flasks with fresh culture medium.
All operations with the cells were performed under sterility conditions inside a laminar flow chamber. All materials that were in contact with cells were autoclaved before being disposed of.
4.2.3.3. in vitro studies of Mammalian Cell lines grown in the presence of MNPs
To prevent contamination of the cell cultures, the magnetic nanoparticles were washed 3 times with autoclaved PBS buffer supplemented with penicillin (50 I.U/ml), streptomycin (50 U.G/ml) and fungizone (2,5 µg/ml). Solutions of coated and uncoated MNPs in PBS buffer (1mg/ml) were stored at 4ºC until further use. MNP samples used for these assays were bare magnetite MNPs (MNP), GA adsorbed (MNP_GAADS and MNP_GA_GAADS), and GA covalently coupled MNPs (MNP_GAAPTS and MNP_GAEDC). The cells for the in vitro essays with the MNPs were grown onto 13 mm diameter coverslips placed inside 35 mm diameter culture dishes.
53 4.2.3.4. Cell Viability Trypan Blue exclusion Test
Trypan Blue is a dye that only penetrates the cell membrane when cells are not viable, momentarily or definitely [103, 104]. Although this test is usually performed under normal optical microscopy, it was observed by our group that Trypan Blue has a λexc at 500 nm and a maximum of λem at 650nm (red) allowing for a better discrimination between viable and unviable cells when using the green filter U-MWG2. The Trypan blue test was performed in HEK293 cells and HEK293 cells incubated with MNPs or GA, to assess cell viability during the in vitro assays.
A coverslip with attached cells was placed in a Petri dish containing Trypan blue solution (0,0072 g Trypan Blue, 10 ml PBS buffer) for 10 minutes. Afterwards, the coverslips were washed with PBS buffer to remove excess of dye and observed under phase contrast and using the green filter U-MWG2. The exposition time chosen for the photographs taken of cells was 310 ms, which was the average exposure time set automatically by the microscope for the Trypan blue solution.
4.3. Results and Discussion
4.3.1. Assays of MNPs with different cell lines (HEK293, CHO and TE671)
In order to determine if MNPs may interact differently with cells of different proveniences, three cell lines were used for these studies. The cell lines were incubated with the nanoparticles for 24 or 30 hours and the individual samples were observed under phase contrast optical microscopy. Several MNP concentrations were tested and a 1mg/ml nanoparticle concentration was chosen as allowing for a better observation of the effects of MNP interaction with cells. Each assay was performed independently on different days and the observations from each assay were made on at least 6 random fields per sample. The results presented here are a qualitative measure of the observed effects at 24 and 30 hours and the most representative photos of each sample are presented in Figure 4-1.
54 nanoparticles deposited to the surface of the cells (P) and the absence or presence of cellular debris (D), an additional indication of cellular damage.
Figure 4-1 Phase contrast photographs of mammalian cell lines grown in the absence or in
the presence of different MNPs. The incubation times were 24 and 30 hours (n = 5, bar

![Table 1-2 Different compounds which can be used for nanoparticle coating (adapted from [7])](https://thumb-eu.123doks.com/thumbv2/123dok_br/16475283.731995/14.892.224.671.316.700/table-different-compounds-used-nanoparticle-coating-adapted.webp)
![Figure 1-1 Proposed structure for GA (after Islam et al [73]).](https://thumb-eu.123doks.com/thumbv2/123dok_br/16475283.731995/15.892.274.618.310.463/figure-proposed-structure-for-ga-after-islam-et.webp)