How to cite this article: REGINATO, V. S. and JULIÃO, R. P. Geographic Modelling of Wind and Solar Energy Potential. Bulletin of Geodetic Sciences, 25(3): e2019019, 2019.
ORIGINAL ARTICLE
GEOGRAPHIC MODELLING OF WIND AND SOLAR ENERGY POTENTIAL
Vivian da Silva Celestino Reginato1 - ORCID: 0000-0003-3543-7977 Rui Pedro Julião2 - ORCID: 0000-0002-5625-9965
1 Universidade Federal de Santa Catarina, Centro Tecnológico, Departamento de Engenharia Civil, Florianópolis, Santa Catarina, Brasil.
E-mail: vivian.celestino@ufsc.br
2 Universidade Nova de Lisboa, Departamento de Geografia e Planeamento Regional Faculdade de Ciências Sociais e Humanas, Lisboa, Portugal.
E-mail: rpj@fcsh.unl.pt
Received in 18th February 2019
Accepted in 21th May 2019
Abstract:
Reducing ‘Greenhouse Gas’ emissions, particularly of CO2, is a global commitment which has gained predominance with the emergence of sources that generate renewable energy as an alternative to traditional energy produced through fossil fuels. Renewable or ‘soft’ forms of energy are all those which use the elements of nature – for example, the wind and the sun - to generate energy without damaging the environment. ‘Geographic Modelling’ is an essential tool to better determine regions that have economically feasible energy potential, based on natural alternative sources. Therefore, the objective of this study was to identify energy potential based on wind and solar renewable sources. To achieve such goal, conceptual models of spatial analysis were designed and developed, in accordance with the norms established by the 'Object Modelling Technique' and by the operational models provided by 'ModelBuilder'. A test was applied in the south-central region of 'Continental Portugal'. The results showed average potential to generate wind energy and high potential to produce solar energy in the region.
Keywords: Renewable or 'soft' energy; Solar Energy; Wind Energy; Geographic Information System (GIS); Geographic Modelling
1. Introduction
Demand for renewable energy sources has been stepped up to meet the growing global demand for sustainably produced electricity, as fossil fuels (oil, gas and coal) are responsible for two-thirds of global greenhouse gas emissions (GHG), which can lead to sudden and irreversible changes in the planet's climate (Eloy, 2009 and ONUDI, 2013). The Intergovernmental Panel on Climate Change (IPCC) has concluded that some changes could be sudden and irreversible. Sea level rise and extensive loss of biodiversity are only two of a range of possible consequences. Not to mention the expectation that, by the end of the 21st century, temperatures will have risen to an average of 20 Celsius if emergency measures are not taken to reduce GHG emissions.
Renewable or soft energies are all those that use the forces of nature to generate energy without attacking the environment, e.g., biomass production units, geothermal energy, wind speed and constancy, solar gradients or small hydroelectric plants. All sources, regardless of their origin, have problems and their scope and dimension should be analyzed, since any energetic or industrial development should be the subject of a study to evaluate their social and environmental impact, taking into account not only the economic logic, but mainly the environmentally sustainable one (Eloy, 2009).
Soft energies, however, according to Lovins (1997), are those originated in nature, such as solar, wind, ocean or geothermal energy, used locally and in hybrid form to avoid energy costs and transport expenses.
The "gentle energy path" presupposes that energy is only a means for social ends and is not an end in itself. Soft energy paths involve efficient energy use, diversity of energy production methods (combined in scale and quality for end uses), and special dependence on cogeneration and "soft energy technologies" such as solar energy, wind energy, biofuels, geothermal energy , the energy of the waves, the energy of the tides, etc. (Lovins, 1997).
According to the author, soft energy technologies have five defining characteristics: they depend on renewable energy resources; they are diverse and designed for maximum effectiveness in certain circumstances; they are flexible and relatively simple to understand; they correspond to the end-use needs in terms of scale; and they correspond to end-use needs in terms of quality. In this sense, energy efficiency, development of renewable energies and waste valorization, together with territorial management, are elements of a strategy to reduce global warming. However, when it comes to making assertive decisions about areas and spaces for implementation of projects to produce alternative sources of energy, the variables taken into account need to be pertinent to economic, environmental, social and financial issues, and linked to data and spatially distributed information on Earth. Solar energy is one of the best renewable energy sources, with the least negative impact on the environment, according to Solangi et al (2011). Therefore, using mapping techniques to assess solar and wind energy potential is a valuable analytical tool for quantifying local capabilities for energy production, as well as designing and implementing
strategic energy planning in urban and rural areas, in line with global sustainable development goals.
Geographic Information Systems (GIS) are an efficient tool when information needs to be geographically spatialized as knowledge to enable decision-making. GIS are designed to support collection, management, analysis, modeling and visualization of georeferenced data to solve planning and management problems (Mendes, 2013) required for implementing alternative projects. Associating qualitative and quantitative variables while using GIS ensures high-quality results and reduces time and associated costs.
For example, Farina (2009) investigated the potential of renewable energy sources to generate added value to local activities and help reduce environmental impact. The result was the design of a GIS product that shows the energy potential of the coastal plain of Rio Grande do Sul State - Brazil. In her method, however, the author did not pinpoint the areas that are more or less likely to receive an engineering project for electrical production. Despite the use of GIS tools to generate results that help decision-making to introduce wind farms in Turkey, such as wind potential maps, Aydin et al (2010) did not present any results for geographic modeling.
Therefore, this paper focuses on geographic modeling for definition of methodological fluxes, but it does not address the implementation of database structures. Much of the available literature has placed great emphasis on the process of logical implementation (almost always relational) to the detriment of the basis for modeling, which is the conceptual process of reality abstraction (Cougo, 1997).
The main objective of this work is to present a method developed in a GIS to identify the most appropriate places to implement renewable energy generation projects (wind and solar energy); in particular, to define cartographic and meteorological products to extract information to identify potential generators; to produce a conceptual model using the Object Modeling Technique for Geographic Applications (OMT-G); to produce a logical/physical model in ModelBuilder (ESRI ArcGIS technology); and to apply the produced models in the field of study.
2. Theoretical Background
This section presents definitions for renewable sources, GIS and other relevant concepts for the issue addressed in this paper.
Renewable energies are those that use the elements of nature to generate energy without damaging the environment; however, they also cause problems whose scope must be analyzed because any energy or industrial development should be the subject of a study for assessment of social and environmental impact.
Primary sources of energy are quantities of energy stored in chemical (fossil fuels) or thermal form (geothermal); and large streams of solar radiation with continuous transfer of energy to the atmosphere, hydrosphere and biosphere, and, thus, responsible for wind, water and life cycles and the resulting renewable energies. Renewable energy sources are small or medium-sized units of energy production from biomass (forest or agricultural residues), geothermal (use of the
differential heat of land or water), wind speed and constancy or solar gradients. Soft energies, however, are those originated in nature, such as solar, wind, ocean or geothermal ones, used locally and in a hybrid way to avoid energy costs. (Eloy, 2009).
According to Lovins (1997), in the “soft energy path”, it is assumed that energy is only a means to social ends but not an end in itself.
The "soft energy path" assumes that energy is but a means to social ends, and is not an end in itself. Soft energy paths involve efficient use of energy, diversity of energy production methods (matched in scale and quality to end uses), and special reliance on co-generation and "soft energy technologies" such as solar energy, wind energy, biofuels, geothermal energy, wave power, tidal power, etc. (Lovins, 1997).
Hydropower is the main ally in clean, autochthonous and inexhaustible generation; it is one of the main sources of electricity (ONUDI, 2013), but the size of dams poses a great a risk. The environmental reports of the World Bank, since 1997, have claimed that large dams are economically and environmentally wasteful. Small dams, on the other hand, are considered to be not only an environmental benefit, but also a renewable source of energy, provided that they are properly managed.
Wind energy is considered to be a renewable, widely available, clean source with low environmental impact, mainly because it does not produce residues such as carbon dioxide. Wind energy is basically the one obtained from kinetic energy (resulting from motion), generated by migration of air masses caused by temperature differences on the surface of the planet. Wind generation occurs through contact of the wind with windrow blades, which are full components of the plant. When rotating, these blades give rise to the mechanical energy that drives the rotor of the aerogenerator and produces electricity (ANEEL, 2008).
According to a study by the Global Wind Energy Council (GWEC), in the last 16 years, global installed wind power capacity has increased from 6.1 Giga Watt (GW) to 282.4 GW. In 2012 alone, the number of wind power plants on the planet grew by 19%. The countries that make the most of this energy are Germany, United States, Spain, India, China, Denmark, Italy, France, United Kingdom and Portugal (Amarante et al, 2009). In 2009, wind energy had the highest growth potential in the world and was considered fundamental for setting targets in Portugal, where installed energy capacity was 1700 MW in December 2006 and had already risen to 4730 MW by 2013. Usually, uplands are the windiest the and largest areas without barriers. With the currently available technology, installation of a turbine is a good choice when the site is subject only to persistent and regular winds with average daily speed over 3.6 m/s, and with low turbulence intensity values (Eloy, 2009).
The evolution of technology has allowed the development of more powerful equipment. However, air density, intensity, direction, and wind speed are related to natural geographic features such as relief, vegetation, and thermal interactions between the earth's surface and the atmosphere. Wind energy requires the existence of specific and favorable natural conditions and the evaluation of these conditions (or the wind power potential of a given region) requires systematic data collection and analysis on wind speed and regime (ANEEL, 2008).
Aydin et al (2010) conducted research on wind energy to create a decision support system for selection of wind turbine sites using GIS tools in a region of Turkey. The results indicated that wind energy potential is a determining factor for selection of wind turbine sites, because environmental feasibility alone is not sufficient to identify priorities when choosing sites for wind energy generation. In the author’s words:
Wind energy potential and environmental fitness/acceptability are used as decision criteria for the site selection process. Winds occur as a result of unequal distribution of solar heating around the world. The speed and the direction of wind can be various according to the characteristics of topography (Aydin et al, 2010).
Solar energy is an increasingly great energy solution for the planet. It is an inexhaustible, free and non-polluting source (Eloy, 2009), because the sun is a huge nuclear fusion reactor formed by a sphere of gaseous matter which is the main source energy of Earth, located at an average distance of 149,610,80 km (ONUDI, 2013). According to the Renewable Energy Policy Network for the 21st Century (REN21), grid-connected photovoltaic systems were the world's fastest growing generation technology in 2006 and 2007 (ANEEL, 2008).
It reaches Earth in thermal and luminous forms. This radiation, however, does not uniformly affect the entire Earth's crust; it depends on latitude, season, and atmospheric conditions such as cloudiness and relative humidity. As it passes through the Earth's atmosphere, radiation manifests itself in the form of visible light, infrared and ultraviolet rays. This light can be captured and turned into heat. If a dark surface is used for capture, solar energy will be transformed into heat, and if photovoltaic cells are used, the result will be electricity (ANEEL, 2008).
The growth rate of installed photovoltaic power in recent years has exceeded all forecasts, thereby showing the potential of this technology as a source of energy worldwide.
Importantly, most of the installed capacity corresponds to grid-connected installations, accounting for 98% of the global capacity, although there is a recent interest in isolated installations and small scale systems mainly in developing, remote, difficult to access areas (ONUDI, 2013).
A photovoltaic system does not need the sun's brightness to operate. It can also generate electricity on cloudy days.
Solar energy is an inexhaustible, free and non-polluting source depending on latitude, season and atmospheric conditions such as cloudiness and relative humidity. It is the equipment used in this capture that determines what type of energy is to be obtained (solar thermal or photovoltaic) (Eloy, 2009).
According to Santos et al (2014), incident solar radiation can be measured by ground-based meteorological stations or meteorological satellites and/or be estimated through models. There are several solar models available in the literature. They vary in the detail of input parameters and, consequently, in the output map. Solar Analyst (Fu and Rich, 1999) and Photovoltaic Geographical Information System (PVGIS) (Šúri et al, 2005) are two examples of solar radiation models. Solar technology in Portugal is already being encouraged through the implementation of European Union Directives. This new awareness, associated with the fact that Portugal is one of the European countries with the highest levels of annual solar irradiation (Šúri et al, 2007) increases the interest in quantification of energy-based indicators.
According to Longley et al (2001), modeling is the process of generating additional elements from existing data sets. It can encompass several universes, such as conceptual, physical and logical.
Geographic modeling has gained relevance in recent years, as a result of methodological and technological developments. On the one hand, Geography, Cartography and other Earth-related sciences have developed analytical tools and, on the other hand, hardware and software components have also evolved substantially. Simultaneously, the existence of several production projects and data availability has complemented the offer and provided support to implementation and testing of the models (Julião and Celestino, 2016).
Several studies have been carried out to include geographic modeling in planning activities and multi-purpose decisions, not only those involving database structures, in order to clarify decision processes that involve various projects and problems that require a solution. This thought corroborates the one of Cougo (1997):
Data modeling has long been a subject most often associated with database design activity. Most of the bibliographical references demonstrate this. However, in order to really achieve the level of understanding and assimilation required, one must seek to unlink these two areas. It should be understood that “Data modeling is not a tool for database design alone!” Data modeling applies to other purposes as well. It can be an extremely useful tool for the O & M area for reengineering, definition of business rules, etc. (Cougo, 1997).
Conceptual modeling of geographic data is a representation and simplified organization of geographic reality elements involving content description, structure and operations. A conceptual schema can describe graphical and semantic data (Hübner, 2009). According to Lisboa Filho et al. (2000), among the best-known conceptual models for geographic data are those of Object-Oriented (OO) formalism. OMT-G is a modeling technique for OO formalism (Craveiro, 2004) that adds primitives to the Unified Modeling Language (UML) class diagram to model the geometry and topology of spatial data, offering aggregation, specialization/generalization, network, and spatial associations. It is based on three main concepts: classes, relationships and spatial integrity constraints (Borges and Davis, 2001). Classes can be conventional or georeferenced and they may have subclasses and semiology that identify them and represent data sets, which can be continuous, discrete and non-spatial.
Logical design implies the transformation of the conceptual schema into a data schema compatible with the type of model in use. In this phase, abstraction concepts are mapped for use in the conceptual scheme into data representation elements of the model of choice (Lisboa Filho and Iochpe, 2001) and (Lago, 2006).
In physical design, operational aspects of implementation (data types, file storage structures, access paths, partitioning, grouping, etc.) are defined, based on the model to be used, allowing the designer to plan efficiency-related aspects (Lisboa Filho and Iochpe, 2001).
ArcGIS users have the option of developing the entire logical/physical design within ModelBuilder, which is a visual programming tool for design of geoprocessing workflows. According to Silva (2015), ModelBuilder works as an ArcGIS software component which allows the creation of flow models that join a sequence of tools necessarily present in the ArcToolbox and database, and allows you to create both workflows and new tools.
ModelBuilder is an instrument that, much more than allowing the design of the model, tests, validates and allows the operationalization of the procedure, and it can be considered a graphic programming tool that brings together Geoprocessing functions and enables the design of models (processes) that can be used on multiple occasions (Cosme, 2012).
Wind modeling is a statistical procedure performed to ensure that wind analyses contain the lowest possible uncertainty level for identification of wind resources in each region. One of the most important parameters to correctly estimate the wind regime of a given region is the local topographic map, because it directly affects wind flow modeling on a wind farm. According to Pereira (2016), complex lands are highly critical areas, since any error in the modeling of contour lines can lead to great errors in energy estimation:
Computational modeling is a very important tool for evaluation of the energy potential of certain regions. To obtain the highest level of reliability possible in the estimation of wind resources in the position of wind turbines on a given wind farm, a measurement tower would have to be installed in each wind turbine position to measure wind conditions at each point of interest. At the pre-design
stage, however, it becomes economically and physically unfeasible to install so many measurement towers in the same area. Thus, computational models are used to predict wind speed in several points, based on the speed measured in a single nearby point (Pereira, 2016).
For a good precision study, microscale software is used to simulate wind distributions caused by orography, roughness and obstacles present on the maps, determining what wind behavior would be like above the atmospheric boundary layer; according to Pereira (2016), this is called geostrophic wind.
The computational model horizontally extrapolates the geostrophic wind without considering external interferences in its profile. Modeling is concluded by including topographic effects, roughness effects and effects created by obstacles for each position of interest of the study regions, individually (Pereira, 2016).
During modeling, wind turbulence intensity, which is defined in a flow as the ratio of the standard deviation of wind speed and the average speed of the free current in the same direction that is usually considered, defined in averages of 10 minutes or 1 hour (Custódio, 2013). Thus, according to Pereira (2016), turbulence intensity can be considered as a fluctuation of wind speed on a certain time scale.
Turbulence is generated mainly by friction with the earth's surface and by thermal effects that can cause vertical movements of air masses resulting from temperature differences, causing a movement of convective cells that provoke, in turn, vortexes of turbulence. Turbulence intensity tends to decrease with increasing height (Jervel, 2008).
The software Windographer® is a computational tool used for wind modeling, that is, it performs the treatment of data collected from surface meteorological stations and calculates intensity and predominant direction of winds in a given period, providing daily, monthly or annual profiles of data sequences. The software can display various graphs and tables such as log wind profile, direction, monthly and daily averages. It was developed by Mistaya Engenharia INC and a valid trial version is available for free for a period between 7 and 14 days, depending on the version (Linard, 2010).
With the Windographer®, wind speeds can be simulated at various heights from a data package measured at a single height. The logarithmic profile of the wind can be calculated by reporting the roughness parameter and using the formula of the power law informing the exponent of the power law (Linard, 2010).
The most common simulation is that of wind speed synthesized at the height of anemometric towers (80 m, 100 m or 150 m). Thus, for this calculation, input is needed in the form of data collected at various wind speeds and wind direction heights, combined with the other data series that are requested by the software; for example, latitude, longitude, elevation, start date, end
date, duration, time interval, calm threshold, temperature, pressure, relative humidity, wind speed and wind direction at different heights, vertical speed, roughness, among others. The software returns results in the form of graphs or tables, as explained in Table 1.
Table 1: Results Generated by Windographer Chart or Table Description
Wind Vertical Profile
It presents the average wind speed at various heights, as well as the profile with the logarithmic function that best fits the power law.
Wind roses They show how often the wind blows in each direction. Monthly Wind Speed
Profile
It displays the average wind speed in each month of the year for various heights. In data sets spanning several years, monthly averages include values for all years.
Daytime Wind Speed Profile
It displays the average wind speed for each hour of the day at various heights.
Source: AWS Truepower LLC (2015).
As wind models are performed individually for each station, coverage of an area with several stations requires automatic interpolations to check the average simulated wind speed.
The interpolation technique of the Top to Raster function was designed with the specific objective of converting vector data into exact hydrological models of terrain elevation. The method uses the computational efficiency of local interpolation, such as Inverse Distance Weighting (IDW), without losing the superficial continuity of global interpolation methods, such as Krigagem and Spline (Nogueira and Amaral, 2009).
interpolation methodologies (IDW, Kriging, Tension Spline and Top to Raster) for generation of rainfall spatial distribution maps. The authors concluded that, for the data in use, Top to Raster was the interpolation technique that presented the best results since it provided the most adequate isolines and most points were interpolated within the isolines whose values had been previously established; in addition, it showed smoother isolines and better match of the altimetric characteristics of the region. Celestino (2014) described different interpolators for various purposes, as well as the choice of the Top to Raster technique to perform interpolations of contours at different levels to generate digital elevation models to the detriment of other interpolators.
3. Method
To develop the proposed method, first a search was performed in the existing databases, taking into account the needs of Portugal, in order to identify the minimum information required to implement the model, that is, to identify the cartographic and meteorological products that were
fundamental to analysis, as well as check if they were free and digital available. Thus, the following decisions were made: the generating potential was going to be explored from renewable energies that could be exploited both in urban areas and in rural areas in some continental extension area; limitations inherent in the geography of the place and the available natural resources were going to be taken into account; different energy skills or potentials - that did not require large energy transport logistics - should be identified in the same geographic region, either through road infrastructure or transmission lines; sources of energy that did not require large territorial extensions for implementation should be tested.
In this sense, a priori, the investigation of potential through sources of renewable energy (through marine currents, geothermal energy, hydropower and biomass) was discarded. First, marine currents were discarded because they are located in the oceans and other types of databases are needed to allow the identification of a hybrid potential. Geothermal energy was discarded because its potential is already consolidated exploration only in the Azores and Madeira Islands but not in the mainland Portugal region. Despite the potential to be explored in Portugal, hydroelectric power was discarded because large flooding areas are needed for implementation, hence it cannot be explored in urban areas. Biomass energy was also discarded because a great deal of information is required for implementation, e.g., about agriculture and its land potential, as well information about discarding and disposal of urban waste.
Second, it was found that in order to identify the potential of the remaining renewable energy sources, either solar or wind, information would be required on land use and occupation and altimetry of the region. Land use needs to be identified to define the constraints that must be taken into account in energy potential mapping. This information can be derived from satellite imagery or aerial photogrammetry or from thematic cartographic bases. Altimetry data, which can be extracted from DEM, are necessary to produce information about slope and aspect.
Meteorological and climatic data coming from meteorological stations are also essential; through isarithmic methods, they generate information for wind potential mapping, e.g., wind speed or intensity at three different heights, synthesized by specific software to simulate the final boundary layer to determine wind potential at the time of the future wind turbine; wind direction, collected at three different heights, for generation of the wind rose and the predominant wind direction; vertical wind speed; relative humidity; atmospheric pressure; and temperature. For installation of wind farms, roughness of the territory, as well as slopes above 10% should also be considered as a restriction. For installation of solar developments, whether thermal or photovoltaic, the faces of terrain that are not exposed to sun rays (incidence depending on the region), as well as physical impediments such as buildings, which prevent the reception of light, should be taken into account as restrictions. Based on this identification, the study area could be delimited.
The defined study area (see Figure 1) covers the Alentejo and Algarve, especially, with a surface of 26092.78 Km2, approximately 30% of the total area of Continental Portugal, which is located in southwestern Europe, in the temperate zone between latitudes 32° and 42° North; the climate is Mediterranean, according to the Köppen-Geiger climate classification. Portugal has one of the mildest climate in Continental Europe, with average annual temperature ranging from 4° C in the hinterland north to 18° C in the south, in the Guadiana basin. In the southern part, the summer is warm and longer, with 5 to 6 dry months and a mild and little rainy winter with less precipitation. Average total annual precipitation in Alentejo and Algarve is around 600 mm.
Normally, spring and summer months are sunny and temperatures are high. The months of July and August are dry and temperatures exceed 40° C, on extreme days, particularly, in the
countryside of Alentejo. The country has around 3,000 hours of sunshine a year, with averages ranging between 4 and 6 hours of sunshine in the winter and between 10 and 12 hours of sunshine in the summer, with higher values in the southeast and lower values in the northwest of the mainland. The vegetation to the south of the river Tejo is predominantly Mediterranean, with arboreal species such as holm oak, cork oak, olive tree and carob tree.
Portugal is a country with huge opportunities for renewable energies. It has abundance of sun, wind, water from the rivers and the sea, biomass and even geothermic energy. However, the ambitious target for the country for electricity, which was to reach up to 39% of generation from renewable energy sources by 2010, was not met. This is due to the fact that Portugal has external dependence, in terms of primary energy, which is clearly higher than the average of the European Union and comparable countries. In addition, it is very exposed to the internalization of the environmental costs of CO2 emissions, in that it exceeds the emission limits allocated to it. See details in Eloy (2009).
With 2300 to 3000 hours of sun per year, Portugal is in a privileged position for use of solar energy. The potential of solar energy and biomass energy is considerable, particularly as a result of the conversion of organic waste as well as of wind resources, whose use is already significant. The extensive coastline could be a major source of energy as long as the technologies for converting the so-called ocean energies are expected to develop. To these renewable sources, there is also the need to add water, which has long been a major part of electricity production (Eloy, 2009).
Taking these factors in consideration, the following software and cartographic and meteorological products were used:
• Shuttle Radar Topography Mission (SRTM) DEM with 90 m pixel;
• LandSat 8 images from the United States Geological Survey (USGS) with 30 m pixel; • Carta de Uso e Ocupação do Solo de Portugal Continental para 2007 (Land Use and Land Cover Map of Continental Portugal for 2007/COS2007) of the Instituto Geográfico Português (Portuguese Geographic Institute/IGP) compatible with the 1: 50000 scale;
• Meteorological Stations of the Sistema Nacional de Informação de Recursos Hídricos (National Water Resources Information System/SNIRH) of Portugal. See Figure 2 for distribution of meteorological stations;
• Microsoft Visio 2010 OMT-G Stencil with parameters and stereotypes of OMT-G; • Software Windographer;
• ModelBuilder tool of ESRI ArcGIS 10.2; • Software ESRI ArcGIS 10.2.
Figure 1: Study Area.
The production of the conceptual model consisted of a drawing of the class diagram that described and fixed the rules for the constructed structure, through behavior analysis of the attributes of the geographical and conventional variables of the real world and their representation in the form of classes of objects and their respective relationships. Domains were assigned to data types according to their storage characteristics in the computational environment, and spatial and non-spatial relationships were established between the classes of objects, taking into account the different concepts used by the OMT-G model. After the definition of the fundamental primary classes, the secondary classes were derived from the superposition, aggregation or insertion of primary classes and subclasses and other information, as well as operations and functions. This structure was used to determine the flow to be followed to map areas with potential for energy generation, that is, flows were defined for the different study sources, with classes and relationships, which resulted, through operations, in classes indicative of the potential isolated by source, whether wind or solar. In practice, the design of the conceptual model began by identifying the geographic and conventional objects of the theme and grouping them into classes, according to the bases defined. The classes of geographical phenomena received conceptual representation according to the field view with the geometric primitives of point and tessellation. After the spatial and conventional attributes of each class of objects were modeled, domains were assigned to the data types: String, Boolean, Float and Date.
The two flows conceptually modeled in the OMT-G were produced in ModelBuilder. The design of this model followed the sequence of the conceptual model. In this way, the flow for the wind potential was produced, in which wind speeds lower than 3.6 m/s were considered to be null. With the exception of semantic data on the wind source - which required previous modeling in specific wind simulation software and resulted in a geographical class of point denominated “synthesized wind speed”, used as input data in ModelBuilder - the entire design followed the model described conceptually. In the conceptual model, however, the class “synthesized wind speed” was considered as secondary because it was generated by the aggregation of the geographical class “Meteorological Station” with the conventional class “Meteorological Data”.
For identification of areas with wind potential, data from the meteorological stations (Figure 2) were used to model (simulate) the final boundary layer (aero generator altitude = 80 m). Data on average speed of each height of the meteorological station were tabulated in a MS® Excel spreadsheet and then exported to the software Windographer, which allowed extraction of the simulated wind speed at the height of 80 m. Table 2 shows the data on mean wind speed as well as simulated speed for each meteorological station. The simulation also used data on altitude at the station, planimetric coordinates, date and time of start of collection and period of data repetition (frequency). All wind speed information available for each station was used, but not necessarily the same time period was used for the whole set, which causes a great limitation to the average wind speed analysis. Table 2 shows data on mean wind speed, which does not have a directly proportional increase as the height of data collection increases in all the stations. This change in wind speeds can be attributed to different turbulence intensities. After the simulation of wind turbine height for each station, the data were exported to the software ArcGIS 10.2, in which information on the simulated wind speed was interpolated via the Top to Raster function to the other areas of coverage. The resulting rasterized model was introduced in the proposed ModelBuilder stream.
After this stage, the production of the stream was started to identify areas with solar potential. For the design of the solar energy flow, the faces were used according to the sun's path as parameters for solar capture, adopting the Analytic Hierarchy Process (AHP) method. As the
variables change according to the geographic location of the area to be studied, the orientation of the relief surface with excellent potential was defined as sunny faces, with very high potential; southeast and south-west potential with high potential; east and west with average potential; northeast and northwest with low potential, and north with zero potential (considering the geographic location of Portugal). The ArcGIS Solar Area Radiation function was used to calculate the global radiation of the study area. This function uses DEM as the input data. The following parameters were input: the year 2015; 14 h of daily radiation; frequency of 30 minutes; mean geographical latitude of 38.12° N; sky size resolution of 200; diffusion factor of 0.3; transmissivity of 0.5; and type of uniform diffusion model. The calculated global radiation returns the total value accumulated in the year, thus, the average daily value of the radiation in kwh/m2 was calculated using the raster calculator. Total mean absolute values were determined (absolute radiation). In order to better represent the reality of the solar potential, the sun faces were considered to be analyzed together with the calculated absolute global radiation values. The result of the absolute global solar potential was superimposed on the potential by aspect, which derived the relative solar potential. In order to investigate the solar potential, no other type of restriction was taken into account, assuming that solar installations can be used in urban environments (roofs), as well as in reservoirs. In ModelBuilder, all input data were considered as primary classes and the output data were considered as secondary classes and so on, depending on the stipulated relationship. With the exception of wind modeling and some tools that work outside the ArcGIS Toolbox, the operations defined in the conceptual model were implemented in ModelBuilder to validate the proposed conceptual model. The following operations were used: top to raster, clip, fill, conditional, raster calculator, reclassify, slope, aspect, buffer, polygon to raster, train maximum likelihood classifier and area solar radiation.
Table 2: Average Wind Speed for Metereological Station.
Meteorological Station Average Wind Speed (m/s)
Collection period Height 0 m Height 5 m Height 8 m Height 80 m
Albufeira do Maranhão 13/02/2005 -
25/07/2007 1,473 1,567 1,44 2,474
Albufeira de Santa Clara 15/04/2004 -
18/10/2007 1,861 1,975 1,920 2,907
Albufeira do Pego do Altar 01/09/2003 -
19/10/2007 1,194 1,132 1,302 3,105 Albufeira do Alvito 19/11/2003 - 25/09/2007 2,736 2,917 2,923 3,933 Albufeira do Roxo 26/07/2003 - 13/03/2007 1,802 1,857 1,943 4,063 Albufeira de Odeleite 04/09/2003 - 28/11/2007 2,586 2,503 2,581 4,438 Albufeira de Alqueva (Mourão) 07/04/2005 - 19/09/2007 3,000 2,990 3,163 4,543 Albufeira de Caia 10/10/2003 - 17/12/2006 2,786 2,982 3,185 5,013 Albufeira de Alqueva 13/09/2002 - 27/04/2009 2,766 2,689 2,868 5,482 Albufeira da Bravura 02/09/2003 - 30/07/2008 3,210 3,137 3,361 5,496
After being generated in Modelbuilder, the model was applied in the study area, the Central-South region of Continental Portugal. The region had all the necessary premises to apply the model, from the beginning to the end of the flow; especially, it had meteorological stations with data made available through the Internet. In the end, it was possible to identify areas with potential to generate energy from wind and solar sources. Figure 3 shows the method flowchart.
Figure 3: Method flowchart.
4. Results
Development and application of the model led to three different results: the conceptual model; the Modelbuilder application; and implementation of its application in the study area in the form of maps.
As result of the conceptual model, geographical and conventional classes were determined; the relationships between object classes, as well as “one-to-one” cardinality can be clearly seen, and secondary classes have been derived from them, also through the use of operations. Figures 4 and 5, respectively, show the conceptual model sectioned by thematic groups of energy by wind and solar generation.
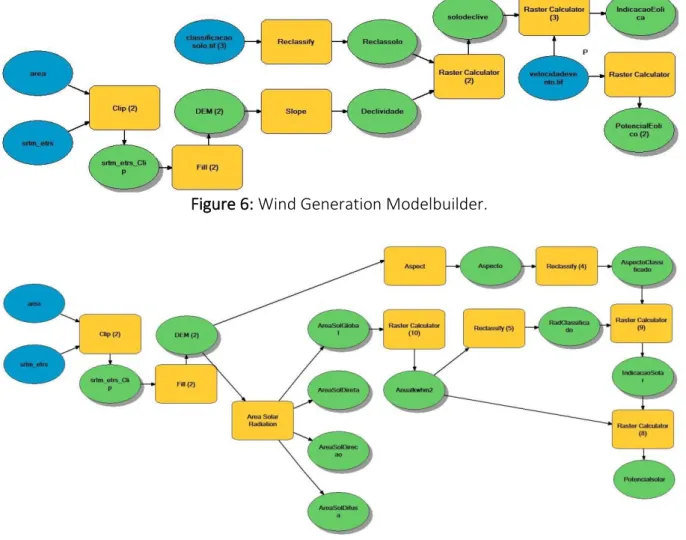
Then the flow for identification of areas with solar and wind potential was produced in ModelBuilder (Figures 6 and 7).
Figure 6: Wind Generation Modelbuilder.
Figure 7: Solar Generation Modelbuilder.
In the end, maps were produced to identify the areas with potential to generate energy through renewable wind and solar sources. Figure 8 shows the calculated potentials for wind sources, considering the average wind speed at a simulated height of 80 m. The minimum wind speed identified in the study area was 2,095 m/s in the city of Santarém and the maximum was 5.821 m/s in the City of Beja, close to the border with Spain. The regions highlighted in red, in the cities of Beja, Sagres and Portalegre correspond, in this study, to the highest wind potential, with values between 5,266 and 5,821 m/s. Figure 8 also shows that the areas in gray have a wind speed of less than 3.6 m/s or some type of restriction and are not suitable for installation of wind energy turbines (approximately 48% of the area, as shown in Table 3).
As regards solar energy, the number of geographic sun faces of the calculated study area is presented first, in order to check, a priori, the solar potential by aspect. According to the results shown in Table 4, approximately 88% of the study region has some a priori solar potential because of its position in relation to the sun, with solar potential by aspect ranging between low and excellent. The face facing north corresponds to approximately 12% of the area and has no solar potential. A priori, the flat, southwest, southeast and south sun faces, correspond to the highest assigned potentials. The Southwest orientation corresponds to almost 15% of the total area, because of the geographical location of Portugal. Based on the assigned potentials, approximately
40% of the surveyed area has medium to excellent solar potential while 48% also has potential; however, it ranges between low and medium.
Figure 8: Wind Potential.
Table 3: Simulated Wind Speed for 80 m
Wind Speed (m/s) Color Area (ha) Area (%) Betwen 2,095 and 3,600 Gray 1241915,82 47,60 Betwen 3,601 and 4,155 Green 419538,53 16,08 Betwen 4,156 and 4,710 Yellow 530937,08 20,35 Betwen 4,711 and 5,265 Orange 246596,79 9,45 Betwen 5,266 and 5,821 Red 170289,78 6,53
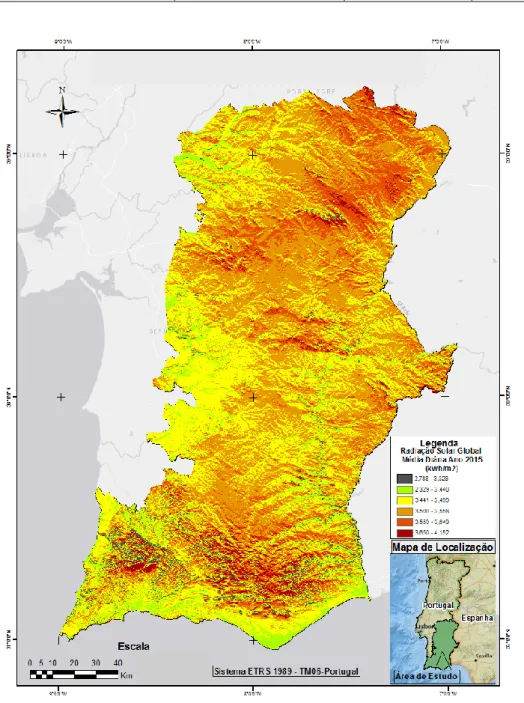
The average daily value of the radiation in kwh/m2 was derived from the calculated global calculated radiation. Absolute average global daily values of radiation were determined, for the year 2015, between 2,788 and 4,152 kwh/m2. Figure 8 and the description of the results in Table 5 show that the function used to calculate the overall radiation uses the area as a whole and does not take into account the sun faces. According to this result, the whole area has solar potential, which is not accurate. In order to better represent the reality of solar potential, the sun faces were considered to be analyzed together with the calculated absolute global radiation values in Figure 9. Figure 10 and in Table 6 show the result for the relative global solar potential, taking the aspect into account; the areas identified in gray do not have solar potential because of their aspect (north face). This corresponds to approximately 12% of the surveyed area. In the rest of the area, solar potential was identified as ranging between low and excellent throughout the region - approximately 88% of the area - with estimated radiations between 2,855 and 4,152 kwh/m2 (daily average for 2015).
Table 4: Weights by aspect of the study area - sun faces. Aspect/Sun faces Potential Area (ha) Area (%) Flat Excellent 20863,73 0,80 South Most High 355047,37 13,61 South-west High 378703,07 14,51 Southeast High 299620,10 11,48 West Medium 327511,73 12,55 East Medium 289176,23 11,08 Northeast Low 328351,72 12,58 Northwest Low 302452,06 11,59 North Null 307551,99 11,79
Table 5: Absolute global solar radiation - daily average for the year 2015. Radiation (kwh/m2) Color in map Area (ha) Area (%) Between 2,788 and 3,328 Grey 47323,38 1,81 Between 3,329 and 3,440 Green 308115,99 11,81 Between 3,441 ande 3,499 Yellow 819333,32 31,40 Between 3,500 and 3,558 Light orange 969263,37 37,15 Between 3,559 and 3,649 Dark orange 388586,94 14,89 Between 3,650 and 4,152 Red 76655,00 2,94
Table 6: Relative global solar radiation - daily average for the year 2015. Radiation (kwh/m2) Color in the map Area (ha) Area (%) No potential Gray 307551,99 11,79 Between 2,855 and 3,115 Green 1203,98 0,05 Between 3,116 and 3,374 Yellow 50335,34 1,93 Between 3,375 and 3,633 Light orange 2148652,00 82,35 Between 3,634 and 3,892 Dark orange 100394,69 3,85 Between 3,893 and 4,152 Red 1139,99 0,04
Figure 10: Relative global solar radiation - Daily average for the year 2015.
6. Conclusions, Considerations and Recommendations
In conclusion, all the objectives were acxhieve, because: the cartographic and meteorological information and products required to develop the model and the application were defined; a conceptual model was developed and established a methodological flow in order to identify areas to generate electricity through wind and solar renewable sources, regardless of implementation software; a model was implemented in ModelBuilder and resulted in the identification of possible
areas to generate electric energy through wind and solar sources, regardless of previous definition of areas; and the model in Modelbuilder was applied in a study area for validation.
The resulting maps presented satisfactory outcomes, and as regards the wind source, they were in line with the wind maps presented in the Julião, Brito and Fernandes (2005). The results for the solar source corroborated data on solar radiation coming from meteorological stations of SNIRH. The maps also pointed out the respective potentials for the matrices surveyed. Through the analysis, the potential of the region was considered as medium for wind potential and high for solar potential.
The wind potential of the region is medium, because 47% of the region does not have enough wind speed for installation of towers or has different types of restriction (urban area, slope, roughness, etc.). Sagres was identified as one of the regions with high wind potential and corresponds to the highest wind potential also found for Continental Portugal, converging with the results presented by Costa (2004), i.e., the simulated annual mean speed of 80 m for all wind directions.
There is high solar potential in the region for installation of solar equipment, since more than 88% of the region has some solar potential, especially because of the relief and the geographical situation of Portugal, as well as the large number of hours of yearly sunshine, which confirms the results reported by Eloy (2009).
The conceptual model produced can be universally applied and reapplied in any GIS software; application in Modelbuilder depends on software and system in use, and it can be implemented in other GIS programs, as long as they have analogous functions and operations; the application of Modelbuilder in different geographic regions, however, depends on different factors and requires that some assumptions be considered, e.g., use of DEM, satellite images or maps of land use and occupation in raster format, and data and information from meteorological stations. In-depth studies on wind potential should be conducted, especially on use of a greater number of meteorological stations, as well as use of historical data series for greater reliability of wind speed interpolations. The reason is that, even when a safe interpolator (such as Top to Raster) is used, some data may have been extrapolated, particularly the high values of perceived wind speed in Portalegre and Beja. In addition to a larger number of stations, another suggestion for further research is to take wind regime and wind direction into account.
For the areas with solar potential identified in this work, more in-depth studies are needed on type of equipment to be installed (thermal for heating of fluids or photovoltaic for electricity generation), as well as use of other models with higher resolutions, such as Digital Surface Model (DSM) based on laser or Unmanned Aerial Vehicle (UAV) surveys, for validation and improvement of results.
For applications of this geographic model in other regions of the globe, another recommendation is that the following premises should be taken into account a priori:
• Wind generation: there are more meteorological stations than the ones used in this work; they present a homogeneous spatial distribution, as well as sufficient attributes to simulate the height of the aero generator;
• Solar generation: possibility of use of the Digital Elevation Model (DEM) and the Digital Surface Model (DSM), configuration of parameters for the hemisphere, latitude and aspect of the region, as well as assessment of number of hours of yearly sunshine, cloudiness and rainfall.
ACKNOWLEDGEMENTS
Conselho Nacional de Desenvolvimento Científico e Tecnológico (CNPQ) of Brazil, a funding agency that offered a postdoctoral research grant from March to November 2015, for research conducted at Universidade Nova de Lisboa, in Portugal.
Centro Interdisciplinar de Ciências Sociais - Faculdade de Ciências Sociais e Humanas - Universidade Nova de Lisboa (CICS.NOVA.FCSH/UNL), UID/SOC/04647/2013, for providing financial support of FCT/MEC through national funds and, when applicable, the research was co-financed by FEDER according to the partnership agreement PT2020.
Departamento de Engenharia Civil – Centro Tenológico - Universidade Federal de Santa Catarina (UFSC).
AUTHOR CONTRIBUTION
Both authors contribute equally.
REFERENCES
Amarante, O. A. C.; Silva, F. J. L.; Andrade, P. E. P. 2009. Atlas Eólico: Espírito Santo. Agência de Serviços Públicos de Energia do Estado do Espírito Santo (ASPE): Vitória.
AWS Truepower LLC. 2015. Available at: <https://www.windographer.com>. [Accessed 10 October 2015].
Aydin, N. Y.; Kentel, E.; Duzgun, S. 2010. GIS-based environmental assessment of wind energy systems for spatial planning: A case study from Western Turkey. Renewable and Sustainable Energy Reviews. Elsevier: Amsterdã.
Borges, K.A.V and Davis, C. 2001. Modelagem de Dados Geográficos. In: Câmara, G., Davis, C. and Monteiro, A. M. V. Introdução à Ciência da Geoinformação. São José dos Campos: Instituto Nacional de Pesquisas Espaciais.
Celestino, V. S. 2014. Considerações sobre a qualidade altimétrica para projetos de usinas hidrelétricas. Tese. Universidade Federal de Santa Catarina.
Cosme, A. 2012. Projeto em Sistemas de Informação Geográfica. Lisboa: Lidel – Edições Técnicas, Lda.
Costa, P. A. S. 2004. Atlas do Potencial Eólico para Porgugal Continental. Dissertação. Universidade de Lisboa.
Cougo, P. 1997. Modelagem conceitual e projeto de banco de dados. Campus: Rio de Janeiro. Craveiro, G. K. C. 2004. Metodologia para implementação de um Sistema de Informações Geográficas para ambiente urbano. Dissertação. Universidade Federal do Rio de Janeiro.
Custódio, R. S. 2013. Energia eólica para produção de energia elétrica. 2 º ed. Synergia Editora: Rio de Janeiro.
Eloy, A. 2009. Energias Sem-fim: Contrariando as Alterações Climáticas. Lisboa: Edições Colibri. Farina, F. C. 2009. Sistema de Informação Geográfica (SIG) estratégico do potencial energético renovável da Planície Costeira Norte do RS. Tese. Universidade Federal do Rio Grande do Sul. Fu, P.; Rich, P. 1999. Design and Implementation of the Solar Analyst: An Arc View Extension for Modeling Solar Radiation at Landscape Scales. Proceedings of the Nineteenth Annual ESRI User Conference: San Diego.
Jervel, J. T. 2008. Estudo da influência das características do vento no desempenho de aerogeradores. Dissertação. Universidade do Porto.
Julião, R. P, Brito, R. S. and Fernandes, J. N. Coord. 2005. Atlas de Portugal. Lisboa: Instituto Geográfico Português.
Julião, R. P.; Celestino, V. S. Modelação Geográfica e Energias Renováveis. Aplicações para apoio à decisão na identificação de fontes alternativas. XV Coloquio Ibérico de Geografía. Universidad de Murcia-AGE-APG: Murcia.
Linard, F. J. A. 2010. Estimativas da velocidade do vento em altitude usando o Software Windographer. Monografia. Universidade Estadual do Ceará.
Lisboa Filho, J.; Iochpe, C. 2001. Modelagem de Bancos de Dados Geográficos. In: Anais do XX Congresso Brasileiro de Cartografia. Porto Alegre: Sociedade Brasileira de Cartografia.
Lisboa Filho, J., Iochpe, C., Hasenack, H.; Weber, E. J. 2000. Modelagem conceitual de banco de dados geográficos: o estudo de caso do projeto PADCT/CIAMB. In: Carvão e Meio Ambiente. Porto Alegre: Universidade Federal do Rio Grande do Sul.
Longley, P.A.; Goodchild, M, F.; Maguirre, D. J.; Rhind, D. W. 2001. Geographic information systems and science. Chichester: Wiley.
Lovins, A. B. 1977. Soft energy paths: towards a durable peace. Harmondsworth, United Kingdom: Penguin Books.
Marcuzzo, F. F. N.; Andrade, L. R.; Melo, D. C. R. 2011. Métodos de Interpolação Matemática no Mapeamento de Chuvas do Estado do Mato Grosso. Revista Brasileira de Geografia Física. UFPE: Recife.
Mendes, P. G. 2013. Desenvolvimento de uma aplicação SIG no apoio à gestão da rega: o caso de estudo do Alentejo (Portugal). Dissertação. Universidade de Lisboa.
Nogueira, J. D. L.; Amaral, R. F. A. 2009. Comparação entre os métodos de interpolação (Krigagem e Topo toRaster) na elaboração da batimetria na área da folha Touros – RN. Simpósio Brasileiro De Sensoriamento Remoto. INPE: Natal.
Organização das Nações Unidas para o Desenvolvimento Industrial (ONUDI). 2013. Energia e Mudança Climática. Observatório de Energias Renováveis para a América Latina e o Caribe: Programa de Capacitação em Energias Renováveis.
Pereira, M. V. R. 2016. Impacto da altura de aerogeradores sobre a velocidade do vento, energia, efeito de esteira e intensidade de turbulência: Estudos de caso em três projetos eólicos localizados no Brasil. Dissertação. Universidade Federal do Rio Grande do Sul. Porto Alegre.
Silva, V. C. B. 2015. Criando um ModelBuilder no ArcGIS. (online) (update February 2018). Available at: <http://www.andersonmedeiros.com/como-criar-model-builder-no-arcgis/> [Accessed 10 February 2019].
Šúri M.; Huld T. A.; Dunlop E. D. 2005. PVGIS: a web-based solar radiation database for the calculation of PV potential in Europe. International Journal of Sustainable Energy. Taylor & Francis online: United Kingdom.
Šúri M.; Huld T. A.; Dunlop E. D.; Ossenbrink H. A. 2007. Potential of solar electricity generation in the European Union member states and candidate countries. Solar Energy. Elsevier: Amsterdã.