Wind Power in Girau do Ponciano, Alagoas, Brazil
Using Anemometric Data and Microscale Modeling
Diogo Nunes da Silva Ramos
1,2, Roberto Fernando da Fonseca Lyra
2,
Rosiberto Salustiano da Silva Júnior
2, Geórgenes Hilário Cavalcante Segundo
2,
Gerson Ernesto Varela Lopes
31
Departamento de Ciência e Tecnologia Aeroespacial, Instituto de Aeronáutica e Espaço,
São José dos Campos, SP, Brazil.
2Instituto de Ciências Atmosféricas, Universidade Federal de Alagoas, Maceió, AL, Brazil.
3DEWI do Brasil Engenharia e Comércio de Energia Eólica e Solar LTDA,
São José dos Campos, SP, Brazil.
Received: April 1, 2017 – Accepted: March 24, 2018.
Abstract
The wind potential in the Agreste region of Northeastern Brazil has important features for energy exploration, but, stills unexplored. This work analyzes 3.1 yrs anemometer tower measurements in the Girau do Ponciano, Alagoas state. The observational data was recorded from October 2007 to October 2010. Three periods were defined to constrain the sea-sonal wind patterns: Annual, Dry (October-January) and Wet (May-August). Hourly and monthly series showed the av-erage wind speed was higher than 7 m s-1, reaching 8.5 m s-1during the dry season. Further, the wind direction was also
favorable with less variability, concentrated between NE and SE. During nighttime the wind speed³10 m s-1were more
frequent. The Weibull fit is more distributed (concentrated) during the dry (wet) season close to 8 m s-1(7 m s-1). The
AEP(Cf) parameter estimated by the WAsP model varied between 3 to 10 GWh (35% to 65%). Nevertheless, Girau do
Ponciano domain was positioned nearby two highways and close to an electrical substation in the Arapiraca city. Other geographic conditions (topography inclination < 15°, the absence of obstacles, and low vegetation) are also favorable to future wind farm installation in this area.
Keywords:wind, wind potential, Weibull distribution, micrositing.
Potencial Eólico em Girau do Ponciano, Alagoas
Através de Dados Anemométricos e Modelagem em Microescala
Resumo
O potencial eólico na região Agreste do Nordeste Brasileiro (NEB) tem características positivas para geração elétrica, cuja exploração ainda é pouca explorada. Este trabalho analisa uma base de dados anemométricos com 3,1 anos de duração (outubro de 2007 a outubro de 2010), coletados em Girau do Ponciano, Alagoas. Foram definidos três períodos para identificação dos padrões sazonais: Anual, estação seca (Outubro-Janeiro) e estação chuvosa (Maio-Agosto). Os valores horários e mensais mostraram que a velocidade média do vento em 50 m de altura foram superiores a 7 m s-1,
alcançando 8,5 m s-1no período seco. A direção do vento é pouco variável, oscilando entre NE e SE. Os ventos mais
intensos (³10 m s-1) foram observados durante a noite. Os parâmetros de Weibull apresentaram um desenvolvimento
sazonal distinto, onde a curva de ajuste no período seco (chuvoso) foi mais distribuída (concentrada) nas classes adjacentes a 8 m s-1(7 m s-1). Os termos relacionados a produção de energia eólica, calculados através do modelo WAsP,
também indicam a potencialidade na exploração dos ventos em Girau do Ponciano. Os valores entre 3 a 10 GWh para energia anual produzida e entre 35% a 65% de fator de capacidade são equivalentes ou superiores aos apresentados em parques eólicos em operação no NEB. Simulações em microescala indicaram que o período chuvoso possui menor potencial energético e menor variabilidade espacial. As características meteorológicas e geográficas de Girau do Ponciano são favoráveis para futuras instalações de parques eólicos. A distância para rodovias estaduais é inferior a 10 Artigo
km, com a subestação de 69 kV a aproximadamente 20 km da posição da torre anemométrica usada. Além disso, o relevo possui baixa inclinação (< 15°), vegetação rasteira e reduzida presença de edificações na região, que favorecem na redução da rugosidade aerodinâmica.
Palavras-chave:vento, energia eólica, distribuição de Weibull, mapeamento eólico.
1. Introduction
There is a need to substantially diversify the energy matrix within the Brazilian present electrical scenario. Ac-cording to the National Energy Balance (hereafter BEN16), hydraulic production is the dominant source of electrical power with 64% of total generated (MME, 2016). Further-more, wind energy production has grown more than 77% between 2014 and 2015. However, the high dependence on hydroelectric production can be a significant problem shortly next generations, according to climate change sce-narios of droughts mainly over Northeastern Brazil - NEB (Marengo et al., 2017). This future scenario will affect
many socioeconomic sectors, especially those that depend crucially on electricity, such as industries and large com-mercial/financial centers. Although, Pereiraet al.(2013)
showed that wind energy production could be affected pos-itively by climate changes in the NEB region also. The au-thors showed the climate changes could improve between 15 to 30% wind power inside NEB up to 2100. Because of this complementary possibility between the wind and hy-dro energy resources, to investigate the energy production within this region is very important, especially during long droughts or low wind periods (Martins and Pereira, 2011). Governmental actions in the last years towards fiscal incentives for renewable energy generation have promoted a strong growth of solar and wind power resources. One of the significant government incentives was the PROINFA -the Alternative Energy Sources Incentive Program in 2004 (Dutra and Szklo, 2008). After PROINFA has been estab-lished, the wind energy production grew from approxi-mately 0.22 GWh in 2004 up to 21 GWh at the end of 2015. According to Pereira (2012), the expansion of this energy resource between 2004 to 2012 was 216%, due to govern-ment programs that positively influenced the energy mar-ket. There are 330 wind farms in construction totalizing more than 7.7 GW of electrical potential (ANEEL, 2017). Therefore, these wind farms will need to reliable meteoro-logical information about wind patterns in local and re-gional scales for their logistical and operational tasks.
Following SEPLANDE (2015), the Alagoas state is known for its capacity to export energy because its domes-tic production is almost three times greater than internal consumption, making the energy sector very attractive compared to other Brazilian states nearby. The domestic energy production of Alagoas is mainly based on oil, natu-ral gas, and sugarcane industry. However, there was a gap about the wind potential in this region. In this context, the Alagoas state Wind Atlas was produced to provide a base-line which would serve as a guide to develop political
ac-tions on wind power development (ELETROBRÁS, 2008). The atlas shows a potential of 173 MW, 336 MW and 649 MW at 50 m, 75 m, and 100 m height, respectively, in areas where the wind speed was³7 m s-1. In the countryside area, the Girau do Ponciano town is located in a privileged area near by Arapiraca city, a strong economic zone and the second largest consumer of electric energy in Alagoas.
Pereiraet al.(2012) emphasize that several obstacles
are preventing an expansive growth in the Brazilian wind market. According to the authors, the low spatial distribu-tion of anemometer data and the relatively short periods of measurement taken (i.e.usually less than three years) are
the main examples. The majority wind farms were devel-oped based on numerical models from wind atlas validated by measurements collected during only one year (Martins and Pereira, 2011). Therefore, anemometer databases are essential for validation of numerical weather and climatic models. Furthermore, meteorological data is one of the most important parts in the wind atlas from a region, be-cause synoptic events can be affected the wind potential di-rectly. There are climate scenarios that show a modification in the rainfall seasons over NEB, as discussed by Marengo
et al.(2017). For example, the authors report future
scenar-ios for large temperature increases and precipitation reduc-tion. For consequence, evaporation over lakes and reser-voirs will affect the agricultural economy, irrigation, and hydro power. Nowadays, the NEB region also holds the largest number of wind power projects in operation (ANEEL, 2017).
The numerical models are one of the main tools for surveying the wind potential. Regional information on the annual, seasonal, and daily variations is some common me-teorological products that are used to develop a wind atlas (Brower and Bailey, 2012). An important feature in the use of models estimates the wind where observational informa-tion is scarce or unavailable. However, a significant limita-tion of models is its physical and dynamic representalimita-tion on the subgrid scale, mainly due to the turbulent processes. State of the art about numerical modeling and the wind po-tential evaluation emphasize the important relationship be-tween regional and microscale models (Sanz Rodrigoet al.,
2017). A well-known microscale model to wind potential application is the WAsP, an acronym for Wind Atlas Anal-ysis and Application Program (Mortensenet al., 2011).
does not adequately describe the conditions found in the countryside of the Paraíba state. Based on this information, the author improved some sensible heat fluxes adjustments that permitted a 5.3% of wind estimation gain.
This work aims to analyze the observational and nu-merical wind potential in the Girau do Ponciano area for future development and application of wind energy in the Alagoas state. A differential point of this study is the long period anemometer tower data applied that covers 3.1 years in a countryside region with a strong economy and far from sea breezes effects. Based on the proposed objec-tives, a discussion on the seasonal, monthly and local time cycle characteristics are discussed in section 3.1. The sta-tistical patterns are evaluated according to the Weibull distribution and wind roses in section 3.2. Finally, the microscale simulations using the WAsP model, where modifications were implemented to represent local atmo-spheric conditions, are showed in section 3.3. Also, the terms of capacity factor and annual energy production, both computed considering four common wind turbines configurations, are evaluated.
2. Data and Methods
An anemometer tower was installed in the Girau do Ponciano, situated at the Agreste region of Alagoas. The tower was positioned close to 20 km of a 69 kV electric sub-station installed in Arapiraca city (Fig. 1a). The wind data were collected between July 2007 and October 2010. Be-cause of high measurements failure during the first three months, this study focused on data collected from October 2007 up to October 2010. The tower was equipped with a polar Class 1 A100L2 anemometer, a wind vane W200P from Vector Instruments. Available recorded data is com-posed of 10 min average wind speed and wind direction
measured at two levels, 30 and 50 m height above the ground. All installation and operation process followed the quality and security requirements established by regulatory agencies: IEA - International Energy Agency; IEC - Inter-national Electrotechnical Commission. More details are available in ELETROBRÁS (2008).
The study area has a climate pattern mainly defined by two rainfall seasons: wet period, from May to August; and dry period, from October to January. The precipitation regime varies between 700 and 1100 mm year-1. Moreover, the temperature has a small annual amplitude, oscillating from 25 to 30 °C (SEMARH, 2017). According to Costa and Lyra (2012), the near-surface wind in this region has di-rection between E and SE weakly influenced by sea breezes and trade winds. About geographic conditions, Girau do Ponciano is characterized by hills (»450 m asl) and plains (»250 m asl), low vegetation, subsistence crops and dis-tance close to 90 km to the Atlantic Ocean (Fig. 1b). The authors reported the mean seasonal local patterns briefly: Dry period®smaller surface roughness due to low vegeta-tion, major local circulation intensity between valleys and hills; Wet season®increased vegetation height leading to major surface roughness; lower wind speed due to lower thermal gradients between valleys and hills; increased pre-cipitation frequency which strongly modifies the near-sur-face wind direction patterns. During these rainfall events, it is commonly observed wind meandering from E to NE or SE directions, mainly associated with squad lines mecha-nisms from the ocean to the continent.
A methodology for quality control was applied in these observational data, following theSistema Nacional de Organização de Dados Ambientais(SONDA) do Insti-tuto Nacional de Pesquisas Espaciais(INPE), described by
Martinset al.(2007). With the quality control application,
the total available data were close to 92% (24609 records). To identify the wind seasonality, statistical values, and its wind energy parameters three different seasonal intervals were defined: Annual, dry, and wet season. Furthermore, the difference between daytime and nighttime is discussed during these observational analysis.
The statistics analysis was based on the Weibull dis-tribution function to provide the best fit to observed wind speed covering the 3.1 yrs of anemometer measurements. Its terms can indicate to the distribution concentration in a particular wind speed class, while the other index corre-sponds directly to the average wind intensity. Therefore, the best scenario for wind production is where the fre-quency is concentrated at 7 m s-1(Amarante
et al., 2001;
ELETROBRÁS, 2008). Moreover, another advantage of the Weibull distribution is the ability to compute the data extrapolation available at different heights and analyze ex-treme winds using its shape and scale parameters (Silva, 2003). Therefore, the Weibull function can be mathemati-cally expressed as:
Figure 1- Geographic distribution of the municipalities around Girau do
f u k A u A u A k k
( )= æ exp
è
ç ö
ø
÷ -æ
è ç ö ø ÷ é ë ê ê ù û ú ú -1 (1)
wheref(u) is the wind speed frequency,A represents the scale parameter andkindicates the shape parameter of the Weibull distribution. Further details about the Weibull function is described by Wilks (2011).
2.1. WAsP model
The wind mapping and micrositing analysis were pro-duced using the WAsP model 10.2 version. The WAsP is a commercial numerical tool developed in 1987 by the Na-tional Sustainable Energy Laboratory of the Denmark Technical University (Risø DTU). General information about this tool can be obtained in WAsP-DTU website, while the technical and scientific details are described by Mortensen and Petersen (1997), Giebel and Gryning (2004) and Mortensenet al.(2011). According to these authors,
the key features of this model can be summarized as: a) Navier-Stokes equations solver through many
consider-ations by linearized numerical methods, based mainly on atmospheric boundary layer concepts: linear advection, first order turbulence closure, and steady state flow. On the large-scale, the WAsP assumes a stable atmosphere and equilibrium between the pres-sure and Coriolis forces;
b) Horizontal extrapolation following the terrain informa-tion related to relief, vegetainforma-tion, and other obstacles. This extrapolation is directly related to relief and roughness complexity. Therefore, there is a recom-mendation of 20 x 20 km domain size or less, and 100 m or smaller resolution;
c) Vertical extrapolation based on the logarithmic wind profile considering the interested height and aerody-namic terms, roughness length (z0) and friction veloc-ity (u*). Values ofz0are included by vegetation infor-mation added into the topographic map. Based onz0 and observed wind on the surface station, the geostro-phic wind is computed. After this step,u*values are finally obtained by log wind profile following the geostrophic drag law;
d) Physical parameters based on mid-latitude atmospheric patterns, where major of them are fixed and cannot be adjusted, except surface heat fluxes and air density.
The WAsP was applied with a modification of the air density (s) from 1.225 kg m-3to 1.120 kg m-3due to the original value was based on European mean atmospheric patterns. The newsvalue were derived from the Alagoas state Wind Atlas (ELETROBRÁS, 2008), based on the cli-matic data between 1961-1990 fromInstituto Nacional de Meteorologia(INMET). Following the WAsP
recommen-dations above, the horizontal domain was defined with 20 x 20 km with 100 m for grid resolution, where its center cor-responds to anemometer tower location. Therefore, the simulations were performed using the wind data measured at 50 m height from the tower and applyingz0= 0.03 m in the entire map. Obstacles configuration were ignored due to the absence of buildings or other complex surface elements around the domain.
The WAsP topographic map was elaborated using the Digital Elevation Model (DEM) from Shuttle Radar To-pography Mission (SRTM) of the Jet Propulsion Labora-tory/National Aeronautics and Space Administration (JPL/NASA). Further details are available at JPL-NASA website. The spatial resolution used here is 90 m (3 arcsen). Obstacles configuration were ignored due to the absence of buildings or other complex surface elements around the do-main.
The energy parameters such as capacity factor (Cf), annual energy production (AEP), and power density are fundamental to evaluate the wind potential (Brower and Bailey, 2012). These terms were also obtained through the WAsP following the wind turbine configuration as listed in Table 1.
3. Results and Discussions
3.1. Hourly and monthly data
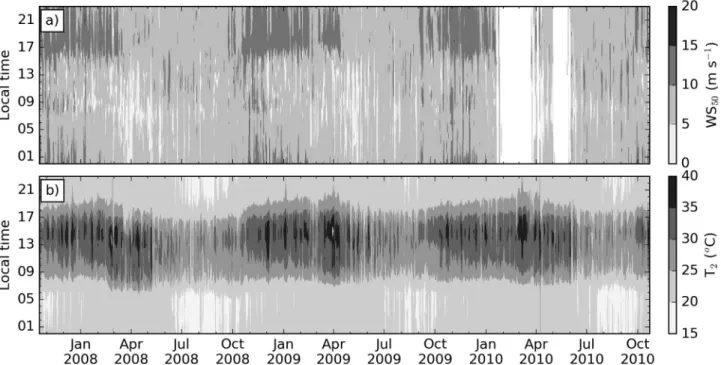
Figure 2 presents the hourly-monthly series for wind speed at 50 m (WS50) and air temperature at 2 m (T2) mea-sured in the whole campaign period. The wind intensifica-tion (> 10 m s-1) during dry months was well related with diurnal cycle of T2 (> 30 °C). Moreover, the low wind speeds were more frequent during the morning time and be-fore the wet season beginning. Overall, it is possible to ob-serve theWS50> 5 m s-1with major frequency, where its main signature is a nocturnal development. Because of rainfall absence, the vegetation growth is prejudiced, and its roughness length became smaller than the wet season. Furthermore, high-temperature values observed in this dry
Table 1- Wind turbines configuration used in the energy parameters computation, available in the WAsP program.
Wind turbine Power (kW) Height (m) Rotor diameter (m) Low speed (m s-1) High speed (m s-1)
A 850 55 52 4 25
B 1500 60 63 5 25
C 1650 70 82 3 20
periods are consistent with climate patterns of this region (SEMARH, 2017).
Figure 3 shows the monthly average of the wind speed and wind direction (Fig. 3a), and of thekandA
pa-rameters considering the same period from Fig. 2. TheWS50 average varied from 6 to 10 m s-1with higher (smaller) val-ues during the dry (wet) season. Further, theWS50 maxi-mum values ranged between 10 and 17 m s-1 (Fig. 3a).
Figure 2- Hourly series during monthly evolution from October 2007 to October 2010 for wind speed at 50 m (a) and air temperature at 2 m (b).The two
gaps between February-April and May-June 2010 were associated with instrumental failures.
Figure 3- (a) Monthly values of the wind speed (maximum, mean and minimum) and direction at 50 m asl. (b) Monthly values of the shape (k) and scale
According to Ramoset al. (2013), the exceptional calm
wind speed in May 2010 was due to atmospheric distur-bances related to meteorological events occurred. De Araú-jo Lima and Bezerra Filho (2010) rated the wind energy potential throughWS50measurements obtained in Triunfo town, with 1004 m asl in the Borborema Plateau, Pernam-buco state, Brazil. The anemometer tower discussed by the authors was installed 254 km at the northeast of the Girau do Ponciano (410 m asl). The monthly average values for
WS50in Triunfo has similar evolution compared to the local here studied, although the later recorded average speed was exceeding 10 m s-1.
The monthly evolution of the WeibullkandA
param-eters are shown in Fig. 3b. The scale factor indicates that during the dry (wet) months there is a higher frequency be-tween 8.5 m s-1(6.5 m s-1) and 11 m s-1(8 m s-1). About the
k
values, the time evolution is dispersed from August (wet season) to December (dry season). This feature is explained by the higher daily amplitude present during the months withWS50more intense. Thekparameter indicates a lag rel-ative toAparameter in the both precipitation seasons.
Fur-ther, the variableskandAtends to have a similar behavior
during February-April and September-November, increas-ing (decreasincreas-ing) values from wet (dry) up to dry (wet) sea-son. An explanation for this variability betweenA andk
could be attributed to the strong wind speed variability dur-ing the two seasons transitions.
Wind speed increases during hourly period reaching its peak nearby at 19 local time. Topography has certainly influenced this result due to several ridges and extensive valleys within this area. It is important to point out that wind direction has a close relationship with the wind speed. During nighttime, it was observed a wind veering from NE to SE followed by its speed growth. This condition was as-sociated with the local breeze circulation generated due to gradient pressure between the low altitude in the S-SE di-rection (100 m asl) and the area studied region (500 m asl). Although the distance from the coast is close to 90 km,
there is also a canalizing effect of the trade winds over the São Francisco valley up to Girau do Ponciano region, as suggested by Costa and Lyra (2012) e Ramoset al.(2013).
The next section will discuss the wind direction statistics with more detail.
3.2. Wind statistics
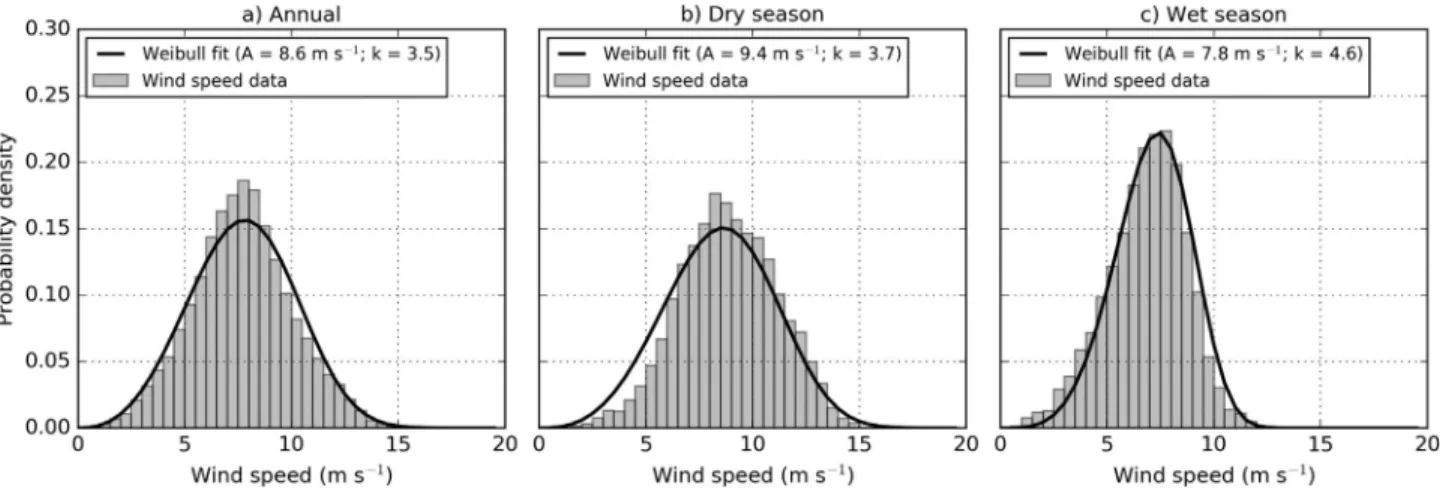
The probability density function (PDF) of the
Weibull distribution during the three periods (annual, dry and wet seasons) is showed in Fig. 4. According to this re-sult, theWS50average was always³7 m s-1, being higher during the dry season with 8.5 m s-1(Fig. 4b). Between the three periods defined, it appears that the curve fit is more adjusted for the annual distribution, as evidenced by the lowerkparameter with 3.45. ThePDFfor the wet season
was more concentrated at lower values compared to the other results (Fig. 4c), as expected. However, this rainfall period was the unique that reaches thePDFlimit of 10% for
wind classes between 7 to 8.5 m s-1.
The Weibull distributions indicated the homogeneous variability, mainly during the dry season. In the wind en-ergy context, it is a positive behavior for the electric genera-tion due to fewer problems related to the wind intermittent and its transference to the electrical grid. Moreover, all
PDFvalues showed aWS50average above 7 m s-1based on the Weibull fit. Therefore, this wind magnitude is also im-portant to the power density from a wind farm be more effi-cient and productive (ELETROBRÁS, 2008; Brower and Bailey, 2012). However, it is also essential to quantify the wind statistics between daytime and nighttime, mainly its direction. High wind direction variability can reduce the wind turbine lifetime and cause more costs with its mainte-nance.
Figure 5 presents the wind rose for annual, dry and wet period considering only values measured at daytime and nighttime. Overall, there is almost not different be-tween wind direction during daytime or nighttime, except by the wind speed intensification during the last interval.
The annual distribution shows a predominance close to 70% (Figs. 5a,d) from the east and changing to northeast and southeast during dry (Figs. 5b,e) season and wet season (Figs. 5c,f), respectively. Considering all three predomi-nant directions NE, E and SE, the percentage is near to 91%. Wind speed classes below 5 m s-1were observed only in the wet season, as show the Figs. 5c,f. The area is quite favorable to wind power exploration due to small hourly range in the wind direction < 15° (Manwellet al., 2009). However, the exception occurs during the dry season when the amplitude is almost 30°. According to Costa and Lyra (2012), this variability from NE to SE is associated with the trade winds.
The wind direction seasonal patterns occur because of different meteorological scales and they are related with rainfall regimes, as discussed by Molion and Bernardo (2002). In the synoptic scale context, the Atlantic Subtropi-cal circulation displacement has its high-pressure center moved during the summer to the Equator. Further, the near-surface winds along the Brazilian coast are intensified during this northward movement of the circulation. More-over, there are local circulations such as mountain-valley breezes in the Agreste region, as pointed out by Costa and Lyra (2012).
3.3. Wind energy parameters
Figure 6 exhibits theAEP,Cfand power density com-puted using wind turbines configurations with power from 0.85 to 2 MW. Based on this information, theAEPvalues varied between 2 and 10 GWh being the lowest and highest values during the wet and dry season, respectively (Fig. 6a). TheCfshowed magnitudes³30% for the wet season, 40%
of annual, and about 60% during the dry period (Fig. 6b). These numbers are quite significant considering the aver-age value of wind farms currently in operation in Brazil which range from 20 to 40%. According to BEN16, the av-erageCfvalue is about 32%, although some wind farms in
the Ceará and the Rio Grande do Norte states also have val-ues greater than 50% (ANEEL, 2017). According to Manwellet al.(2009), the power density ofWS50is classi-fied to be suitable for areas designated as class 4 or greater (e.g.power density³400 W m-2). Based on this
classifica-tion, Girau do Ponciano presents potential values during the dry season (Fig. 6c). Moreover, the power density was stronger between 17 and 21 h reaching values higher than 700 W m-2but varied from 200 to 600 W m-2for the other hours throughout the day. The wet season indicates less variation from day to night, now ranging between 200 and 400 W m-2.
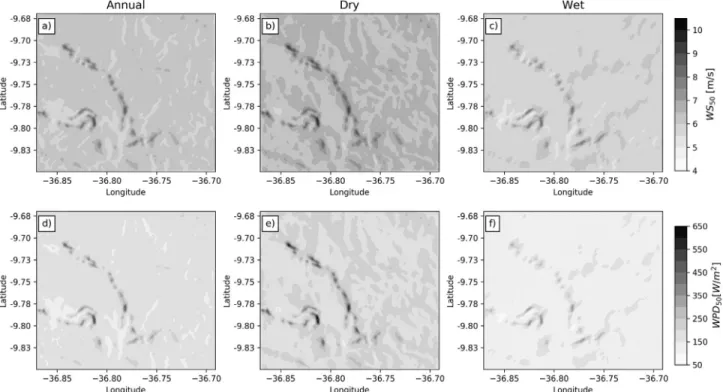
Figure 7 presents theWS50and wind power density (WPD50) simulated by the WAsP model considering the wind statistics covering the whole available period and the rainfall seasons. Because of the WAsP methodology, the high values of both maps are visualized over the hills of the domain. However, theWS50 values over the plains oscil-lated between 6 and 7.5 m s-1 based on annual period (Fig. 7a). During the dry season (Fig. 7b), the wind speed reached up to 8.5 m s-1while in the wet season decreased to 6.5 m s-1(Fig. 7c).The power density showed a high num-ber of values exceeding 300 W m-2on the map which can be attributed to the wind power grows with the cube of the
WS50. Further, this pattern results in more homogeneous spatial values over the plains.
This section showed results favorable to the wind power exploration. However, there are other essential as-pects associated with topography, socioeconomic (i.e.
in-dustries, urban areas, etc.) and infrastructure (i.e. roads, electrical grid, etc.) that needs to be discussed. All these in-formation is considered in the final plan costs of a wind farm. Based on the wind mapping showed, the hotspots are localized over hills with smooth terrain slope, with < 15° of inclination. According to Brower and Bailey (2012), this inclination is favorable to transport equipment and the tur-bine parts by trucks. Furthermore, the difference between hilltop and base is less than 70 m,i.e., a 70 m height wind
turbine or taller installed at the bottom would have the equivalent power potential. In these areas, the wind speed reaches about 10 m s-1at 50 m. Therefore, this wind power
Figure 6- Annual Energy Production (AEP,Wh) in (a) and Capacity
Factor (Cf, %) in (b) for overall period, dry season and wet season using
four options of wind turbine power. (c) Diurnal cycle of the power density (W m-2) from 2007 to 2010 for overall period (Annual series), dry season
and wet season.
Figure 7- WAsP simulation results of the mean wind speed (upper) and power density (bottom) related to the annual period (left column), dry season
tends to increase at higher levels. For example, the wind turbines in operation in the NEB range from 70-100 m height (MME, 2016). It is worthy point that WAsP program also allows vertical wind speed extrapolation for 100 m by using measurements at 50 m height. However, these results will be evaluated in future studies. Moreover, the tower was installed near from two states highways, 6.3 km distant from AL-220 roadway and 8.2 km from AL-115 roadway (ELETROBRÁS, 2008).
4. Conclusions
The wind potential based on 3.1 yr anemometer tower measurements and WAsP simulations in the Agreste region of the Alagoas state was discussed in this study. The results obtained are very encouraging for to power exploration in the Girau do Ponciano. Meteorological conditions with rainfall seasons well defined, low vegetation and plan pre-dominance, highways, and substations with less than 20 km distance are some reasons for this general conclusion.
In the measurements context, the average wind speed at 50 m height was higher than 7 m s-1, reaching 8.5 m s-1 during the dry season. Secondly, the wind direction was less variable, with 91% between NE-SE. This condition is important for reducing the wear on wind turbine rotors. The hourly cycle is defined by strong winds (³10 m s-1) during the night, mainly between 18 and 23 h local time. The Weibull parameters showed a slight seasonal variability be-tween dry and wet periods. During the dry (wet) season, the Weibull fit is more distributed (concentrated) near by 8 m s-1(7 m s-1).
In terms of wind energy parameters, the four wind turbines configurations (850, 1500, 1650, 2000 kW)
indi-cated theAEP (3 to 10 GWh) andCf (35%-65%) values
similar to the main wind farms in operation in the North-eastern Brazil. The power density after 14 h and before 2 h are³400 W m-2, being an ideal threshold to the viability of a wind farm project. However, the power density rises to > 800 W m-2between 17-20 h. This pattern is associated with gradient pressure intensification caused by high surface temperature, mainly during dry periods.
Considering the WAsP simulations, the hotspot was positioned over the hills, due to WAsP horizontal geostrophic drag methodology. Although the wet season presented the lowest values of theWS50andWPD50maps, this period was less variable compared to the annual and dry periods simulations. In the micrositing sense, the simu-lated domain is positioned near by two state highways (9 km) and close to 20 km from a 69 kV substation in the Arapiraca city. The terrain slope is also favorable to wind turbine foundation and the absence of other obstacles or high vegetation.
For future evaluations, it is recommended economic and logistical impacts analysis, including the possibility of wind farm implementation in the Girau do Ponciano or
nearby areas. It is also suggested a review of wind speed mapping through WAsP simulations for heights similar to those used by wind turbines currently in operation in North-eastern Brazil.
Acknowledgments
We are grateful for the National Council for Scientific and Technological Development (CNPq) by the postdoc-toral fellowship for the first author (grant 420375/2017-1) and by the financial support in thePrevisão do Vento em Parques Eólicos no Nordeste Brasileiro (grant
555712/2010-9). We thank the two anonymous reviewers for considerations that improved the final form of this manuscript.
References
AMARANTE, O.A.C.; BROWER, M.; ZACK, J.; SÁ, A.L.Atlas
do potencial eólico brasileiro.Brasília, Brazil, CRESESB, 2001.
ANEEL.Banco de Informações de Geração (BIG). Agência
Nacional de Energia Elétrica (ANEEL). Brasília, Brazil.
Available in:
http://www.aneel.gov.br/aplicacoes/capacidadebrasil/capac idadebrasil.cfm. Accessed in: 11 Feb. 2017.
BROWER, M.; BAILEY, B.H.Wind resource assessment: a
practical guide to developing a wind project. New Jersey,
USA: Wiley, 2012.
COSTA, G.B.; LYRA, R.F.F. Análise dos padrões de vento no Estado de Alagoas.Revista Brasileira de Meteorologia, v. 27, n. 1, p. 31-38, 2012.
DALMAZ, A.Estudo do potencial eólico e previsão de ventos para geração de eletricidade em Santa Catarina.
Mas-ter’s dissertation in Mechanical Engineering. Universidade Federal de Santa Catarina, 2007.
DE ARAUJO LIMA, L.; BEZERRA FILHO, C.R. Wind energy assessment and wind farm simulation in Triunfo -Pernambuco, Brazil. Renewable Energy, v. 35, n. 12, p.
2705-2713, 2010.
DUTRA, R.M.; SZKLO, A.S. Incentive policies for promoting wind power production in Brazil: Scenarios for the Alterna-tive Energy Sources IncenAlterna-tive Program (PROINFA) under the New Brazilian electric power sector regulation. Renew-able Energy, v. 33, n. 1, p. 65-76, 2008.
ELETROBRÁS.Atlas Eólico do Estado de Alagoas. Maceió,
Brazil. Available in: http://dados.al.gov.br/dataset/at-las-eolico-do-estado-de-alagoas.
GIEBEL, G.; GRYNING, S.-E. Shear and stability in high met masts and how WAsP treats it. The science of making torque from wind. Technical Report, European Wind Energy Asso-ciation, 2004.
MANWELL, J.F.; MCGOWAN, J.G.; ROGERS, A.L.Wind
En-ergy Explained: Theory, Design and Application.
Chi-chester, UK: Wiley, 2009.
MARENGO, J.A.; TORRES, R.R.; ALVES, L.M. Drought in Northeast Brazil - past, present, and future.Theoretical and Applied Climatology, v. 129, n. 3-4, p. 1189-1200, 2017. MARTINS, F.R.; GUARNIERI, R.A.; PEREIRA, E.B.;
nacional de estações para coleta de dados meteorológicos aplicados ao setor de energia. I Congresso Brasileiro de Energia Solar. Proceedings Fortaleza, Ceará, Brazil: Asso-ciação Brasileira de Energia Solar, 2007.
MARTINS, F.R.; PEREIRA, E.B. Enhancing information for so-lar and wind energy technology deployment in Brazil. En-ergy Policy, v. 39, n. 7, p. 4378-4390, 2011.
MME.Balanço Energético Nacional 2016 - Ano Base 2015.
Ministério de Minas e Energia (MME). Brasília, Brazil. MOLION, L.C.B.; BERNARDO, S.O. Uma revisão da dinâmica
das chuvas no nordeste brasileiro. Revista Brasileira de Meteorologia, v. 17, n. 1, p. 1-10, 2002.
MORTENSEN, N.G.; HEATHFIELD, D.N.; RATHMANN, O.S.
Wind Atlas Analysis and Application Programa - WAsP 10 Help Facility. Roskilde, Denmark 2011.
MORTENSEN, N.; PETERSEN, E.Influence of topographical
input data on the accuracy of wind flow modeling in complex terrain. Proceedings of the European Wind
En-ergy Conference, Dublin, Ireland, p. 3-6, 1997.
PEREIRA, E.B.; MARTINS, F.R.; PES, M.P.; CRUZ SEGUN-DO, E.I.; LYRA, A.A. The impacts of global climate changes on the wind power density in Brazil.Renewable Energy, v. 49, p. 107-110, 2013.
PEREIRA, M.G.; CAMACHO, C.F.; FREITAS, M.A.V.; SIL-VA, N.F. The renewable energy market in Brazil: Current status and potential.Renewable and Sustainable Energy Reviews, v. 16, n. 6, p. 3786-3802, 2012.
PEREIRA, R.Expansão de eólicas é de 216% em três anos.
Disponível em:
http://economia.estadao.com.br/noticias/geral,expansao-de -eolicas-e-de-216-em-tres-anos,133460e. Accessed in: 12 Mar. 2017.
RAMOS, D.N.S.; LYRA, R. F.F.; SILVA JÚNIOR, R.S. Previsão do vento utilizando o modelo atmosférico WRF para o
estado de Alagoas. Revista Brasileira de Meteorologia,
v. 28, n. 2, p. 163-172, 2013.
SANZ RODRIGO, J.; ARROYO, R.A.C.; MORIARTY, P.;
CHURCHFIELD, M.; KOSOVIC, B.et al. Mesoscale to
microscale wind farm flow modeling and evaluation.Wiley Interdisciplinary Reviews: Energy and Environment,
v. 6, n. 2, p. 214, 2017.
SEMARH.Normal Climatológica.Secretaria de Estado do Meio Ambiente e dos Recursos Hídricos (SEMARH). Maceió, Brazil. Available in: http://www.semarh.al.gov.br/. Acessed in: 10 Jul. 2017.
SEPLANDE.Balanço Energético do Estado de Alagoas 2015
-Ano Base 2014.Secretaria de Estado do Planejamento e do Desenvolvimento Econômico de Alagoas (SEPLANDE).
Maceió, Brazil. Available in:
http://da-dos.al.gov.br/dataset/balanco-energetico-do-estado-de-alag oas. Accessed in: 10 Jul. 2017.
SILVA, G.R. Características de vento da Região Nordeste:
Análise, modelagem e aplicações para projetos de cen-trais eólicas. Master’s dissertation in Mechanical
Engi-neering. Universidade Federal de Pernambuco, 2003. VIEIRA, C.F.A.Sensibilidade do Modelo WAsP aos efeitos da
estabilidade atmosférica no Nordeste do Brasil. Master’s dissertation in Applied Physics Sciences. Universidade Estadual do Ceará, 2008.
WILKS, D.S.Statistical Methods in the Atmospheric Sciences.
2nd. ed. San Diego, USA: Elsevier, 2011.
Internet resources
WAsP-DTU: www.wasp.dk.JPL-NASA: http://www2.jpl.nasa.gov/srtm/.