Setembro, 2014
Nuno Lemos Braamcamp de Mancelos
Licenciatura em Ciências da Engenharia Electrotécnica e de Computadores
A Piezoelectric Based Energy Harvester Interface
for a CMOS Wireless Sensor IC
Dissertação para obtenção do Grau de Mestre em Engenharia Electrotécnica e de Computadores
Orientador: Prof. Doutor João Pedro Abreu de Oliveira
Júri:
Presidente: Professor Doutor Luís Filipe Figueira de Brito Palma Arguente: Professor Doutor Luís Augusto Bica Gomes de Oliveira
i
A Piezoelectric Based Energy Harvester Interface for a CMOS Wireless Sensor IC
Copyright © Nuno Lemos Braamcamp de Mancelos, Faculdade de Ciên-cias e Tecnologia, Universidade Nova de Lisboa.
iii
Acknowledgements
I would like to express my gratitude to my advisor, Prof. João Pedro Oliveira, for the interest he showed in my thesis right from the beginning, the patient advice and dedicated support he gave me, and for having accepted to help me in the particular subject that is approached in the thesis, which repre-sents a growing interest of mine. As someone whose motivation is strongly en-hanced by increased levels of personal interest, I truly value that acceptance.
I wish to express my appreciation to Prof. Fortunato Dualibe for his shared time and expertise, and for having assured a smooth and encouraging transition to a different department in a different country. His assertive guid-ance drove many crucial aspects of the thesis forward, and at full speed.
Prof. Luís Oliveira is also someone I want to thank. His classes helped me realise that my Master’s degree should focus on Electronics. His willingness to assist and guide his students is tireless.
For all the much needed support, encouragement, affection and patience, I wholeheartedly thank my mother, father and sister. They are, and have always been, more than I could wish for. I am very proud to call them family.
v
Universidade Nova de Lisboa
Resumo
Faculdade de Ciências e Tecnologia
Departamento de Engenharia Electrotécnica e de Computadores
Mestrado em Engenharia Electrotécnica de e Computadores
por Nuno Lemos Braamcamp de Mancelos
Esta tese apresenta a implementação de um sistema energy harvesting pie-zoeléctrico que tem o objectivo de alimentar um receptor RF com um consumo de 6 mW. Para tal é necessário que o sistema regule a saída de um transdutor piezoeléctrico submetido a vibração. A caracterização do transdutor escolhido é o ponto de partida do projecto, sendo que seguidamente é apresentado o recti-ficador responsável por rectificar a saída AC do transdutor, um full-bridge cross-coupled rectifier. O conversor DC-DC utilizado é um low-dropout regulator, que garante que a saída do sistema é mantida a um valor constante e com ripple
reduzido. Este valor é 0,6 V, que corresponde à tensão de alimentação requisi-tada pelo receptor. O circuito é desenhado recorrendo à tecnologia CMOS 130 nm UMC, e apresenta uma arquitectura sem bobines, com reduzida área e cus-to. As simulações eléctricas feitas para o sistema completo levam a concluir que o circuito é uma solução plausível no que toca à alimentação do receptor RF, tendo em consideração níveis moderados de vibração do transdutor piezoeléc-trico.
vii
Universidade Nova de Lisboa
Abstract
Faculdade de Ciências e Tecnologia
Departamento de Engenharia Electrotécnica e de Computadores
Mestrado em Engenharia Electrotécnica de e Computadores
by Nuno Lemos Braamcamp de Mancelos
In this thesis a piezoelectric energy harvesting system, responsible for regulating the power output of a piezoelectric transducer subjected to ambient vibration, is designed to power an RF receiver with a 6 mW power consump-tion. The electrical characterisation of the chosen piezoelectric transducer is the starting point of the design, which subsequently presents a full-bridge cross-coupled rectifier that rectifies the AC output of the transducer and a low-dropout regulator responsible for delivering a constant voltage system output of 0.6 V, with low voltage ripple, which represents the receiver’s required sup-ply voltage. The circuit is designed using CMOS 130 nm UMC technology, and the system presents an inductorless architecture, with reduced area and cost. The electrical simulations run for the complete circuit lead to the conclusion that the proposed piezoelectric energy harvesting system is a plausible solution to power the RF receiver, provided that the chosen transducer is subjected to moderate levels of vibration.
ix
Contents
LIST OF FIGURES ... XI
LIST OF TABLES ... XIII
ABBREVIATIONS ... XV
1 - INTRODUCTION ... 1
1.1–BACKGROUND AND MOTIVATION ... 1
1.2–STRUCTURE ... 3
1.3–CONTRIBUTIONS ... 5
2 - TOWARDS SELF-POWERED WIRELESS SENSOR NODES ... 7
2.1–SYSTEM OVERVIEW ... 8
2.2–ENERGY HARVESTING ... 14
2.2.1 – Electromechanical Energy Harvesting ... 15
2.2.2 – Considerations regarding Energy Harvesting Applications... 24
2.3–LOW-VOLTAGE RFRECEIVER ... 25
2.3.1 – Transceivers designed for Wireless Sensor Networks ... 25
2.3.2 – RF Receiver to be powered by the Energy Harvesting System ... 27
3 - ENERGY HARVESTING FROM PIEZOELECTRIC VIBRATION TRANSDUCERS 31 3.1–PIEZOELECTRIC ENERGY HARVESTING OVERVIEW ... 32
3.2–THE PIEZOELECTRIC TRANSDUCER ... 34
3.3–RECTIFIERS ... 38
3.3.1 – Passive Rectifiers ... 38
3.3.2 – Active Rectifiers ... 45
3.4–DC-DCCONVERTERS ... 50
3.4.1 – Linear Regulators ... 50
3.4.2 – Switched Capacitor Converters ... 52
3.4.3 – Magnetic Converters ... 54
4 - PROPOSED SYSTEM AND CIRCUIT DESIGN ... 59
4.1–PIEZOELECTRIC ENERGY HARVESTING SYSTEM OVERVIEW ... 60
4.2–ACTIVE FULL-BRIDGE CROSS-COUPLED RECTIFIER ... 66
4.3–LOW-DROPOUT REGULATOR ... 70
4.3.1 – PMOS Switch ... 71
x
4.3.3 – Clock Generator... 82
5 - ELECTRICAL SIMULATIONS AND LAYOUT ... 87
5.1–ELECTRICAL SIMULATIONS ... 88
5.1.1 – Piezoelectric transducer and Load circuits used for the simulations ... 88
5.1.2 – Simulations regarding the Rectifier ... 90
5.1.3 – Simulations regarding the Complete Proposed System... 94
5.1.4 – Simulations regarding the Complete Proposed System and the RF receiver’s LNA ... 101
5.2–LAYOUT ... 104
5.2.1 – Layout considerations for the Power Circuit ... 105
5.2.2 – Layout considerations for the Control Circuit ... 105
6 - CONCLUSIONS ... 107
6.1–CONCLUSIONS ... 107
xi
List of Figures
2.1:WIRELESS SENSOR NETWORK APPLICATIONS ... 8
2.2:STRUCTURE OF A WIRELESS SENSOR ACTUATOR NODE ... 10
2.3:DISTRIBUTION OF POWER CONSUMPTION FOR TWO DIFFERENT WSANS, A) SENSOR NODE BASED ON THE NORDIC RF24L01, B) SENSOR NODE BASED ON THE IMEC’S ULP WIRELESS, DATA FROM [2] ... 11
2.4:DIRECT-FORCE GENERATOR DIAGRAM, ADAPTED FROM [3] ... 16
2.5:INERTIAL-FORCE GENERATOR DIAGRAM, ADAPTED FROM [3] ... 17
2.6:MAGNETIC SPRING GENERATOR DIAGRAM, ADAPTED FROM [7] ... 18
2.7:RESONATOR ELECTROMAGNETIC GENERATOR, FIGURE TAKEN FROM [10] ... 19
2.8:THE DIRECT AND CONVERSE PIEZOELECTRIC EFFECTS ... 20
2.9:DIAGRAM OF A PIEZOELECTRIC TRANSDUCER WITH A BEAM STRUCTURE, FIGURE TAKEN FROM [12] ... 22
2.10:BLOCK DIAGRAM FOR A WSAN'S WIRELESS TRANSCEIVER ... 25
2.11:LOW-IFRECEIVER ARCHITECTURE ... 27
2.12:COMPLETE RECEIVER CIRCUIT WITH ALL TRANSISTOR SIZES (W/L) IN UM, TAKEN FROM [17] ... 28
3.1:BLOCK DIAGRAM OF A GENERIC PIEZOELECTRIC ENERGY HARVESTING SYSTEM ... 33
3.2:EQUIVALENT CIRCUIT OF A SINGLE WAFER ON AN INERTIAL PIEZOELECTRIC TRANSDUCER VIBRATING NEAR THE RESONANCE FREQUENCY ... 34
3.3:MIDÉ VOLTURE™V21BL ... 35
3.4:EQUIVALENT CIRCUIT OF A PARALLEL CONFIGURATION FOR A TWO-WAFER PIEZOELECTRIC TRANSDUCER ... 36
3.5:FULL-BRIDGE RECTIFIER ... 38
3.6:PREDICTED INPUT CURRENT AND VOLTAGE WAVEFORMS FOR THE FULL-BRIDGE RECTIFIER, ADAPTED FROM [25] ... 39
3.7:VOLTAGE DOUBLER RECTIFIER ... 42
3.8:PREDICTED INPUT CURRENT AND VOLTAGE WAVEFORMS FOR THE VOLTAGE DOUBLER RECTIFIER, ADAPTED FROM [25]... 43
3.9:SWITCH-ONLY RECTIFIER,[21] ... 45
3.10:RELEVANT CURRENT AND VOLTAGE WAVEFORMS RELATED TO THE SWITCH-ONLY RECTIFIER'S OPERATION, ADAPTED FROM [21] ... 46
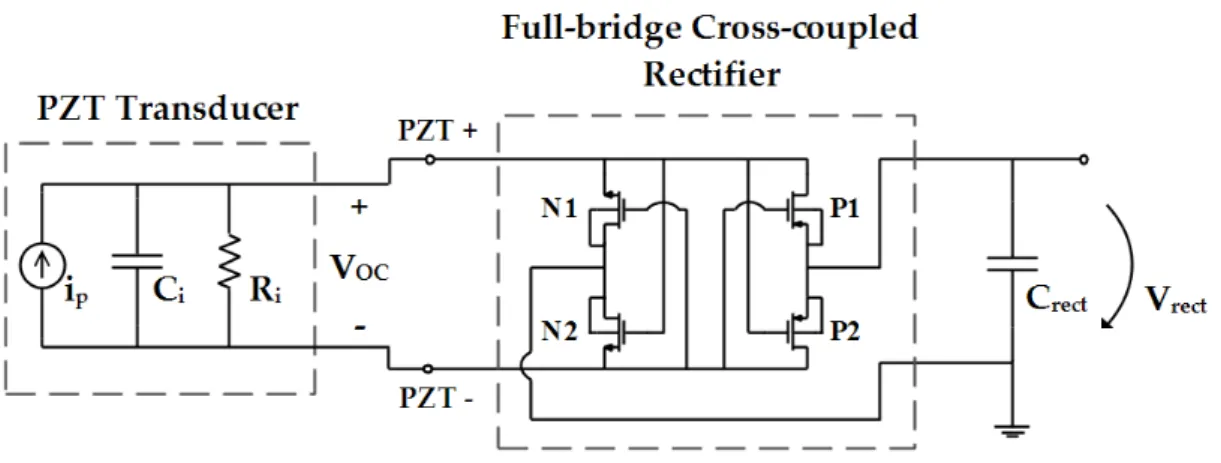
3.11:FULL-BRIDGE CROSS-COUPLED RECTIFIER ... 48
3.12:LOW-DROPOUT REGULATOR ... 51
3.13:SWITCHED CAPACITOR VOLTAGE DOUBLER ... 53
3.14:TOPOLOGY OF A BUCK CONVERTER ... 55
xii
4.1:BLOCK DIAGRAM OF THE PROPOSED PIEZOELECTRIC ENERGY HARVESTING POWER CIRCUIT, GREYED OUT
BLOCKS ARE NOT INCLUDED IN THE PROPOSED DESIGN ... 60
4.2:SIMPLIFIED VISUALISATION OF THE SYSTEM'S OUTPUT VOLTAGE RIPPLE ... 64
4.3:FULL-BRIDGE CROSS-COUPLED RECTIFIER SCHEMATIC, INCLUDING TRANSISTOR DIMENSIONS IN UM(W/L) . 66 4.4:VARIATION OF THE PMOS DEVICE VOLTAGE DROP FOR DIFFERENT ASPECT RATIO VALUES ... 68
4.5:LOW-DROPOUT REGULATOR ... 70
4.6:VARIATION OF THE POWER DISSIPATED AT THE CONDUCTING SWITCH BY HEATING EFFECT, WITH THE TRANSISTOR’S ASPECT RATIO AS A VARIABLE (PLOAD=6MW) ... 72
4.7:LATCH COMPARATOR'S SIMPLIFIED SCHEMATIC ... 74
4.8:PREAMPLIFIER STAGE OF THE COMPARATOR ... 76
4.9:LATCH CIRCUIT OF THE COMPARATOR, INCLUDING SWITCHES AND OUTPUT INVERTERS ... 79
4.10:CLOCK GENERATOR'S ARCHITECTURE... 82
4.11:VISUALISATION OF THE OPERATION OF THE OSCILLATOR RING INVERTERS ... 83
4.12:NOR GATE SCHEMATIC ... 86
5.1:PIEZOELECTRIC TRANSDUCER'S EQUIVALENT CIRCUIT WITH THE CHOSEN DEFAULT SYSTEM INPUT VALUES .... 88
5.2:LOAD CIRCUIT USED FOR THE SIMULATIONS ... 89
5.3:SCHEMATIC USED FOR THE SIMULATIONS OF THE RECTIFIER MODULE ... 90
5.4:SIMULATIONS OF THE RECTIFIER MODULE FOR THE DEFAULT SYSTEM INPUT, ... 91
5.5:SIMULATION OF THE RECTIFIER MODULE FOR THE DEFAULT SYSTEM INPUT, WITH ... 92
5.6:SIMULATION OF THE RECTIFIER MODULE WITH ... 93
5.7:SCHEMATIC USED FOR THE SIMULATIONS OF THE COMPLETE PROPOSED ENERGY HARVESTING SYSTEM... 94
5.8:SIMULATION SHOWING THE COMPARATOR'S OUTPUT SIGNAL, , AND INPUT SIGNALS, AND . 95
5.9:SIMULATION SHOWING THE CLOCK SIGNALS Ф1 AND Ф2, GENERATED BY THE CLOCK GENERATOR CIRCUIT ... 96
5.10:SIMULATION OF THE COMPLETE PROPOSED SYSTEM FOR THE DEFAULT SYSTEM INPUT, , AND THE DEFAULT LOAD REQUIREMENTS, AND ... 97
5.11:SIMULATION OF THE COMPLETE PROPOSED SYSTEM FOR THE DEFAULT SYSTEM INPUT, ZOOMED IN SIGNAL... 97
5.12:SIMULATION OF THE COMPLETE PROPOSED SYSTEM FOR THE MINIMUM TRANSDUCER OUTPUT LEVELS THAT GUARANTEE THE APPLICATION'S POWER REQUIREMENTS, ... 98
5.13:SIMULATION OF THE COMPLETE PROPOSED SYSTEM FOR AND , WITH ... 99
5.14:SIMULATIONS OF THE COMPLETE PROPOSED SYSTEM FOR AND , WITH ... 100
5.15:CIRCUIT CONFIGURATION FOR THE SIMULATION OF THE ENERGY HARVESTING SYSTEM AND THE RF RECEIVER’S LNA ... 101
5.16:SIMULATION OF THE COMPLETE PROPOSED SYSTEM AND THE RF RECEIVER’S LNA, WITH A 0VDC INPUT . 102 5.17:ZOOMED IN VIEW OF THE SIMULATION OF THE COMPLETE PROPOSED SYSTEM AND THE RF RECEIVER’S LNA ... 102
5.18:COMPLETE CIRCUIT LAYOUT ... 104
xiii
List of Tables
2.1:POWER CONSUMPTION VALUES FOR DIFFERENT COMMERCIAL SENSOR NODES,[1]... 10
2.2:TYPICAL POWER OUTPUT DENSITIES FOR DIFFERENT ENERGY HARVESTING SOLUTIONS ... 13
2.3:EXAMPLES OF DIFFERENT WSN TRANSCEIVERS AND CORRESPONDENT POWER CONSUMPTION VALUES ... 26
2.4:SUMMARY OF THE RFRECEIVER’S POWER REQUIREMENTS ... 30
4.1:SUMMARY OF THE RFRECEIVER’S POWER REQUIREMENTS ... 61
4.2:SUMMARY OF THE TRANSDUCERS’ELECTRICAL CHARACTERISTICS,[19]... 61
4.3:SUMMARY OF THE TRANSDUCERS’OPEN CIRCUIT VOLTAGE VALUES FOR DIFFERENT VIBRATION AMPLITUDES, [19] ... 62
4.4:CHOSEN CAPACITANCE VALUES FOR THE SYSTEM’S EXTERNAL CAPACITORS ... 65
4.5:FULL-BRIDGE CROSS-COUPLED RECTIFIER TRANSISTOR DIMENSIONS AND CHARACTERISTICS ... 69
4.6:IMPORTANT TECHNOLOGY-RELATED VALUES CONSIDERED IN THE DIMENSIONING OF THE PROPOSED CIRCUIT . 69 4.7:PMOSSWITCH DIMENSIONS AND CONDUCTING CHARACTERISTICS ... 73
4.8:SUMMARY OF THE COMPARATOR’S OUTPUT-INPUT CORRESPONDENCE ... 75
4.9:PREAMPLIFIER TRANSISTOR DIMENSIONS ... 78
4.10:LATCH CIRCUIT TRANSISTOR DIMENSIONS... 81
4.11:DIMENSIONS FOR THE INVERTER RING TRANSISTORS OF THE CLOCK GENERATOR ... 85
4.12:CLOCK GENERATOR’S SMALL DELAY INVERTER AND NOR GATE TRANSISTOR DIMENSIONS... 85
xv
Abbreviations
AC Alternating Current
ADC Analog-to-digital Converter
CMOS Complimentary Metal-Oxide-Semiconductor
DC Direct Current
LDO Low-dropout
LNA Low Noise Amplifier
MCU Microcontroller
NMOS N-Channel Metal-Oxide-Semiconductor PMOS P-Channel Metal-Oxide-Semiconductor PSRR Power Supply Rejection Ratio
PZT Lead Zirconate titanate
RF Radio Frequency
SHM Structural Health Monitoring
SoC System on Chip
WSAN Wireless Sensor Actuator Node
1
Introduction
1.1
–
Background and Motivation
Energy harvesting comprises a wide variety of techniques that make use of ambient energy to power different types of electronic devices. It differenti-ates itself from conventional renewable sources mainly due to its small scale, and is suitable to power devices like Wireless Sensor Actuator Nodes (WSAN), which are used to collect physical or environmental information, like tempera-ture, humidity, radiation and other physical quantities, usually spread across vast or hardly accessible areas. These devices are commonly required to operate in locations surrounded by one or several sources of residual energy, which can be ambient light, thermal gradients, kinetic energy in the form of vibration or energy present in propagating radio waves, just to name a few. The WSAN de-vices are wirelessly connected in Wireless Sensor Networks (WSN) formed by several energy autonomous nodes. The common solution to independently power these nodes is the use of batteries, which demand periodic replacement and costly maintenance, since they generally store insufficient amounts of en-ergy, when considering each node’s life cycle duration.
Using energy harvesting techniques that are specifically designed to scav-enge certain types of residual energy is a plausible answer to the energy de-mands of the devices that constitute some WSNs. By enabling the energy
2
sufficiency of each node, these techniques enhance their wireless and wide-spread operations, allowing the devices to be installed in increasingly hard to reach or hazardous locations, and giving an incentive to the use of these wire-less networks, since their reduced need for maintenance is likely to reduce their overall associated costs.
Some possible uses for WSNs are medical applications, in which the sen-sor nodes may be worn or implanted, environmental applications like forest fire detection, water quality and air pollution monitoring, structural health toring regarding buildings or different large-scale structures, industrial toring directed to factory environments or agriculture, and even military moni-toring.
In terms of distribution and density values, kinetic energy is a relevant source of energy in some of the applications’ environments. Vibration is a common source for this type of energy. One of the most interesting solutions to convert the energy contained in vibrations, in terms of typical power density values, is to use inertial piezoelectric transducers. These transducers explore the piezoelectricity of certain ceramics and crystalline materials, which is a prop-erty that is defined by the accumulation of charge inside the structure of piezo-electric materials when mechanical strains are applied to them.
This work presents the design of a piezoelectric energy harvesting system, intended to supply a low-power RF receiver whose design is not part of this work but was the focus of another master’s thesis, included in the same multid-isciplinary project, a WSAN System on Chip (SoC). The energy harvesting sys-tem includes a full-bridge cross-coupled rectifier that rectifies the AC output of the inertial piezoelectric transducer. In order to convert the rectifier’s output, a DC-DC converter is used, consisting in a low-dropout (LDO) regulator that is responsible for delivering a constant voltage supply, with reduced voltage rip-ple, to the RF receiver’s voltage supply rail.
3
vibration conditions to which they are subjected. These variations were taken into account in order to understand if typical vibration levels generate enough energy in the chosen piezoelectric transducers for the energy harvesting system to be able to meet the power demands of the RF receiver.
1.2
–
Structure
After this introductory chapter, this thesis contains five chapters, with the contents that are summarised in this section.
Chapter 2 – Towards self-powered Wireless Sensor Nodes
The second chapter approaches the concept of synergy between wireless sensor networks and energy harvesting. A comparison of typical WSN power demands and energy harvesting power outputs proves the relevance of this type of techniques as a solution to power these devices. The main energy har-vesting techniques are briefly presented, with special focus on the piezoelectric case. The RF receiver that is to be powered by the designed system is briefly presented, along with its power requirements.
4
Chapter 4 – Proposed System and Circuit Design
This is the chapter where the proposed system is presented. A system overview is offered, in which the typical transducer output values are given for different vibration conditions, according to the chosen transducer family’s data-sheet. The system overview also includes the dimensioning of the system’s e x-ternal components. After this, the rectifier is presented, along with the dimen-sions of its devices and the considerations made for the sizing process. The presentation of the DC-DC converter is separated into three parts, each one in-cluding schematics and sizing: the switch, the comparator and the clock genera-tor circuit.
Chapter 5 – Electrical Simulations and Layout
The electrical simulations, and the main conclusions they lead to, are pre-sented in this chapter. These simulations are divided into two sections: related to the rectifier, and regarding the complete system. For those related to the complete system, some adjustments were tested in the load requirements and transducer predicted outputs, in order to test the system’s versatility and ove r-all performance under different conditions and requirements.
Chapter 6 – Conclusions
5
1.3
–
Contributions
This thesis originated from an experimental validation that was done for the operation of a commercially available piezoelectric transducer. This study provided insight related to piezoelectric energy harvesting and resulted in a publication in the 5th Doctoral Conference on Computing, Electrical and Indus-trial Systems (DoCEIS) 2014, entitled “Piezoelectric Energy Harvester for a CMOS Wireless Sensor”.
The study of low-voltage techniques resulted in another publication in the same conference, entitled “Stability Improvements in a Rail-to-Rail In-put/Output, Constant Gm Operational Amplifier, at 0.4 V Operation, Using the Low-Voltage DTMOS Technique”.
The multidisciplinary project in which this thesis is integrated includes the design of an RF receiver that is to be supplied by the proposed energy harvest-ing system. The design of this receiver was done havharvest-ing in mind this type of power supply and its requisites became the energy harvesting system’s power output goals. An article regarding this RF receiver, entitled “A Low-Voltage LNA and Current Mode Mixer Design for Energy Harvesting Sensor Node” was published in the 21st Mixed Design of Integrated Circuits & Systems (MIXDES) conference, 2014.
7
Towards self-powered Wireless Sensor Nodes
The concept of synergy between wireless sensor networks and energy harvesting is presented in this chapter.
In section 2.1, a system overview is offered, including an introduction to wireless sensor networks’ applications, structure and typical power consump-tions. The advantages of self-powered wireless sensor nodes in relation to bat-tery-powered ones are emphasized, and energy harvesting is presented as a so-lution to guarantee energy self-sufficiency for the sensor nodes, with some typi-cal power output values given for different energy harvesting solutions.
Section 2.2 gives an overall notion of the most important energy harvest-ing generators, focusharvest-ing on piezoelectric energy harvestharvest-ing. This section pre-sents important considerations about the design of piezoelectric energy harvest-ing power supplies.
The structure and typical power consumption values of the transceivers used in wireless sensor nodes are introduced in section 2.3. The Low-voltage RF receiver that is intended to be supplied by the energy harvesting system is briefly presented, and its power requirements are highlighted.
8
2.1
–
System Overview
There are many applications in which physical or environmental informa-tion is scattered and needs to be collected by sensors in order to be used and processed. Some examples may be catalogued in four main areas: environ-mental monitoring, industrial monitoring, health care monitoring and military monitoring. The sensors are usually connected by a wireless network, com-monly referred to as a Wireless Sensor Network (WSN). Figure 2.1 presents some examples of applications for WSNs.
Figure 2.1: Wireless Sensor Network Applications
9
Industrial environments often include restricted or hazardous areas con-taining important machinery that needs to be under constant supervision, in order to monitor equipment and operation conditions. That supervision is made possible by sensing and collecting particular physical parameters, in each situation, making use of strategically located devices, which can be subjected to extreme or hazardous environments. The agricultural sector also represents an example of widely scattered industrial areas where it is convenient to collect and process information regarding temperature, humidity and sunlight, for ex-ample. Structural Health Monitoring (SHM) is also an important field in which sensors are spread, in this case in structures or buildings, with the objective of monitoring their overall condition and conservation state, analysing changes to the materials, vibration patterns or alterations in geometry.
Health care monitoring consists in collecting physical information regard-ing a person’s body that gives competent medical staff, or even the patient, the ability to define a realistic and real-time medical condition. This information might be, for example, body temperature, heart rate, respiratory rate or blood pressure and the sensors that enable the monitoring can be implanted inside the patient’s body or simply be wearable devices.
Among military monitoring applications, measuring acoustic intensity in vast areas may help detect and map explosions or enemy fire, and chemical or biological sensing of the environment can be useful to prevent intoxication and serious damage caused by chemical weapons.
In order to create a WSN, several Wireless Sensor Actuator Nodes (WSAN) are wirelessly interconnected. These are autonomous sensor nodes that collect information making use of their sensors, process that information using their analog-to-digital converters (ADC), microcontrollers (MCU) and additional electronic circuitry and then wirelessly transmit that information through their radio transceivers. These nodes may also be equipped with actua-tors in order to interact with their environment. The transceivers allow the in-dividual nodes of the network to receive and transmit information, thus con-necting them all, forming a WSN.
10
Figure 2.2: Structure of a Wireless Sensor Actuator Node
Depending on data rate, range of communication, number of sensors and actuators and processing requirements of each WSAN, just to give some rele-vant examples, the total power consumption varies for different devices. Table 2.1, [1], presents power consumption values for different commercial sensor nodes and includes some of their specifications.
Table 2.1: Power Consumption values for different commercial sensor nodes, [1]
Crossbow MICAz Intel Mote 2 Jennie JN5139
Radio standard IEEE802.15.4/ZigBee IEEE802.15.4 IEEE802.15.4/ZigBee
Typical range 100 m 30 m 1 km
Data rate
(kbps) 250 250 250
Receiver
con-sumption 19.7 mA 44 mA 34 mA
Transmitter
consumption 17.4 mA (+0 dbm) 44 mA 34 mA (+3 dbm) Minimum
supply voltage 2.7 V 3.2 V 2.7 V
Average total power
con-sumption
11
Each WSAN’s total power consumption is the sum of the power consum p-tion of all of its modules, which in turn have very different power demands among them. Even if distinct WSANs have different data rates for their wireless communications and their transceivers are not continuously communicating, the wireless transceiver is generally the module with the highest power con-sumption in the node. Modules like the power management, the microcontrol-ler and the actual sensor also represent a relevant consumption value, as can be seen in Figure 2.3, [2], where the contribution of the most relevant modules in terms of power consumption is presented for two different WSAN devices.
Figure 2.3: Distribution of Power Consumption for two different WSANs, a) sensor node
based on the Nordic RF24L01, b) sensor node based on the imec’s ULP wireless, data from [2]
12
power consumption for this second approach is 362 μW. Even with the reduc-tion in the power consumpreduc-tion values of the transceiver, this module is still re-sponsible for one third of the total power consumption. Having these two ex-amples in mind, the main conclusion taken from the distribution of the power consumption of a WSAN is that the wireless transceiver is not only a very im-portant module in terms of the creation of the network of nodes but also a cru-cial module to take into account when considering each node’s power co n-sumption. Further attention will be dedicated to these wireless transceivers in section 2.3.
Since the wireless sensor nodes must be energetically autonomous, they must be powered individually. Their wireless characteristics allow them to be installed in virtually any place inside a reasonably sized area, dependent on their communication range. The freedom of operation in a vast area given to the devices by their wireless capabilities would be compromised if they had to be powered by an external source, using wires, so the common solution to power these nodes is to use batteries. Even if they address the wireless operation issue, batteries have limited supplies of energy and must be replaced after they are depleted, which happens in a time interval that is much smaller than the typical lifetimes of the wireless sensor nodes they power. Replacing a battery for a WSAN can be a difficult and consequently expensive procedure, especially if the nodes are situated in hard-to-reach locations, as many of the WSN applica-tions demand.
In terms of powering a wireless sensor node, the ideal situation is having a node that is self-sufficient in terms of energy, or self-powered. This means that the node is installed in its designed operations position and is able to remain there, autonomous and unattended, during its entire lifetime. This is often re-ferred to as the place-and-forget concept, and it is made possible by energy harvesting.
13
movement of different natures like rotation, vibration or water and air flow. Energy harvesting power supplies deal with the challenge of scavenging this residual energy and making it available to the circuits they supply. Table 2.2 presents some power supply capabilities of different types of energy harvesting generators, which will be explored with greater detail in section 2.2. Having its values compared with the ones presented in Table 2.1, this table leads to the conclusion that these harvesting power supplies have typical power densities that guarantee that they can provide sufficient power to be able to supply wire-less sensor nodes, as long as the nodes and power supplies are carefully ad-justed and matched.
Table 2.2: Typical power output densities for different energy harvesting solutions
Source type Reference Typical power density [3]
Solar [4] 10 mW/cm2
Thermal [5] 1 - 10 mW/cm3
Vibration; Piezoelectric [6] 0.1 – 10 mW/cm3
Vibration, running person;
Electromagnetic [7] 0.1 – 0.8 mW/cm
3
The typical power density values for the different energy harvesting tech-niques allow comparison by stating power output in terms of volume occupied by the transducer (for the solar energy harvesting type, the power density value is given for each square centimetre of solar cell).
14
other, making comparisons difficult and inequitable. Additionally, some values represent the power output after conditioning, suffering from a reduction due to the converter’s efficiency; others are simply the power outputs of the tran s-ducers, directly connected to an optimal load. Moreover, it should be noted that for testing energy harvesting prototypes and solutions, the sources of energy are emulated in many different ways. Some authors test their prototypes with conditions that are as similar as possible to the real environments. Other au-thors prefer to optimise their energy source conditions in order to be able to maximise their prototype’s conversion efficiency. For these reasons, the calcul a-tion of each generator’s power output may be highly influenced by these diffe r-ences in the approach to the tests.
2.2
–
Energy Harvesting
Energy harvesting techniques have the goal to power small electronic de-vices, allowing them to be ever more mobile, self-sufficient in terms of power and increasingly maintenance-free. There are four main types of energy har-vesting power supplies, and they are distinguished by their source of energy, which can either be solar (or light), thermal, electromagnetic or electromechani-cal, [8].
Solar energy harvesting uses photovoltaic cells to convert solar radiation into a flow of electrons in the form of direct current. It uses the photovoltaic ef-fect, which consists in the absorption of photons by a semiconductor material that results in the increase in energy of its electrons. Given enough absorption, (superior to the band gap of the semiconductor material), these electrons transit from the valence band and become available to flow.
15
terminals of a thermoelectric device when those terminals are subjected to dif-ferent temperatures, and it is reversible, meaning that an applied voltage will create a thermal difference. It derives from the fact that different metals re-spond in distinct ways to the application of a thermal gradient, and for that rea-son create a current in a closed loop consisting of those adjacent metals. In its turn, the pyroelectric effect refers to the creation of a voltage when certain crys-talline materials are heated or cooled, which is not the same as the thermoelec-tric effect, because in this case there is no temperature gradient in the material but rather a uniform distribution of temperature, at each instant, through the whole device.
Electromagnetic energy harvesting, or radio frequency (RF) energy har-vesting, consists in scavenging the energy contained in propagating radio waves. This is possible with the use of antennas that receive these RF waves not to collect the information it carries but rather to harvest the energy it contains.
2.2.1 – Electromechanical Energy Harvesting
Different kinds of mechanical energy can also be scavenged to power small-scale devices, like the energy present in vibrations, relative movement of objects, airflow and pressure applied to certain structures, among others. This is called electromechanical energy harvesting and it is divided into three types of generators: the electromagnetic generators, the electrostatic generators and the piezoelectric generators.
16
Direct-force generators rely on mechanical contact with two structures that move relative to each other. By doing so, they apply force on a proof mass that is connected to one of the structures by a suspension with a spring behav-iour, to which a damper element containing the transducer is also attached. When the proof mass moves, the damper opposes that motion and the me-chanical energy involved is converted to electrical energy by the transducer. Figure 2.4 is a representation of the direct-force generator concept.
Figure 2.4: Direct-force Generator Diagram, adapted from [3]
In the figure, m relates to the actual proof mass, k represents the spring’s stiffness, f is the transducer, z(t) is related to the proof mass displacement and ZA is the amplitude of the inertial mass motion.
17
proof mass, but rather by the relative displacement of the proof mass in relation to the rest of the moving structure, by means of the resistance to the change in its state of motion, i.e. its inertia. Figure 2.5 shows a model of a generic inertial-force generator.
Figure 2.5: Inertial-force Generator Diagram, adapted from [3]
For this case, x(t) is the absolute motion of the proof mass and y(t) the ab-solute motion of the structure. In its turn, z(t) relates to the relative motion be-tween the proof mass and the structure.
Electromagnetic Generators
The principles that govern electromagnetic generators’ operations make use of a direct application of Faraday’s law of induction, which states that when subjected to a change in magnetic flux, a coil will have a voltage induced in its terminals. Therefore, they operate using the same principles that are in the core of large-scale electrical generators with synchronous and asynchronous ma-chines.
18
the pressing of a lever for each step, as the heel touches the ground. This ap-proach is one example of an electromagnetic generator designed to make use of direct application of force.
Two examples of electromagnetic generators that are inertial generators are the ones presented in [7] and [10]. The first is a magnetic spring generator and it is suitable for applications involving human walking or slow running. Figure 2.6 shows a conceptual model of the magnetic spring generator.
Figure 2.6: Magnetic Spring Generator Diagram, adapted from [7]
An unattached and free to move permanent magnet is placed inside a tube, with each of its magnetic poles facing one end of the tube. At each of these ends, two other permanent magnets are placed, each of them presenting a matching pole to the moving magnet, so that it is repelled by both ends. A coil is wrapped around the tube, allowing a voltage to be induced in it when the magnet moves inside, an occurrence that is provided by the magnet’s relative movement to the tube, caused by its inertia, during the movement of the tube along its own axis.
19
object or structure, the cylinder case vibrates with it, making the magnets, which are fixed to it, also move. The planar inductor, which is free to move be-tween the magnets, inertly resists the vibration and consequently exhibits movement relative to the magnets, which induces a voltage in the coil’s termi-nals. Figure 2.7 is a representation of this generator.
Figure 2.7: Resonator Electromagnetic Generator, figure taken from [10]
Electrostatic Generators
Electrostatic transducers use capacitor structures whose charged plates move in relation to one another, when subjected to movement, usually vibra-tion. This relative movement of the charged plates changes the absolute values of the electric field in the capacitor’s dielectric, thus guaranteeing energy sto r-age capabilities. The relative movement of the plates can either be the separa-tion and approximasepara-tion of the plates or the lateral relative movement of two parallel plates, both cases resulting in the variation of the volume of the dielec-tric between them.
20
forcing a flow of charge from the plates, creating a current, for the constant po-tential case.
Microelectromechanical Systems (MEMS) are very suitable for electrostatic transducer implementations, since they allow integration of the capacitor plates that can be produced at micrometre-scale dimensions. When integrated, these MEMS technology transducers can be included inside the integrated circuits they power, and are subjected to the same physical laws that govern their en-ergy harvesting concepts in a larger scale, making the integration a very inter-esting possibility for electrostatic transducers.
Piezoelectric Generators
While electromagnetic transducers explore the technical implications of Faraday’s law of induction and electrostatic transducers make extended use of the properties of mechanically variable capacitors, piezoelectric transducers rely on a property of some crystalline materials and certain ceramics, called piezoelectricity. The piezoelectric effect derives from this property, and refers to the accumulation of electrical charge in piezoelectric materials, when mechani-cal strains are applied to them. This is what makes piezoelectric materials an interesting prospect for energy harvesting purposes. The effect is reversible, meaning that a mechanical stress, i.e. movement, is generated in a piezoelectric material when an electrical field is applied to it. This is called the converse pie-zoelectric effect. Figure 2.8 shows a representation of these effects.
21
The most common piezoelectric materials used in energy harvesting gen-erators are lead zirconate titanate (PZT), barium titanate (BaTiO3) and polyvi-nylidene flouride (PVDF), [1]. PZT is commonly used in vibration energy har-vesting because it exhibits high energy conversion efficiency from mechanical to electrical forms.
Piezoelectric generators are usually included in energy harvesting solu-tions that involve vibrasolu-tions, so inertial generators are more common among piezoelectric energy harvesting systems than direct-force generators.
An example of a direct-force piezoelectric generator is developed in [11], where a piezoelectric material is placed in the heel of a shoe, inside the sole. Each time the shoe hits the floor, during the walking process, the piezoelectric material is pressed by the person’s weight, and generates electric charge that is conveniently processed and stored by the associated power circuit. The same principle of operation has been studied for inclusion of piezoelectric materials under the steps of some busy public stairways or under the pavement of some public spaces with considerable movement, in order to generate electricity.
22
Figure 2.9: Diagram of a Piezoelectric Transducer with a beam structure, figure taken from [12]
This is the chosen type of piezoelectric transducer for the energy harvest-ing system developed in this thesis. For that reason, a detailed analysis of this type of transducer, including some important equations, is presented in section 3.1.
23
transducers in terms of different vibration frequencies, matched with the regu-lated natural frequencies, but also in relation to the vibration’s acceleration, which is directly related to the amount of physical displacement of the extrem-ity of the beam that is free to move. The greater the acceleration, the greater the displacement of the tip, which results in a more substantial mechanical strain applied to each wafer. All of these considerations are very important in order to correctly design an energy harvesting system with a specific circuit to power, which in turn has its own requirements and specifications. For the three exam-ples given above, a shaker table was used in order to create the vibrations nec-essary to test the energy harvesting system prototypes. These shaker tables cre-ate vibrations with frequency and acceleration values that are defined during tests, allowing a good testing setup for the prototypes.
24
2.2.2 – Considerations regarding Energy Harvesting Applications
When designing any kind of energy harvesting generator, the target appli-cation should be considered from the beginning, not only because different ap-plications are surrounded by different environments with different kinds of re-sidual energy, but especially because the circuit that needs to be powered is the source of specific electrical requirements that need to be met.
Considering the present power output limitations of most energy harvest-ing solutions, related to the reduced residual amounts of energy that are avail-able in certain environments and the sometimes low conversion efficiencies, the target applications for which they are considered as a potential power supply are generally low-power circuits, intended to operate in an intermittent way, meaning that the circuits operate only after sufficient energy is converted and stored. The integrated circuits that are part of WSANs have been recently de-veloped in order to be less and less power-demanding, with a tendency to re-duce supply voltage and current consumption as the integrated technology gets smaller and new power-aware integrated circuit designs are developed. This development has an increasing focus on reducing energy consumption, in part motivated by the interesting prospects given by the rising development of en-ergy harvesting solutions.
25
2.3
–
Low-voltage RF Receiver
2.3.1 – Transceivers designed for Wireless Sensor Networks
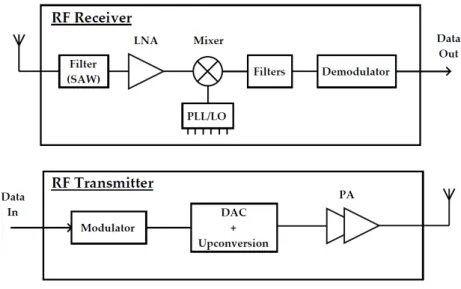
As previously stated in section 2.1, the wireless transceiver is a crucial module for a WSAN, not only because it guarantees the wireless network is created but also in terms of power consumption, since it is generally the module with the highest power consumption in the node. Figure 2.10 presents a generic architecture of a wireless transceiver used in a WSAN.
Figure 2.10: Block Diagram for a WSAN's Wireless Transceiver
e-26
ments are met. This effort leads to simpler modulation schemes, which in turn allow simpler receiver and transmitter architectures. For applications that in-volve close-range communications and low data-rates, for example, modulation schemes like the on-off keying (OOK) modulation are chosen, which employ a smaller number of electronic components and blocks. The overall reduction of the circuits’ supply voltage also plays an important role in reducing the power consumption.
In order to have a sense of the typical power consumption values of re-cently developed wireless transceivers for WSN applications, some examples of wireless transceivers are presented in Table 2.3, which contains the power con-sumption values of their receivers and transmitters, as well as the supply volt-age and modulation scheme.
Table 2.3: Examples of different WSN transceivers and correspondent power consump-tion values
Block Parameters [2] [15] [16]
Receiver
Power
con-sumption 1.8 mW 4.8 μW 0.88 mW
Supply voltage - 0.9 V 1 V
Modulation OOK OOK OOK
Transmitter
Power
con-sumption 2.3 mW 1.68 mW 2.5 mW
Supply voltage - 1 – 1.2 V 1 V
27
2.3.2 – RF Receiver to be powered by the Energy Harvesting
Sys-tem
As previously stated in the first chapter, this work’s goal is to design and simulate an energy harvesting system that is capable of converting the power output of an inertial piezoelectric transducer and supply a low-power RF re-ceiver that was part of the same multidisciplinary project, with the analysis of a prospective WSAN System on Chip (SoC) as the final goal of the joint endeav-our. For the reasons that have been explained in this chapter, especially in sec-tion 2.2.2, it is important to briefly present the main characteristics and power requirements of the RF receiver that is to be supplied by the energy harvesting system. In this section, the receiver will be briefly presented, having in mind that the most important characteristics that have to be considered are its power requirements.
Receiver’s Architecture
There are several classic RF receiver architectures with different complexi-ties and performances. However, only some of them are suited for low-power applications, namely the Low-IF and the Direct conversion architectures. The receiver under discussion is the one presented in [17], and it follows a Low-IF architecture. Figure 2.11 presents a block diagram of this kind of receiver archi-tecture.
28 Complete Receiver Circuit
The complete schematic of the receiver implementation is shown in Figure 2.12. The design includes a MOSFET-only wideband balun Low-noise Ampli-fier (LNA), which includes noise and distortion cancelling capabilities. A pas-sive mixer is also designed, intended to work in current mode. Although the design of the amplifier itself is not included, the system incorporates the tran-simpedance amplifier (TIA) module, which is essential for the current mode operation of the mixer, as explained in [17].
Figure 2.12: Complete Receiver Circuit with all transistor sizes (W/L) in μm, taken from [17]
29
Receiver’s Power Requirements
The important considerations to have in mind in order to successfully de-sign an energy harvesting power supply for this receiver circuit are directly re-lated to its power consumption and its supply voltage.
As previously stated, the intended supply voltage is 0.6 V. This means that in order to be able to supply this circuit with satisfactory results, the power supply must guarantee a 0.6 V output to be connected to the receiver’s power supply rail. Given the simplicity of the actual design and the precise optimisa-tions that were made for the receiver to be able to work at a 0.6 V supply, the power supply must be designed to deliver a 0.6 V regulated output with as little ripple or variation as possible. This is a very important and decisive require-ment, and it will be explored with more detail in the fourth chapter. This con-cern is directly related to the receiver’s low Power Supply Rejection Ratio (PSRR), which is a consequence of the design’s simplicity. For these reasons, the energy harvesting power supply’s output must be regulated with considerable precision.
Regarding the power consumption, the receiver presents a 1.95 mW value for the joint operation of the LNA and mixer. This value represents the average power consumption of these two receiver modules. It is directly calculated as the sum of the currents flowing in the two LNA’s stages, approximately 1.63 mA each, times the voltage supply. The mixer, being passive, does not contrib-ute directly to this calculation. This 1.95 mW value refers to the consumption of the designed receiver modules. However, the calculation does not include the power consumption of the TIA or the local oscillator (LO). Nonetheless, an ap-proximation of the receiver’s total power consumption had to be made, because the goal is to eventually supply an entire receiver with the energy harvesting power supply. The estimation that was made was that the entire receiver would consume approximately 10 mA from the power supply, during operation. So that was the figure taken into consideration for the dimensioning of the power supply. During operation, the receiver would request 10 mA with a 0.6 V volt-age supply, which results in an estimated power consumption of 6 mW.
30
Table 2.4: Summary of the RF Receiver’s Power Requirements
LNA + Mixer Complete Receiver
DC current 3.26 mA 10 mA
VDD 0.6 V 0.6 V
31
Energy Harvesting from Piezoelectric
vibration transducers
The main modules that constitute a piezoelectric energy harvesting power supply are presented in this chapter, including some relevant examples.
An overview of the piezoelectric energy harvesting power supply is of-fered in section 3.1. This overview introduces the system’s modules.
Section 3.2 presents the equivalent circuit of the inertial piezoelectric transducer, as well as the most important equations that model its operation.
Different types of rectifiers are presented in section 3.3, divided by the passive and active categories. The rectifier designs and correspondent equa-tions are presented, and each rectifier’s operation is modelled having the piezo-electric transducer’s equivalent circuit connected to its input.
The most important types of DC-DC converters are approached in section 3.4, giving special focus to linear regulators and offering the main concepts that govern the operation of switched capacitor converters and magnetic converters.
32
3.1
–
Piezoelectric Energy Harvesting Overview
For the case of inertial piezoelectric energy harvesting, the piezoelectric transducer converts residual mechanical energy, present in vibrations, into elec-trical signals, by means of its piezoelectric properties. These elecelec-trical signals typically consist in a varying output voltage, usually in the form of irregular voltage bursts. These are AC periodic power signals, with the same frequency as the vibration source. As previously stated in subsection 2.2.1, the ambient vi-bration’s most important characteristics are its frequency and acceleration. While the vibration frequency defines the output signal’s frequency, the vibr a-tion’s acceleration is what sets the output signal’s magnitude, often characte r-ised by the output voltage amplitude values. The piezoelectric transducer can be electrically modelled, meaning that it has an electrical model for which the internal parameter values can be changed, namely internal capacitance and im-pedance, in order to model transducers of different sizes and materials. The in-put vibration is also characterised in this model by adjusting the model’s source, most commonly a current source, in terms of frequency and amplitude.
33
rectifier’s output presents an average voltage value that varies with the input’s amplitude values, failing to guarantee a stable and constant output during volt-age amplitude variations of the unstable AC input. For these reasons, and for the fact that the load circuits need to be fed at specific and regulated voltage values, a DC-DC converter is needed after the rectifier.
The DC-DC converter is responsible for converting the DC signal coming from the rectifier’s output to a different voltage level. The converter’s output is regulated, meaning that it delivers a constant voltage output value, with mini-mum voltage ripple. The converter’s output requirements are set by the circuits that represent the energy harvesting system’s load. The target output voltage is the load’s required supply voltage, which should be as constant as possible, to ensure reliable operations. Electronic DC-DC converters used for piezoelectric energy harvesting systems may be linear regulators, switched capacitor con-verters (referred to as charge pumps), or magnetic concon-verters, which rely on in-ductors (called step-down or buck and step-up or boost).
After rectification, DC-DC conversion and voltage regulation, the energy is then stored in the energy storage device, often chosen as a supercapacitor. Supercapacitors are double-layer capacitors with high capacitance values, that can be charged and discharged faster than batteries and store much more en-ergy per unit mass than electrolytic capacitors. As previously mentioned, the load circuit is intended to operate only after enough energy is converted and stored. Typical WSAN applications present this intermittent operation.
Figure 3.1 presents a simple block diagram of a typical piezoelectric en-ergy harvesting system.
34
3.2
–
The Piezoelectric Transducer
Inertial piezoelectric transducers with a beam structure, introduced in subsection 2.2.1, are the type of transducer that is considered for the designed energy harvesting system that will be presented in the fourth chapter.
As previously stated, these transducers have a resonance frequency (also called natural frequency) that represents the optimal vibration frequency for scavenging mechanical energy contained in vibrations. This means that when the vibration to which the transducer is subjected has a frequency that is close to its resonance frequency, the power output is maximised. This resonance fre-quency is a characteristic of the piezoelectric transducer, and can be tuned by adjusting its proof (or tip) mass, as explained in [19]. From a mechanical energy conversion point of view, a transducer of this kind should have its tip mass ad-justed so that its natural frequency matches the typical predicted vibrations fre-quencies to which it will be exposed in its destined environment.
If the piezoelectric transducer vibrates at a frequency that is close to its resonance frequency, the piezoelectric wafer can be modelled by its equivalent circuit, shown in Figure 3.2, where is the AC current source, Ci the
trans-ducer’s equivalent internal capacitor, Ri the internal resistance and the open circuit voltage at the transducer’s output, [20, 21].
35
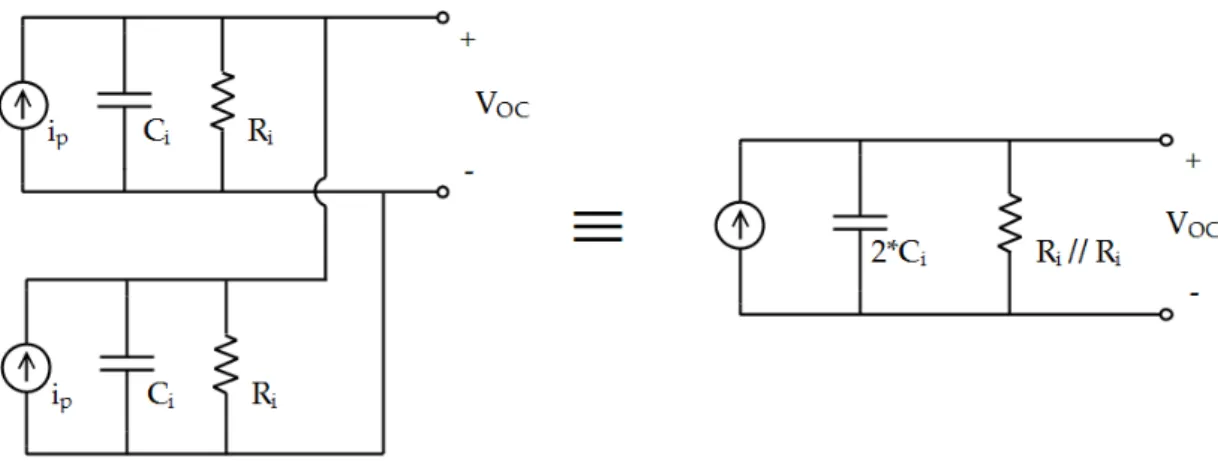
The equivalent circuit presented above refers to a single piezoelectric wa-fer. As discussed in the previous chapter, some beam structured piezoelectric transducers have two identical piezoelectric wafers, one for each surface of the beam. These wafers have two terminals each, which is why some specific trans-ducers, namely the ones detailed in the datasheet for the Midé Volture™ piez o-electric transducers family, [19], have four o-electrical leads. This accessibility to each of the two independent wafers allows two different connections: in paral-lel, in order to maximise current output, and in series, which maximises voltage output. The equivalent circuit for each of these configurations is given by the parallel or series connection of two of the single wafer equivalent circuits. A parallel configuration, chosen for maximum current output, was experimentally tested in [22], a work that is part of this thesis’ contributions. The piezoelectric transducer used for the experimental validation in the referred work was the piezoelectric energy harvester Midé Volture™ V21BL, presented in Figure 3.3.
36
The parallel equivalent circuit used in [22] is presented in Figure 3.4.
Figure 3.4: Equivalent Circuit of a parallel configuration for a two-wafer piezoelectric transducer
The piezoelectric transducer presented above was a reference for the pre-sent work, as well as some of the devices included in its transducer family. The most important details regarding these devices that must be retrieved from their datasheet are their electrical characteristics and power output levels.
The internal characteristics of the piezoelectric transducer are modelled by the internal capacitance and resistance values. The AC current source generates a sine wave with the vibration’s frequency and peak current values that are proportional to the vibration’s amplitude, also called tip-to-tip displacement, which translates into how much the beam bends during vibration, a measure directly related to the vibration’s acceleration. Equation (3.1) models the trans-ducer’s sinusoidal current source , where is the current source amplitude and , with as the vibration’s frequency in hertz, [20].
37
The open-circuit voltage of the piezoelectric transducer can be calculated by (3.2), ignoring the internal resistance, [21].
(3.2)
The internal capacitance and resistance values are usually measured by the transducer’s manufacturer for different resonance frequencies. These elec-trical characteristics are therefore available in the transducer’s datasheet, as well as the correspondence between different tip mass values and resonance fre-quencies, making it possible to tune the transducer for different frequencies by adjusting the tip mass. For each relevant resonance frequency chosen by the manufacturer, different vibration acceleration values are also tested, in order to provide a series of measured outputs of the transducer for each set of vibration conditions. These outputs are often given in terms of open circuit voltage, which is why the Thevenin equivalent version of the circuit presented in Figure 3.4 is used in this work for simulation purposes. This circuit consists of a sinu-soidal voltage source in series with the parallel of the internal capacitance and resistance.
38
3.3
–
Rectifiers
3.3.1 – Passive Rectifiers
Full-Bridge Rectifier
The full-bridge rectifier is a full-wave rectifier, meaning that the whole AC
input waveform is converted to a constant polarity waveform at the output. The four diode bridge configuration allows this rectifier to deliver the same output polarity during both the positive and the negative halves of the AC wave. For the output to maintain a relatively constant value that does not drop to zero every half cycle, a capacitor is added to smooth the output signal. This capacitor should have a considerably high capacitance value in relation to the internal capacitance of the piezoelectric equivalent circuit, in order to be able to keep the output voltage of the rectifier as constant as possible. Figure 3.5 presents the schematic for this rectifier, including the piezoelectric transducer’s equivalent circuit, the actual diode bridge and the smoothing capacitor, , [21, 23, 24]. The piezoelectric transducer’s output voltage will be named , even though it does not correspond to an open circuit voltage.
39
For positive half waves at the AC input, diodes D1 and D2 are conducting, and the other two diodes conduct for negative half waves. Since non-ideal di-odes have turn-on voltages that are not zero, there is a voltage drop at each conducting diode. This fact limits the rectified output voltage, which conse-quently reduces the power efficiency of the rectifier.
In order to simplify the output power analysis of a full-bridge rectifier connected to a piezoelectric transducer, the internal resistance of the transducer, represented as Ri in the equivalent circuit, shall not be considered.
The predicted voltage and current waveforms for this rectifier are pre-sented in Figure 3.6, including the sine wave current at the transducer’s cu r-rent source and the voltage across the transducer’s internal capacitor Ci, which
corresponds to the voltage waveform at the rectifier’s input. This prediction in-cludes diode non-idealities, meaning that each diode presents a voltage drop of
when conducting, and it is valid when considering that the capacitance value is much higher than the Ci capacitance value.
Figure 3.6: Predicted Input current and voltage waveforms for the Full-Bridge rectifier, adapted from [25]
40
given by Equation (3.3) and is the integral of over a cycle’s time interval. This time interval corresponds to the period of the sine wave, given by . Equation (3.3) and subsequent equations are derived and presented in [25].
(3.3)
The charge lost per cycle is given by Equation (3.4). This equation is a re-sult of the fact that the internal capacitor Ci is charged (and discharged) twice per cycle. For the positive half wave, the capacitor is charged from to , with this charging process represented with a shaded area under the posi-tive half wave of the waveform represented in Figure 3.6. In the negative half wave, the capacitor is charged from to .
(3.4)
The amount of charge that flows to the rectifier’s output for each cycle is therefore given by
(3.5)
The energy delivered to the capacitor at the rectifier’s output, , per cy-cle, is the charge delivered times the rectifier’s output voltage, as in
(3.6)
41
time duration of each cycle is the cycle’s period, , the power delivered by the full-bridge rectifier is given by
(3.7)
The output power is maximised when , which results in
(3.8)
Considering non-ideal diodes, with a voltage drop of , the power output of the full-bridge rectifier is given by Equation (3.9). This equation considers that the Ci capacitor is charged up to , as depicted in Figure 3.6.
42 Voltage Doubler Rectifier
Figure 3.7 presents the voltage doubler rectifier circuit connected to the piezoelectric transducer’s equivalent circuit and the smoothing capacitor, , [21, 26].
Figure 3.7: Voltage Doubler Rectifier
43
Figure 3.8: Predicted input current and voltage waveforms for the voltage doubler rectifier, adapted from [25]
As it happens for the full-bridge rectifier, some charge is lost in this case and does not reach the rectifier’s output. For the negative half waves there is no charge flowing to the output, as is depicted in Figure 3.8 in the shaded areas. In the positive half waves, charge flows to the output only after the charging of the internal capacitor is finished. For simplicity, ideal diodes will be considered for this initial approach, which means that the internal capacitor Ci is charged from 0 V to and vice versa. The charge delivered to the rectifier by the trans-ducer for each cycle is the same as in the full-bridge rectifier case, Equation (3.3), but the lost charge is different, and is given by
(3.10)
The amount of charge delivered to the rectifier’s output, for each cycle, is given by
(3.11)
44
(3.12)
This power output is maximised for , which leads to a maxi-mum power output that is the same as the one reached for the full-bridge recti-fier, given by Equation (3.8).
If non-ideal diodes are considered, some additional charge is lost every cycle, since the internal capacitor must be charged from to , and the other way around. This consideration leads to an alteration in Equation (3.10), which in turn results in a new power output equation,
(3.13)
45
3.3.2 – Active Rectifiers
Switch-Only Rectifier
Given the characteristics of the piezoelectric transducer, the full-bridge and the voltage doubler rectifiers cannot overcome the problem associated with the loss in charge that is a consequence of the charging and discharging of the capacitor, for each half-cycle of the AC input signal. The problem relates to the fact that as the source changes polarity, the internal capacitor is charged with alternate polarities for each half-cycle. As a consequence, at the beginning of each of these half-cycles the capacitor must be discharged to 0 V before it is charged according to the new polarity.
As a relatively simple solution for this problem, the switch-only rectifier is proposed in [21]. Figure 3.9 presents the schematic.
Figure 3.9: Switch-only Rectifier, [21]
46
The inclusion of the switch is a response to the loss of charge problem as-sociated with the passive rectifiers presented above. By turning on the switch every time the current crosses zero, for a very short period of time in com-parison with the whole cycle duration, the output of the piezoelectric trans-ducer is momentarily short-circuited. This causes the internal capacitor to dis-charge completely, after which the switch is turned off. For the subsequent half-cycle, the current coming from the source only has to charge the internal capaci-tor from 0 V to , not having to waste charge to discharge the ca-pacitor, a situation that is similar to what happens during the voltage doubler rectifier’s positive half-wave. Figure 3.10 shows the relevant current and volt-age waveforms for this process.
Figure 3.10: Relevant current and voltage waveforms related to the Switch-only rectifier's operation, adapted from [21]
Provided that the switch is driven in the desired way, the charge that does not flow to the output in each cycle corresponds to the wasted or lost charge, given by Equation (3.14), for which ideal diodes are considered.
47
The charge that flows to the output each cycle is given by Equation (3.15), which presents the difference between the total available charge delivered by the transducer’s source and the lost charge, as for the previous rectifiers.
(3.15)
The product of the output voltage, , the delivered charge, , and the source frequency, , is the power delivered to the rectifier’s output, given by
(3.16)
This power output is doubled in relation to the voltage doubler rectifier power output, as can be concluded by comparing equations (3.16) and (3.12). The maximum power output is achieved with , like for the voltage doubler, giving a maximum power output given by (3.17), which is twice the maximum power output that can be delivered by the full-bridge rectifier and the voltage doubler, as can be concluded by comparing this equation with (3.8).
(3.17)
For the case of non-ideal diodes, with a turn-on voltage drop of , the power output of the rectifier is given by (3.18).
![Figure 2.5: Inertial-force Generator Diagram, adapted from [3]](https://thumb-eu.123doks.com/thumbv2/123dok_br/16576415.738295/35.892.269.666.274.541/figure-inertial-force-generator-diagram-adapted.webp)
![Figure 2.7: Resonator Electromagnetic Generator, figure taken from [10]](https://thumb-eu.123doks.com/thumbv2/123dok_br/16576415.738295/37.892.202.736.343.570/figure-resonator-electromagnetic-generator-figure-taken.webp)
![Figure 2.12: Complete Receiver Circuit with all transistor sizes (W/L) in μm, taken from [17]](https://thumb-eu.123doks.com/thumbv2/123dok_br/16576415.738295/46.892.94.762.428.667/figure-complete-receiver-circuit-transistor-sizes-μm-taken.webp)

![Figure 3.7 presents the voltage doubler rectifier circuit connected to the piezoelectric transducer’s equivalent circuit and the smoothing capacitor, , [21, 26]](https://thumb-eu.123doks.com/thumbv2/123dok_br/16576415.738295/60.892.132.731.285.517/presents-rectifier-connected-piezoelectric-transducer-equivalent-smoothing-capacitor.webp)
![Figure 3.9: Switch-only Rectifier, [21]](https://thumb-eu.123doks.com/thumbv2/123dok_br/16576415.738295/63.892.167.783.610.841/figure-switch-only-rectifier.webp)
![Figure 3.10: Relevant current and voltage waveforms related to the Switch-only rectifier's operation, adapted from [21]](https://thumb-eu.123doks.com/thumbv2/123dok_br/16576415.738295/64.892.257.596.515.767/figure-relevant-current-voltage-waveforms-related-rectifier-operation.webp)