Abstract
Structural Health Monitoring (SHM) of Tension Leg Platform (TLP) is very crucial for preventing catastrophic and sudden collapse of the structures. One of the methods of monitoring these structures is implementing SHM sensors. Supplying energy for these sensors for a long period is a challenging problem. So, one of the new methods of supplying energy for SHM, is usage of me-chanical energy. In this method, the piezoelectric material is em-ployed to convert the mechanical energy which is resulted from vibration of structure, to electrical energy. The advantage of this method is based on not implementing the battery charging system. Therefore, in this paper, after modeling TLP structure, energy supplying of these sensors with piezoelectric converters is studied. Furthermore, fault diagnosis of these structures in the presence of different uncertainties is proposed by the features of voltage sig-nal, produced from piezoelectric patches and fuzzy classification method. Results show that this method can diagnose faults of the structure with an acceptable success rate.
Keywords
Structural Health Monitoring; Vibration; Energy Harvesting; TLP.
TLP Structural Health Monitoring Based on Vibration
Signal of Energy Harvesting System
1 INTRODUCTION
Oil platforms are a type of offshore structures which are used in the oil industry in the case of ex-ploration, storage and production of oil. These structures are divided into two types of fixed and
Vahid Jahangiri a Hadi Mirab b Reza Fathi c
Mir Mohammad Ettefagh d *
a M.Sc. Student, Faculty of Mechanical Engineering, University of Tabriz, 5166616471, Tabriz, Iran
b M.Sc. Student, Faculty of Mechanical Engineering, University of Tabriz, 5166616471, Tabriz, Iran
c Ph.D. Student, Faculty of Mechanical Engineering, University of Tabriz, 5166616471, Tabriz, Iran
d Associate Professor, Faculty of Mechan-ical Engineering, University of Tabriz, 5166616471, Tabriz, Iran
[email protected] (Corresponding Author)
http://dx.doi.org/10.1590/1679-78252282
floating structures. The demand of exploration oil in deeper oceans has made floating structures more popular. An example of floating oil platforms which is considered in this paper is Tension Leg Platform (TLP). TLP structures are affected by wave and wind forces which can also affect reliabil-ity of these structures. Furthermore, stabilreliabil-ity of TLP structures is highly dependent on tendons. Many studies are done about modeling TLP structures. Adrezin et al (1996) reviewed the dynamic response of compliant towers. Yigit and Chrostoforou (1996) studied the coupled vibration of the oil well drill strings in compression and also they solved the equations of motion by using the assumed model method. Furthermore, they concluded that the coupled model at a lower load yields an un-stable behavior in comparison of the uncoupled model. Han and Benaroya (2002) modeled a vertical member of compliant offshore structure as a beam which is undergoing bending and extension. Also the beam has a point mass and is subjected to an axial load at the free end. Additionally, they compared linear and non-linear responses and they showed that the transverse response of the linear model is as good as the non-linear coupled models and also they noticed that for the axial vibration response, the non-linear coupled method is more suitable. Patel and Park (1991) studied the com-bined axial and transverse response of tethers of a tensioned buoyant platform. Moreover, they con-cluded that the combined excitation gives greater amplitude of vibration. By using Hamilton's vari-ational principle, Gadagi and Benaroya (2006) derived a set of non-linear equations of motion for a coupled axial and transverse vibration of a tether subjected to end tension. Furthermore, they ana-lyzed the effect of tension on the dynamic behavior of structure and it was observed that, by in-creasing the axial force frequency, only the axial response is influenced, and the transverse response remains similar. Goo et al (2007) described a numerical method for predicting structural response of a flexible TLP which is subjected to the wave forces, and also they compared numerical results with the experimental ones. Rudman and Clearly (2013) studied the effect of wave impact angle on the platform motion and also they determined how pre-tension modifies motion of the platform and behavior of mooring lines. Additionally, they concluded that the wave angle has a little impact on the broad nature of the platform dynamics and the maximum tension in mooring cables is highly dependent on impact angle. Taflanidis et al (2013) determined dynamic response of the platform, by considering the uncertainties related to the excitation characteristics such as significant wave height or uncertainties related to the TLP model properties such as, Young module of tendons and they concluded that uncertainties related to excitation characteristics are the dominant risk factors. Sengupta and Ahmad (1996) studied reliability of the TLP structure with respect to the maximum and minimum tendon stress under stochastic excitation, they also determined the optimum strength of tethers for the maximum expected life of the platform. Kim and Yang (2010) studied the transi-ent effect of tendon disconnection on the performance of the TLP during harsh environmtransi-ental con-ditions and they observed that heave and pitch natural periods are affected by the tendon breakage.
impulse and relaxation methods are highly effective in detection of structural damages. Mojtahedi et al (2011) investigated a work on an experimental laboratory model of a jacket platform in the case of health monitoring this type of structures. They also conducted experimental vibration tests on a platform model to obtain dynamic characteristics and compared it with the initial FE-model of the undamaged structure. They observed that the technique is effective for damage diagnosing. Malekzehtab and Golafshani (2013) investigated the application of finite element model in damage detection of a jacket platform, where the objective function of this method includes natural frequen-cy and mode shapes. Furthermore, they concluded that, this method can detect the damage accept-ably even if the data are not accurately obtained. An alternative way for structural health monitor-ing, is implementing the wireless sensors. However, supplying energy of these sensors is undesirable due to some reasons such as: the batteries are bulky and they have a limited life. Recently, pro-gresses in compact circuit technologies like sensors and wireless systems have made it possible to use autonomous systems. These systems do not need an independent source for supplying energy and they can obtain it from environmental energy sources such as solar energy, wind energy and thermal gradients, Nagayama et al (2010), Park et al (2010), Farinholt et al (2010). But, each of the mentioned environmental resources has their own problems. In this regard, researchers proposed new methods for supplying energy such as using the implemented piezoelectric material in order to convert mechanical energy to electrical energy. Taylor et al (2001) designed a harvesting energy system which uses piezoelectric polymers to convert the mechanical flow energy, available in rivers to electrical power. Murray and Rastegar (2009) presented a new two stage electrical energy genera-tor to buoyant structures. The generagenera-tors used the buoy’s interaction with the sea waves as a low speed input to an initial system, thus this work excites an array of vibratory elements (secondary system) into resonance and harvesting energy from piezoelectric elements. The advantage of this system is that, by having two decoupled systems, the low frequency and varying buoy movement are changed to constant frequency or extremely higher frequency mechanical vibration. Wang et al (2014) considered a sea wave energy harvester from longitudinal wave motion of water particles. Also they studied the effect of harvester and wave parameters on output electrical power generated from piezoelectric energy harvester according to the Airy linear wave theory. Mirab et al (2015) investigated energy harvesting from sea waves with consideration of Airy and JONSWAP theory. Also they optimized parameters of energy harvester by simulated annealing algorithm.
By reviewing former studies it can be noted that, harvesting energy from TLP in the case of preparing the energy for health monitoring of these structures has not been studied up to now. In this paper, TLP is modeled as a vertical beam and the governing equations of the TLP are derived. For energy harvesting, the piezoelectric patches are attached to the beam. Also, the effects of TLP's parameters on the output energy have been investigated. As know the uncertainties play an im-portant role on the vibration responses of system. Therefore, the uncertainties related to wave char-acteristics and TLP model properties are considered and determined by uniform distribution of random numbers. Finally, fault diagnosis of the system is determined by using the fuzzy classifica-tion method and output voltage. For this purpose, at first some damages are applied to the struc-ture and by using fuzzy classification method, location and intensity of the damage is determined.
1. Furthermore the Airy wave theory is introduced and explained. Also, the output power is deter-mined from the vibration response. In Section 3, the fault diagnosis discussions of the TLP struc-ture and also the fuzzy classification method are explained concisely. Section 4 includes the simula-tion of the structure which is done by Matlab software and results of the simulasimula-tion are introduced in this section. Finally the conclusions are presented and discussed in section 5.
2 VIBRATION EQUATION OF TLP MODEL UNDER EXCITATION OF SEA WAVES
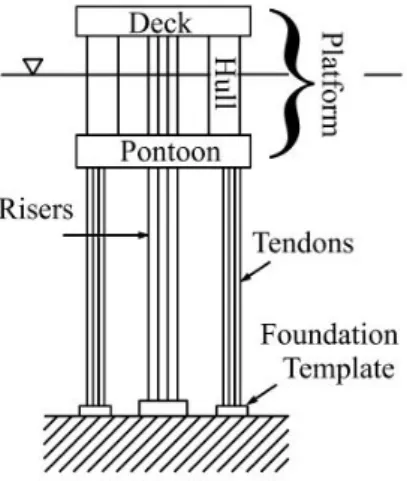
A TLP structure which includes, deck, hull, pontoon, risers, tendons and foundation template is shown schematically in figure.1. In the case of studying vibrational behavior of this structure under excitation of sea waves, TLP structure is modeled as figure.2. Deck, hull and pontoon which are called platform of the structure is modeled by a point mass, also risers and tendons are modeled. Moreover, the joint at the ocean floor is modeled by a torsional spring.
Figure 1:Schematics of offshore structures (Han and Benaroya, 2002).
For deriving equation of beam, transverse motion of the beam is introduced as follow (Han and Benaroya 2002):
2 2 4 4
0
2 2 2 2 4
( , ) ( , ) ( , ) ( , )
( , )
H
v x t v x t v x t v x t
A N I EI f x t
t x x t x
r ¶ - ¶ -r ¶ + ¶ =
¶ ¶ ¶ ¶ ¶ (1)
Where N0is the axial force applied to the beam, EI is the bending rigidity, A is the cross section
area of the beam, r is the density of the beam, v x t( , ) is the longitudinal displacement of the beam
at position z and fH( , )x t is the force resulted from sea waves.
The axial force is calculated by Eq. (2) and the horizontal force resulted from sea waves,
( , )
H
f x t , is defined by Morison equation which is shown in Eq. (3) (Morison et al, 1950).
0 w submerged p
N = rV g-M g (2)
2 2
1
( , ) (2 )
2
H D w out y y M w y m w
v v v
f x t c r u u c Aa c A
t t t
r æç ¶ ö÷ ¶ r r 
= çç - ÷÷÷ - +
-è ¶ ø ¶ ¶ (3)
Where cD, cM and cm are the coefficient of the drag, and inertia forces of the beam and the added mass respectively, rw is density of sea water, rout is the outer radius of beam, uy and ay are the
longitudinal velocity and acceleration of the water particles in the sea respectively, Mpis the point
mass, Vsubmergedis the submerged volume and g is the gravity of Earth. In this paper Airy wave
theory is used to determine velocity and acceleration presented in Morison equation.
2.1 Airy Wave Theory
Airy wave theory which is also known as small amplitude wave theory or sinusoidal shaped wave theory, is the simplest description of the regular surface waves. In this theory it is assumed that, sinusoidal shaped waves and amplitude of waves are smaller in comparison of wavelength and water depth. According to this theory the surface elevation, horizontal velocity and acceleration of water particles are computed from Eqs. (4) to (6)(Ramachandran et al).
( , ) cos 2
H
y t ky t
(4)
cosh ( )
cos( )
sinh
y
k x d H
u ky t
T kd
p + w¢
= ´ - (5)
2 2
cosh ( )
2
sin( )
sinh
y
k x d H
a ky t
kd T
p + w¢
= ´ - (6)
Where H, T,k and w¢are wave height, time period of wave, wave number and angular wave
2
2
, gktanh( )kd
T
p
w¢= w¢ = (7)
By assuming that longitudinal velocity of water particles are much bigger than longitudinal ve-locity of beam uy w
t
¶ >>
¶ , at (x =0) Eq. (3) is changed to Eq. (8) form:
( )
221
( , ) (2 )
2
H D w out y y M w y m w
v
f x t c r u u c Aa c A
t
r r r 
= +
-¶ (8)
By simplifying Eq. (8), it is changed to Eq. (9):
(
)
21 2 3 2
( , ) ( ) cos t cos t ( )sin t
H
v
f x t k x k x k
t
w¢ w¢ w¢ 
= -
-¶ (9)
Where
2 2 2
1 2 2
1 cosh ( )
( )
2 D sinh
H k x d
k x c b
T kd p r + = , 2 2 2
2 cosh ( )
( )
sinh
M
H k x d
k x c bh
kd T
p
r +
=
and k3 =cmrbh.
2.2 Vibration Response and Output Power
By having the force magnitude applied to the energy harvester, response of Eq. (1) can be deter-mined by applying mode summation and variable separation method, as it can be seen from Eq. (10):
3 1
( , ) i( )q (t)i
i
v x t V x
=
=
å
(10)Where V x( ) is the shape mode function and q t( )is the response in the time domain. Mode function
for transverse vibration of the beam is expressed as:
1 2 3 4
( ) sin cos sinh cosh
V x =d ax +d ax +d bx +d bx (11)
Where a b, are determined by Eq. (12) as follow:
(
)
(
)
(
)
(
)
2
2 2 2
0 0
2
2 2 2
0 0
4
2
4
2
I N I N EI A
EI
I N I N EI A
EI
r w r w r w
a
r w r w r w
b - + - + = - - + - + = (12)
Also, d1,2,3,4 coefficients are computed by boundary conditions which are introduced in Eq. (13)
bending moment of the beam is zero at the free point. In addition, the shear force of the beam is equal to inertial force of the point mass).
2 2 3 2 2 0 3 2 2 ( ) 0 ( ) ( ) ( ) (x)
( ) 0
0 ( ) ( )
. :
P
d W z EI
dz x L
d W z dV x dV x
EI M V I N
dx dx
B dz
V x
x d V x dV x
EI k
dx dx
C
w r w
ì ì ï ï ï ï ï ï ï ïï ïï í ï ï ï ï = = + + -= = ï ï ï ï ï ïî ïí ìï ï ï ï ï ï ï ï í ï ï ï ï ï ï ï ïî î = ïï ïï (13)
By consideration of the mentioned boundary conditions, Eq. (13) is determined as:
2 2 2 2
1
1 2 3 4 2
3
2 2
4
sin cos sinh cosh 0
0
0 1 0 1 0
0
EI L EI L EI L EI L d
d d d
k EI k EI
a a a a b b b b
a a b b
é- - ù é ù é ù
ê ú ê ú ê ú
ê Q Q Q Q ú ê ú ê ú
ê ú ê ú = ê ú
êê ú ê ú ê ú
ú ê ú ê ú
ê ú ê ú ê ú
ê - - - úê úë û ê úë û
ë û
(14)
Where
3 2 2
1 EIa cosaL r w aI cosaL N0acosaL w MPsinaL
Q = - + - +
3 2 2
2 EIa sinaL r w aI sinaL N0asinaL w MPcosaL
Q = - + +
3 2 2
3 EIb coshbL r w bI coshbL N0bcoshbL w MP sinhbL
Q = + - +
3 2 2
4 EIb sinhbL r w bI sinhbL N0bsinhbL w MPcoshbL
Q = + - +
In order to solve Eq. (14), determinant of coefficient matrix should be zero.
Character equation of system is determined and the roots of the equation are the natural fre-quencies of the system. q ti( ) for the Airy wave theory is determined as follow:
(
)
( )
(
)
( )
1 2
1 2
cos 2 sin cos 0
( )
cos 2 sin cos 0
1, 2, 3
i i
i
i i
G t G t t
q
i t
G t G t t
w w w
w w w
ìïï íï < ï ¢ ¢ î = ¢ - ³ = ¢ ¢ ¢
- - (15)
Where Gi1 and Gi2 are introduced as:
(
)
0
1 2 1
2 1 2
0
2 2 2 2
1 2
1
( )
2 ( 2 )
1 ( ) ( ) i i d i i i i
i i d
G k x V dx
H H
G k x V dx
2 1 0 2 3 ( ) L i i
H V x dx
H k rA
=
= +
ò
(17)In the case of harvesting energy, piezoelectric patches are attached to the beam. Patches are vi-brated due to the sea waves and electrical power is generated because of the dynamical strain in the piezoelectric layers. With knowing the displacement function of the beam affected by the wave force, the electrical charge and voltage produced by piezoelectric patches in time is described in Eqs.(18) and (19)(Lee and Moon, 1990).
1 31
( . ) (( 1). )
2 r ( , ) ( , )
( ) (2 r )
2 x
pp out
g ou
d pp a x p a t
d p
h v x t v x t
Q t e
x =- + x =- +
-æ ö
æ + ö÷ ç ÷
ç ÷ ç ÷
= - çççè ÷÷´ççç ÷÷÷
ø è ø
¶ 
-¶ ¶ (18)
( 1
3
. ) (( 1) )
1
.
( ) 2 r ( , ) ( , )
( )
2 x d p
pp
p a x d p g
pp out
g
v v p a
Q t h v x t v x t
V t e
c c x =- + x =- +
-¶ -
æ ö
æ + ö÷ ç ÷
ç ÷ ç ÷
= = - ççç ¢ ÷÷´çç ÷÷
ç 
è ¶ ø÷
è ø (19)
Where e31, h1, cv¢, a and N are piezoelectric coefficient, thickness, electrical capacity per unit
weight, length and number of the patches respectively. The generated output power in time t , can
be written as:
1 ( ) ( ) ( ) i N g i g i dQ t
Pe t V t
dt
=
=
å
(20)Finally, the average value of output power is calculated from Eq. (21) where T¢ is the total time. 2 0 1 ( ) T rms
Pe Pe t dt
T
¢
é ù
= ë û
¢
ò
(21)3 FAILURE DIAGNOSIS WITH FUZZY CLASSIFICATION METHOD
Fuzzy logic is a unique soft computing method which handles numerical data and linguistic knowledge at the same time, and basis of this logic is fuzzy set. Membership of this set is deter-mined by membership function (m( )x ) which can have a value between zero to one. The most common forms of membership functions are triangle, trapezoidal and Gaussian form. Selection of function shape is related to user's experience. It should be noted that, these functions can overlap with each other and usually, these forms are normalized between zero to one. Fuzzy systems are based on mapping of feature vector (for input) into a scalar value (for output) (Kosko, 1997).
A fuzzy system typically includes multiple inputs (V ÎRm ) in a format of vector with
dimen-sion of (number of input variables) and one output (W ÎR ), and the mapping from input to
defuzzifier. Rules can be obtained by expert users or specific numerical data. In both cases, rules are expressed as a collection of IF-THEN statements, for example:
1 2
u u v
IF is HIGH and is LOW THEN is LOW
To formulate these rules, it is essential to consider the following:
Defining equivalent numerical values for linguistic variables, for example: o o
3.5 for HIGH.
Quantifying linguistic variables with membership functions.
Logical connections between linguistic variables.
Understanding how to combine more than one rule.
Fuzzifier, maps crisp input to fuzzy sets. This includes the activation of these laws, numerically inference engine maps the fuzzy sets related to input to fuzzy sets related to output by determining the combination of fuzzy sets. In this paper, these rules are considered at first:
M
i
R : 1 1 2 2 ...
1, 2, 3,...,
m m i
IF x is F AND x is F AND x is F THEN y C i
=
= (22)
Where y and xi are the input and output variables, m and M are the number of input variables
and rules respectively. Fi ÎVi and Ci ÎW are fuzzy sets characterized by membership functions
i F( )x m and
i C ( )y
m respectively. Therefore, each rule can be expressed as a fuzzy implication:
1,2,..,m 1 2 ... m i
F =F ´F ´ F C
Where F1,2,..,m is a fuzzy set in V W´ = ´ ´ ´V1 V2 ... Vm´W with membership function as follow:
2
1 2
( , ) ( ) * ( ) * ... * ( ) * ( )
i i m i
R x y F x F x F xm C y
m =m m m m (23)
In the latest equation, * can be considered as a minimizer or product operator. The algebraic
prod-uct is more commonly used and maps fuzzy sets of inputs into crisp values.
Most of the defuzzification methods in engineering field include maximum matching and cen-troid defuzzification which is used for control problems and pattern matching problems respectively. Fuzzy classification which has been described by fuzzy logics in this paper will be explained in ap-plication form. First of all it should be noted that, in classification problem, output set is considered as crisp set and it only shows the number of class for undamaged system. Hence in Eq. (23) we should have (Chandrashekhar and Ganguli, 2009):
i C ( )y 1
m = (24)
Suppose that, there are M fuzzy rules in a fuzzy system to produce class Cj (j =1,2,...,M)
related to Fi are considered as Gaussian membership function. Thus, the average value and vari-ance of each Gaussian membership functions are considered equal to average value and varivari-ance of resulting features. Before the classification, parameters of Gaussian distribution should be adjusted and this is called training part in fuzzy classification method. Inference and defuzzification stages will be introduced in next part which can specify class number. Assume Di is the measurements of the antecedent conditions of the ith rule, which is expressed as follow:
, 1
m i l i
l
D m
=
=
(25)Where m is the number of inputs and ml i, is the degree of membership of parameter l in the fuzzy
region that the ith rule occupies. Dmax(Ci*) (Maximum matching degree of the rules generating
class C*
i ) is described as follow:
C*
max( i ) maxi i
D = D (26)
Where i* is the crisp output which is equal to number of class related to C *
i .
In this paper, fuzzy classification is trained with simulated data of structure in order to diag-nose faults. Hence, for input data of fuzzy sets of structure's each condition, Gaussian membership function is used and is described as:
2 -0.5(( -m)/ )
1
(x)= e
2
w s
m
ps (27)
Where m is the mean value and σ is the standard deviation of the specific class which is an im-portant stage for fuzzy classification system. In other words, by modeling the structure in damaged and undamaged condition, response of the structure is determined and appropriate features of this response are assumed as input for fuzzy system. Then, average and variance values of these features are calculated and membership functions of these features are defined in each class. Simulation steps will be described in next part.
4 SIMULATION AND RESULTS
Parameter name Symbol Value
beam length L(m) 415
inertial coefficient of beam cM 1.7
drag coefficient of beam cD 0.8
Inertial coefficient of added
mass cm 1
Density of beam 2
kg m
( )
r 7800
Young module of beam E(Gpa) 204
Torsional spring stiffness K(N. m/ rad) 160000
0
Inner ratio of the beam rin( )m 0.173
Outer ratio of beam rout( )m 0.4
Point mass M kgp( ) 1.01e7
Table1: Properties of the beam.
Parameter name Symbol
Val-ue Electrical capacity of patches cv(nF) 0.75
Piezoelectric constant e31(cm2) -2.8 Piezoelectric patches
thick-ness h m1( ) 0.001
Piezoelectric patches length a m( ) 0.3
Table2: Properties of the piezoelectric patches.
Parameter name Symbol
Val-ue
Sea depth d(m) 415
Wave height H(m) 2
Wave period T(s) 5
Sea water densi-ty
2
(kg m )
w
r 1025
Table 3: properties of sea.
Figure 3: Vibrational Response of beam's point mass in the time domain for parameters of Table 1.
Figure 4: Power Spectral Density (PSD) of the beam for parameters of Table 1.
( )
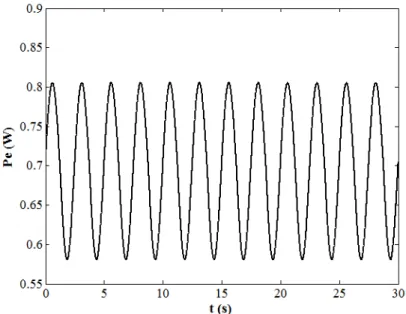
Figure 5: Generated power with piezoelectric patches for parameters of Tables 1 and 2.
The effects of the point mass and wave height on the root mean square of the generated electri-cal power is illustrated in figure 6. As it can be seen from this figure, by increasing wave height and point mass, the value of the root mean square of the generated electricity power increases.
Figure 6: Effects of point mass and wave height on the root mean square of the generated electrical power.
After studying the energy harvesting with implementation of piezoelectric materials, fault diag-nosis of the system is studied by the produced voltage and the fuzzy logic method.
u d
u
-D = w w 100
w ´ (28)
Where w is the specific feature, u and d describe the undamaged and damaged condition of the structure. Moreover, to obtain the specific features, power spectrum density is applied to output voltage signal, which is created by piezoelectric patches and finally the resulted frequencies of the signal in frequency domain are chosen as the features. Additionally, faults of the torsional spring stiffness and Young module of the beam are simulated by a reduced value of 10, 20, 30 percentage. These faults are classified such that a 10%, 20% and 30% damages are called slight damage, moder-ate damage and severe damage respectively. The input set of fuzzy logic is the calculmoder-ated features of the structure (x) and the condition of structure (y=F(x)) is the output, which is defined as:
{
1 2 3 4}
( )
Undamaged Slight damage in stiffness Moderate damage in stiffness Severe damage in stiffness Slight damage in Young module Moderate damage in Young module
Severe damage in Young module
y F x
x
y
w w w w
= = ìï = í üï ï ï ï ï ï ï ï ï ï ï ï ï ï ï ï ï ï ï ï ïý ï ï ï ï ï ï ï ï ï ï ï ï ï ï ï ï ï ï ï ï ï ï î þ (29)
As it can be noticed from Eq. (29), there are seven classes related to condition of the structure. The output of the classification method is a number which shows the number of the class. Moreo-ver, uncertainties are considered in this method. Thus, uncertainties in Young module, second mo-ment of inertia, inner and outer radius of the beam, stiffness of torsional spring, wave period and the point mass of the model are considered. Uncertainties are determined by uniform distribution of random numbers in the range of maximum and minimum value of the uncertain parameters as fol-low:
max min min
(( ) )
P = P -P ´rand +P (30)
Where Pmin and Pmax are the minimum and maximum uncertainty of the parameter and rand is
the uniform random number. Pmin and Pmax are described in Eq. (31) and P0 is the normal value of the parameter. Also the uncertainty value is equal to 3% for all parameters.
min 0 0
max 0 0
0.03 0.03
P P P
P P P
=
-= + (31)
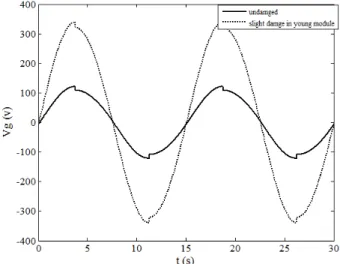
and 8 illustrate the damage with 10% reduction of Young module and torsional spring stiffness re-spectively, which is also compared with the undamaged condition.
Figure 7: Effect of 10% damage of Young module on electrical voltage signal and comparison with undamaged condition.
Figure 8: Effect of 10% damage of torsional spring stiffness on electrical voltage signal and comparison with undamaged condition.
There is a demand for an expert to predict the intensity and location of the fault by observing fig-ures 7 and 8. Moreover, diagnosing faults by an expert is complex. Therefore, there should be a smart system like fuzzy classification to determine type and intensity of the faults.
It should be noted that, choosing variance for fuzzy set is crucial, because it affects operation of fuzzy logic. This is based on the fact that, each of the fuzzy sets should have a suitable width, in the case of determining the differences between measured data.
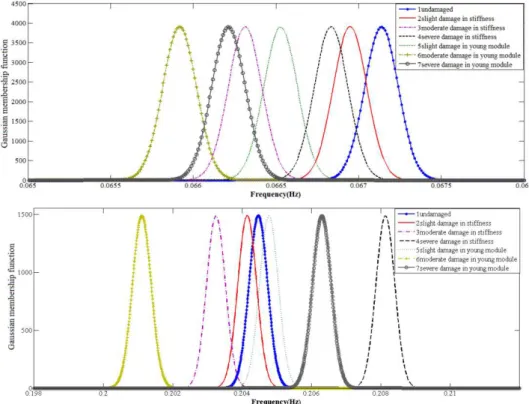
Gaussian membership functions of ω1, ω2, ω3 and ω4 are illustrated in figures 9 and 10. It should be mentioned that, in each of the figures there are seven Gaussian membership functions for differ-ent classes and ω. By analyzing figures 9 and 10, the condition of the structure is defined. Moreo-ver, a human operator cannot recognize the specific class by observing these figures and by compar-ing values of resulted frequencies with mean value of the plotted functions. Therefore, a fuzzy classi-fication method is required here. As it was described before, in this system four frequencies are con-sidered as an input and by substituting those into Eq. (28) and also by using Eq. (29) the condition of the system will be diagnosed.
Figure 9: Gaussian membership function of dominant frequencies (inputs of fuzzy system) related to the first and second feature.
works are done for various values of Signal to Noise Ratio (SNR), and 4 different values of SNR are considered and the results are summarized in Table 4.
Figure 10: Gaussian membership function of dominant frequencies (inputs of fuzzy system) related to the third and fourth feature.
Success rate without noise
Success rate for SNR=60
Success rate for SNR=40
Success rate for SNR=20
Mean success rate
Undamaged 100 100 100 100 100
Slight damage in
stiffness 100 90 80 100 92.5
Moderate damage
in stiffness 40 50 100 30 55
Severe damage
in stiffness 100 50 30 60 60
Slight damage in
Young module 100 100 80 40 80
Moderate damage
in Young module 70 60 30 20 45
Severe damage
in Young module 60 30 40 40 42.5
Total 81.43 70 65.71 55.71 67.86
It can be resulted from this table that for the without noise condition, fault diagnosis is done perfectly for all the classes. Furthermore, by decreasing SNR (increasing noise) as it was expected, the success rate is reduced. However, in SNR=60 (slight noise), faults and classes are diagnosed and this shows that, this method is resistant to slight noise which can be happened when the sensors are faulty or they are not precise. Therefore, these results show that this method can be used for fault diagnosing of the TLP structure.
5 RESULTS
In this paper the TLP structure is modeled as a cantilever beam which is jointed to the seabed with a torsional spring. After modeling and simulating, vibration response, voltage and electrical power are determined from the attached piezoelectric patches with considering different structural and wave uncertainties. As it can be seen from the results:
1.By increasing the value of the point mass, root mean square of the generated electrical power increases.
2.The value of the wave height and its effect on the generated electrical power is studied and it is shown that, increasing the wave height results an increase on the value of the root mean square of the generated electrical power.
3.The fault diagnoses of the system by considering the generated voltage, which is produced from piezoelectric materials, is studied for different fault intensities with fuzzy logic method and the diagnosis of the location and intensity of the faults is done perfectly.
4.Noise has a crucial effect on the responses and fault diagnosis. Therefore, the method is im-plemented in order to diagnose the faults in the noisy condition. The results show that the diagnosis is done well, even in presence of noise.
References
Adrezin, R., Bar-Avi, P., & Benaroya, H. (1996). Dynamic response of compliant offshore structures-review. Journal of Aerospace Engineering 9: 114-131.
Chandrashekhar, M., and Ganguli, R. (2009). Uncertainty handling in structural damage detection using fuzzy logic and probabilistic simulation. Mechanical Systems and Signal Processing 23: 384-404.
Farinholt, K. M., Miller, N., Sifuentes, W., MacDonald, J., Park, G., & Farrar, C. R. (2010). Energy harvesting and wireless energy transmission for embedded SHM sensor nodes. Structural Health Monitoring.
Gadagi, M. M., and Benaroya, H. (2006). Dynamic response of an axially loaded tendon of a tension leg platform. Journal of Sound and Vibration 293: 38-58.
Han, S. M., and Benaroya, H. (2002). Comparison of linear and nonlinear responses of a compliant tower to random wave forces. Chaos, Solitons & Fractals 14: 269-291.
Kim, C. H., Lee, C. H., and Goo, J. S. (2007). A dynamic response analysis of tension leg platforms including hydro-dynamic interaction in regular waves. Ocean engineering 34: 1680-1689.
Kosko B. (1997). Fuzzy Engineering, Prentice-Hall, NJ.
Lee, C. K., & Moon, F. C. (1990). Modal sensors/actuators. Journal of applied mechanics 57: 434-441.
Malekzehtab, H., and Golafshani, A. A. (2013). Damage detection in an offshore jacket platform using genetic algo-rithm based finite element model updating with noisy modal data. Procedia Engineering 54: 480-490.
Mangal, L., Idichandy, V. G., and Ganapathy, C. (2001). Structural monitoring of offshore platforms using impulse and relaxation response. Ocean Engineering 28: 689-705.
Mirab, H., Fathi, R., Jahangiri, V., Ettefagh, M.M. and Hassannejad, R., (2015). Energy harvesting from sea waves with consideration of airy and JONSWAP theory and optimization of energy harvester parameters. Journal of Ma-rine Science and Application, 14(4): 440-449.
Mojtahedi, A., Yaghin, M. L., Hassanzadeh, Y., Ettefagh, M. M., Aminfar, M. H., and Aghdam, A. B. (2011). De-veloping a robust SHM method for offshore jacket platform using model updating and fuzzy logic system. Applied Ocean Research 33: 398-411.
Morison, J. R., Johnson, J. W., and Schaaf, S. A. (1950). The force exerted by surface waves on piles. Journal of Petroleum Technology 2: 149-154.
Murray, R., and Rastegar, J. (2009). Novel two-stage piezoelectric-based ocean wave energy harvesters for moored or unmoored buoys. In SPIE Smart Structures and Materials+ Nondestructive Evaluation and Health Monitoring 72880E -72880E. International Society for Optics and Photonics.
Nagayama, T., Jung, H. J., Spencer, B. F., Jang, S., Mechitov, K., Cho, S., & Fujino, Y. (2010). International col-laboration to develop a structural health monitoring system utilizing wireless smart sensor network and its deploy-ment on a cable-stayed bridge. In 5th World Conference on Structural Control and Monitoring 1-10.
Park, J. W., Jung, H. J., Jo, H., Jang, S., and Spencer Jr, B. F. (2010). Feasibility study of wind generator for smart wireless sensor node in cable-stayed bridge. In SPIE Smart Structures and Materials+ Nondestructive Evaluation and Health Monitoring 764747-764747. International Society for Optics and Photonics.
Patel, M. H., and Park, H. I. (1991). Dynamics of tension leg platform tethers at low tension. Part I-Mathieu stabil-ity at large parameters. Marine structures 4: 257-273.
Rudman, M., and Cleary, P. W. (2013). Rogue wave impact on a tension leg platform: the effect of wave incidence angle and mooring line tension. Ocean Engineering 61: 123-138.
Sengupta, B.,and Ahmad, S. (1996). Reliability assessment of tension leg platform tethers under nonlinearly coupled loading. Reliability Engineering & System Safety 53: 47-60.
Taflanidis, A. A., Vetter, C., and Loukogeorgaki, E. (2013). Impact of modeling and excitation uncertainties on operational and structural reliability of tension leg platforms. Applied Ocean Research 43: 131-147.
Taylor, George W., Joseph R., Burns., S. A. Kammann., William B. Powers., and Thomas R. Welsh., The energy harvesting eel (2001) . A small subsurface ocean/river power generator. Oceanic Engineering IEEE Journal 539-547. Xie, X. D., Wang, Q., & Wu, N. (2014). Potential of a piezoelectric energy harvester from sea waves. Journal of Sound and Vibration 333: 1421-1429.
Yang, C. K., and Kim, M. H. (2010). Transient effects of tendon disconnection of a TLP by hull–tendon–riser cou-pled dynamic analysis. Ocean Engineering 37: 667-677.