Mariana Walter de Freitas Pereira Marques
Licenciada em Ciências de Engenharia do Ambiente
Potential for ORC Application in the
Portuguese Manufacturing Industry
Dissertação para obtenção do Grau de Mestre em
Engenharia do Ambiente, perfil Gestão e Sistemas Ambientais
Orientador: João Joanaz de Melo, Professor Auxiliar com
Agregação, Faculdade de Ciências e Tecnologia,
Universidade Nova de Lisboa.
Júri:
Presidente: Prof. Doutora Maria Júlia Fonseca de Seixas Arguente: Prof. Doutor Henrique Aníbal Santos de Matos
Mariana Walter de Freitas Pereira Marques
Licenciada em Ciências de Engenharia do Ambiente
Potential for ORC application in the
Portuguese Manufacturing Industry
Dissertação para obtenção do Grau de Mestre em
Engenharia do Ambiente, perfil Gestão e Sistemas Ambientais
Orientador: João Joanaz de Melo, Professor Auxiliar com
Agregação, Faculdade de Ciências e Tecnologia,
Universidade Nova de Lisboa.
Júri:
Presidente: Prof. Doutora Maria Júlia Fonseca de Seixas Arguente: Prof. Doutor Henrique Aníbal Santos de Matos
POTENTIAL FOR ORC APPLICATION IN THE PORTUGUESE MANUFACTURING INDUSTRY
Copyright © Mariana Walter de Freitas Pereira Marques, Faculdade de Ciências e Tecnologia, Universidade Nova de Lisboa
A Faculdade de Ciências e Tecnologia e a Universidade Nova de Lisboa têm o direito, perpétuo e sem limites geográficos, de arquivar e publicar esta dissertação através de exemplares impressos reproduzidos em papel ou de forma digital, ou por qualquer outro meio conhecido ou que venha a ser inventado, e de a divulgar através de repositórios científicos e de admitir a sua cópia e distribuição com objectivos educacionais ou de investigação, não comerciais, desde que seja dado crédito ao autor e editor.
ACKNOWLEDGEMENTS
First of all, I would like to give a special thanks to all those that directly contributed for the success of my work, kindly helped me and provided all the information and orientation I needed.
To my orientation teacher, Professor João Joanaz de Melo, for the willingness to discuss and advice throughout all this time, and to all those that make my faculty, FCT-UNL, a source of motivated and powerful students.
To the Directorate General for Energy and Geology, in the person of João Bernardo, for providing the data in which this Thesis was based.
To Mr. Francesco Campana, in representation of Turboden s.r.l., for the willingness to constantly answer to my questions, provide information and documents that were key for the present work, and later to receive me in person at Turboden.
To Mr. Manuel Silva, in representation of Suldouro, for the willingness to always clarify my doubts and provide information on the case study of Sermonde.
To Mr. Frederico Monteiro and Professor Daniel Vaz for the willingness to meet in person and discuss technical issues. To Mr. Pedro Costa, in representation of ERSE, for the willingness to answer to my specific questions.
Secondly, I would like to dedicate my Thesis to my mother as a reward for everything she ever invested in my education and my success, my life and my happiness. I know I already make you proud but this is a recognition of your recognition, thank you for everything!
A special thanks to all my family: my grandparents for being an eternal role model for the young people; to my older brother for all the constant inception about the importance of educating yourself and for the complicity of being the tutors of one another in our special way; to my aunts and uncles for all the orientation and advices, all that intermediate maturity and coaching that I will still be looking for in much more years to come!
To all my friends for always supporting me and making my life an adventure. Special thanks to: my fellow students and friends, Ana Barradinhas, Vanessa Tavares, Ana Cristina Rodrigues, Catarina Oliveira, Sandra Gonçalves and Marta Alves; to all my great friends for life, Marta Osório, Catarina Freitas, Catarina Pimentel, Catarina Girão, Catarina Marques, Joana Costa Pereira, Marta Candeias, Bárbara Rodrigues, Bruno Lopes, Francisco Lopes e Pedro Sá; to Sofia Vistas and Ricardo Bangueses, my dear friends and rescuers of software-panic situations; to Apostolhs Pantazis for all the support and lovely story together; to all my foreign and missed friends, Muito obrigada!, Grazie mille!, ¡Gracias!, Σαρ εςσαπιστούμε!, Paldies!, Dziękujemy!, Danke!
To my second family and magical ark of inspiration and challenges, ESN Lisboa, that taught me ―Sharing is caring‖ and all a parallel world of voluntary, addictive, constructive and lovely entrepreneurism and friendship. You and all the people we met together made my infinite time of work an infinite time of pleasure and adventure.
“It’s only impossible until it’s done.”
“What you think, you become.”
RESUMO
A Directiva Europeia para a Eficiência Energética (Directiva 2012/27/EU) entrou em vigor em 2012 para tornar a meta de Eficiência Energética do Horizonte "20-20-20" da UE em legislação vinculativa. Cada Estado-Membro foi obrigado a definir uma meta nacional indicativa de eficiência energética de forma a alcançar uma determinada poupança de energia final em 2016. O segundo Plano Nacional de Acção para a Eficiência Energética (PNAEE 2016) Português define uma meta de 8.2% para a poupança no consumo de energia final em 2016. Cerca de 24% das poupanças estabelecidas pela meta estão concentradas na Indústria, mas menos de metade dessas poupanças foram executadas pelo PNAEE anterior (PNAEE 2008-2015) até 2010.
Grandes oportunidades de poupança existem ainda, tais como a possibilidade de recuperação das grandes quantidades de calor desperdiçado pelos processos industriais. Algumas tecnologias têm sido propostas para produzir eletricidade a partir de fontes de calor de baixa hentalpia, entre as quais o Ciclo Orgânico de Rankine (COR).
O presente trabalho tem como objectivo quantificar o calor desperdiçado em alguns sectores da indústria de manufactura Portuguesa e o potencial de aplicação de sistemas COR. A metodologia desenvolvida baseou-se na análise de 116 instalações industriais através de auditorias energéticas e outros documentos. As 50 instalações que revelaram potencial para a aplicação de COR constituíram a base das estimativas e representam 16% do consumo total energético da indústria de manufactura em 2010.
Os regimes a operar no país de apoio à produção de eletricidade a partir de fontes renováveis e cogeração não contemplam especificamente a produção através da recuperação de calor. O país carece assim de um enquadramento adequado. O presente estudo fornece uma avaliação preliminar dos benefícios alcançáveis através da geração de eletricidade a partir de fontes de calor desperdiçado, e procura motivar o Governo a concentrar esforços futuros na inclusão dos sistemas COR nas estratégias nacionais como uma medida de eficiência energética na indústria .
Um total de 8 setores industriais foram analisados, mas apenas 4 estão incluídos no universo final: Cerâmica, Cimento , Metais de base (Siderurgia e Metalurgia) e Madeira & Cortiça. Para estes, unidades COR de potência instalada de 48 kWe a 3.3 MWe são viáveis, demostrando períodos de retorno normalmente entre 2 e 6 anos.
Para um investimento estimado em 104 M€ em sistemas COR instalado nos sectores da Cerâmica, Cimento , Metais de base e Madeira & Cortiça, uma potência elétrica instalada total de 37 MWe pode significar a execução de 5.2 a 6.6% da meta Portuguesa de Eficiência Energética (2016) para a Indústria, com emissões evitadas associadas de 132 kt CO2e/ano.
ABSTRACT
The European Directive on Energy Efficiency (Directive 2012/27/EU) entered into force in 2012 to translate the EU ―20-20-20‖ Efficiency Target into binding legislation. Each Member State was obligated to set an indicative national energy efficiency target and to achieve a certain amount of final energy savings by 2016. The second Portuguese National Action Plan for Energy Efficiency (PNAEE 2016) defines a target of 8.2% for savings on final energy consumption by 2016. Savings in Industry account for 24% of the target, but less than half of it was executed through the former Plan (PNAEE 2008-2015), by the end of 2010.
Worthwhile energy saving opportunities remains such as the recovery of the great amounts of wasted heat in industrial processes. Some technologies have been proposed to generate electricity from low temperature heat sources, among which the Organic Rankine Cycle (ORC).
The present work assesses the wasted heat in some sectors of the Portuguese manufacture industry and the potential to implement ORC systems. The methodology developed was based on the analysis of 116 industrial plants through energy audits and other documents. The 50 plants that revealed potential for ORC implementation were the base for estimations and represent 16% of the manufacture industry total energy consumption in 2010.
The national support schemes for power generation from renewable resources and cogeneration do not contemplate specifically the electricity production through waste heat recovery. Therefore, the country lacks on an appropriate framework. This study provides a preliminary assessment of the benefits reachable through waste heat-to-power generation and intends to help focus future efforts by the government on the inclusion of ORC in national strategies as an energy efficiency measure in Industry.
A total of 8 sectors were analysed but only 4 are included in the final universe: Ceramic, Cement, Basic metals and Wood & Cork. For these, ORC units of 48 kWe to 3.3 MWe installed power are feasible, showing payback times typically between 2 and 6 years.
For an estimated total investment of 104 M€ in ORC systems in the Ceramic, Cement, Basic metals and Wood & Cork industries, about 37 MWe installable power could mean executing 5.2 to 6.6% of the Portuguese 2016 Target of savings on Final Energy consumption in Industry, with associated avoided emissions of 132 kt CO2e/year.
INDEX OF FIGURES ... xiii
INDEX OF TABLES ... xv
ACRONYMS AND ABBREVIATIONS ... xvii
1 INTRODUCTION ... 1
1.1 Framework ... 1
1.2 Objectives ... 2
1.3 Organization of the work ... 2
2 WASTE HEAT RECOVERY FOR POWER GENERATION IN THE MANUFACTURING INDUSTRY ... 5
2.1 Framework ... 5
2.2 Factors affecting Waste Heat Recovery feasibility ... 6
2.3 Sources of Low-grade Waste Heat and Potential for Power Generation ... 9
2.3.1 Cross-cutting sources in Industry ... 9
2.3.2 Sources by Industrial sector and Heat Recovery practices ... 10
2.4 WHRPG in Industry in a Political and Economic framework ... 20
2.4.1 Project feasibility ... 21
2.5 Energy and Energy Efficiency in Portuguese Industry ... 22
2.5.1 Framework and late developments... 22
2.5.2 Funds for Energy Efficiency and Remuneration Regimes for the Production of Electricity .. 25
2.5.3 Conclusion ... 26
2.5.4 Case studies in Portugal ... 27
3 LOW-GRADE WASTE HEAT RECOVERY TECHNOLOGIES FOR POWER GENERATION ... 29
3.1 Power cycles ... 29
3.2 Working Fluids ... 31
3.3 Organic Rankine Cycle (ORC) ... 34
3.3.1 History and Applications ... 34
3.3.2 The market ... 35
3.3.3 Comparison to Steam Rankine cycle... 40
3.3.4 System working conditions and configuration ... 41
3.3.5 Working Fluids ... 43
3.3.6 Mechanical components and optimization ... 45
3.3.7 ORC applied to the manufacture Industry – Case Studies ... 47
4 METHODOLOGY ... 51
4.1 Sequence of tasks ... 51
4.2 Characterization of the Industrial Sectors ... 52
4.3 Conclusion on political and economic framework for ORC ... 52
4.4 Analysis of Industrial Installations ... 52
4.4.1 Estimation of the representativeness of samples ... 52
4.4.2 Identification and characterization of waste heat sources by installation ... 53
4.4.3 Quantification of low-grade waste heat by sector ... 54
4.4.4 Estimation of power generation through ORC by installation ... 54
4.6 Conclusion on benefits of ORC application for national target on Energy Efficiency ... 59
4.7 Conclusion on benefits of ORC application on CO2 emissions ... 60
4.8 Economic Evaluation ... 60
4.8.1 Estimation of total investment ... 60
4.8.2 Estimation of payback times ... 61
5 RESULTS... 63
5.1 Characterization of the Industrial Sectors ... 63
5.2 Conclusion on political and economic framework for ORC ... 64
5.2.1 Integration in national strategies and remuneration regimes ... 64
5.2.2 Integration in funds for energy efficiency ... 65
5.3 Analysis of the Industrial installations ... 66
5.3.1 Estimation of the representativeness of samples ... 66
5.3.2 Identification and characterization of waste heat sources by installation ... 68
5.3.3 Quantification of low-grade waste heat by sector ... 73
5.3.4 Estimation of power generation through ORC by installation ... 73
5.4 Calculation of ORC total installable power ... 78
5.5 Conclusion on benefits of ORC application for national target on Energy Efficiency ... 79
5.6 Conclusion on benefits of ORC application on CO2e emissions ... 79
5.7 Economic Evaluation ... 80
6 CONCLUSION ... 83
6.1 Synthesis of the developed work ... 83
6.2 Synthesis of the main results ... 83
6.3 Limitations of the work ... 84
6.4 Future developments ... 85
REFERENCES ... 87
ANNEX I ... 97
INDEX OF FIGURES
Figure 2.1 - The influence of temperature differential between heat source and sink on the heat exchange
surface area varying with heat transfer coefficient (U). ... 8
Figure 2.2 - Heat recovery curve for natural gas-fired boiler (adapted from BCS Incorporated, 2008). ... 8
Figure 2.3 - Energy losses by source and process unit in a 200 000 bbl/d refinery plant (adapted from Meacher, 1981). ... 12
Figure 2.4 - Generic wet sulfuric acid process and opportunities for HR. ... 12
Figure 2.5 - Schematic diagram of a generic tunnel kiln (a) and an example of a combined heat recycling system (b) (adapted from EC, 2007). ... 14
Figure 2.6 - Generic cross-fired regenerative furnace (a) with heat recovery opportunities from flue gases (b), before (1) and after (2) the cleaning system (adapted from EC, 2013; Hnat et al., 1981). ... 15
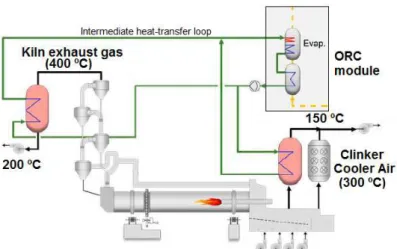
Figure 2.7 – Possible layout of waste heat recovery systems on a cement plant using ORC (adapted from Exergy S.p.A., 2013). ... 17
Figure 2.8 - Gas and solids temperature profiles in a cyclone preheater kiln system (EC, 2013c). ... 17
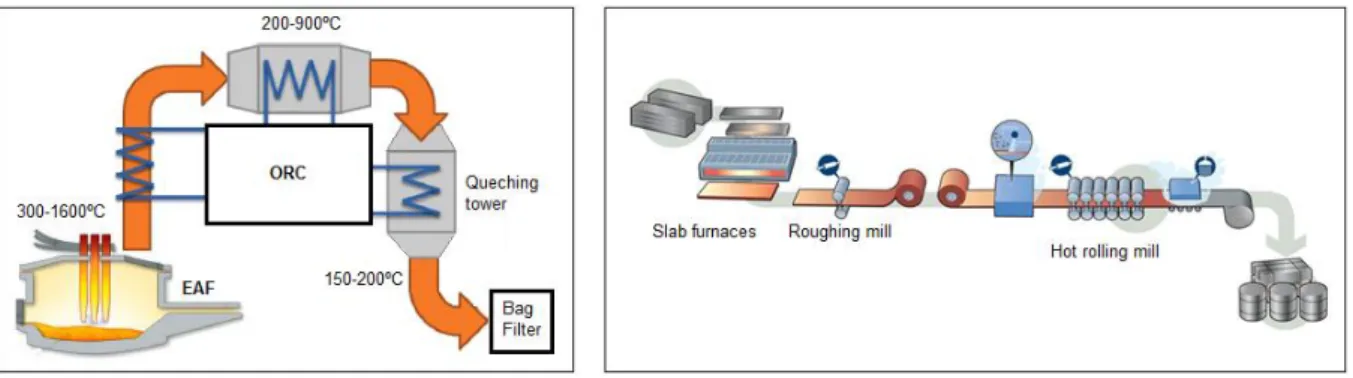
Figure 2.9 - Conceivable layout for waste heat recovery from EAF using ORC (adapted from Campana, 2012). 19 Figure 2.10 - Hot rolling mill schematic (adapted from IETD, 2014). ... 19
Figure 2.11 - Electricity prices for industrial consumers with average consumption (Eurostat Ic band price) in EU-27 with focus to Italy, Portugal and Norway (Eurostat, 2013). ... 22
Figure 2.12 - Evolution of registrations in SGCIE (ADENE, 2014). ... 24
Figure 2.13 - GHG emissions in Portugal by sector in 2011 (APA, 2013). ... 24
Figure 2.14 - Annual average cost of the Production in Special Regime - PRE (ERSE, 2014). ... 26
Figure 3.1 - Thermodynamic cycles and their temperature range (Paanu et al., 2012). ... 29
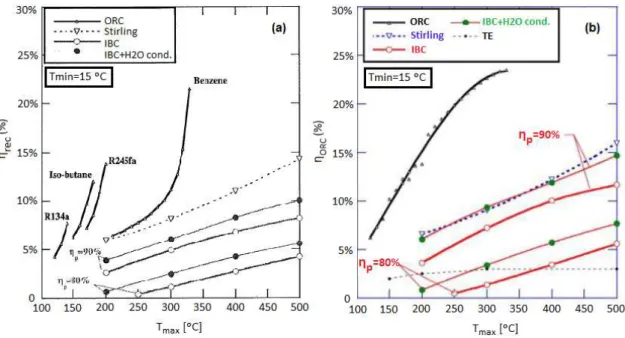
Figure 3.2 - ORC efficiencies vs. Hot source Temperature: (a) total heat recovery efficiency and (b) cycle efficiency; ηP is the polyotropic efficiency (adapted from Bianchi & De Pascale, 2011). ... 31
Figure 3.3 – T-s charts of isentropic, wet and dry working fluids (adapted from Quoilin et al., 2013) ... 32
Figure 3.4 - T-s diagram of a dry and a wet fluid used in supercritical Rankine cycles (adapted from Chen, 2010) ... 33
Figure 3.5 - Distribution of 35 working fluids in Tc- ξ chart with detail to common WF for ORC (adapted from Chen, 2010). ... 34
Figure 3.6 – ORC market evolution (Enertime, 2009). ... 36
Figure 3.7 - Number of references to ORC systems by country (Enertime, 2009). ... 36
Figure 3.8 - Number of references to ORC system according to the heat source (Rettig et al., 2011)... 36
Figure 3.9 - Number of ORC systems per power and temperature range (Enertime, 2009). ... 36
Figure 3.10 - The three main ORC manufacturers in terms of installed units and installed power (Source: Quoilin et al., 2013). ... 37
Figure 3.11 - Examples of ORC modules available on the market: Tri-o-Gen 165kWe (a) and Turboden 5MWe (b) power units. ... 37
Figure 3.12 - Comparison of a 100 kWe ORC-plant realized with (A) conventional technology and with (B) high-speed technology (same scale); 1 turbine, 2 generator, 3 reduction gear, 4 oil pump, 5 feed pump, 6 vacuum pump, 7 shaft seal (Larjola, 1995). ... 38
Figure 3.13 – Triogen high-speed turbo generator (Triogen). ... 38
Figure 3.14 - Module (empty dots) and total (plain dots) cost of ORC systems depending on the target application and on the net electrical power (adapted from Quoilin et al., 2013). ... 39
Figure 3.15 - Specific cost function of ORC systems (Rettig et al., 2011). ... 39
Figure 3.17 - T–s diagram of water and organic fluids (Vankeirsbilck et al., 2011). ... 41 Figure 3.18 - Schematic view of an ORC with (a) and without (b) recuperator, with detail to ORC T-s diagram (adapted from Quoilin et al., 2013). ... 42
Figure 3.19 - WF used in ORC modules available on the market depending on the temperature of the hot source (adapted from David et al., 2011). ... 43 Figure 3.20 - Net Power Output from the ORC system at various ambient temperatures (Datla & Brasz, 2012). . 44 Figure 3.21 - ORC fluid families (Branchini et al., 2012). ... 44
Figure 3.22 - Allowed power range for each type of expansion machine (Quoilinet al., 2012).... 46
Figure 3.23 - VER values of existing ORC turbines of different technology and with specified fluids (Branchini et al., 2012). ... 46 Figure 3.24 - Schematic view of the Turboden turbine–recuperator–condenser assembly (Quoilin et al., 2013). . 47 Figure 3.25 - Simplified scheme of a heat recovery plant on a ceramic kiln with (A) feedpump, (B) preheater, (C) vaporizer, (D) turbine, (E) condenser, (H) stack, (M) by-pass valve and (N) cooling tower (adpated from EC, 1981). ... 48 Figure 3.26 - Proposed layout of a MDF plant in Metso, Turboden (COGEN, 2011). ... 50
Figure 3.27 - Schematic diagram of a CHP biomass plant for sawmills with drying chambers and an ORC unit (Peretti, 2008). ... 50
Figure 4.1 - Illustration of a generic heat source considered for ORC systems (adapted from David et al., 2011). ... 53
Figure 5.1 - Share on final energy consumption (%) in Portugal by sector of economic activity (a) and industrial sector (b) (DGEG, 2012). ... 63
Figure 5.2 - Fluctuations of energy consumption by sector between 2008 and 2012, evidencing larger variations (DGEG, 2012). ... 63 Figure 5.3 - Representativeness of the main sectors of the Ceramic industry in 2010 (CTCV, 2012). ... 64
Figure 5.4 – Observed frequency of temperatures (ºC) of the waste heat sources in FDM, Meat production & Tobacco sector... 69
Figure 5.5 – Observed average energy profile of Ceramic kilns and frequency of exhaust air temperatures by Ceramic subsector. ... 70
Figure 5.6 - Distribution of the total installable power (kWe) in the Ceramic sector. ... 75
Figure 5.7 - Installed power ratio (rA) of 21 analyzed cement plants (Campana, 2012). ... 76
Figure 5.8 – ORC total installable power and maximum ORC unit size by sector in the Portuguese Manufacturing Industry. ... 79
Figure 5.9 - Avoided CO2e emissions through the application of the proposed ORC systems in the Portuguese Manufacture Industry. ... 79
INDEX OF TABLES
Table 2.1 - Examples of hot sources for recovery, ranges of temperature and applicable technologies. ... 5
Table 2.2 - Potential for heat recovery on manufacture industrial sectors (adapted from Rossetti, 2010). ... 10
Table 2.3 - Sources of low-grade heat in food processing industry (Law et al., 2011). ... 11
Table 2.4 - Typical temperatures of waste streams in integrated steelworks and limits to HR feasibility (BCS Incorporated, 2008; IETD, 2014) ... 18
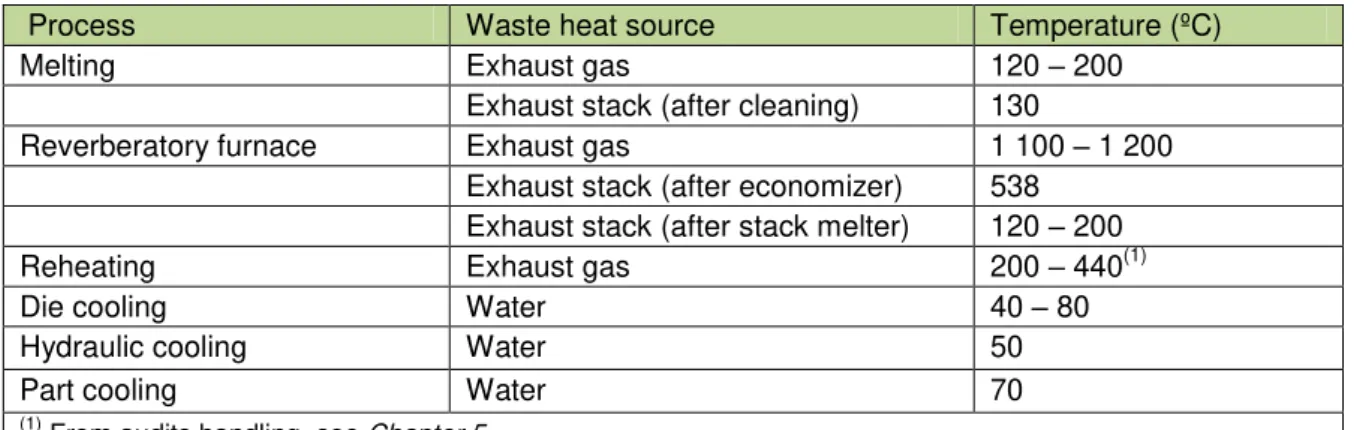
Table 2.5 - Typical temperatures of waste streams in non-ferrous plants (BCS, Incorporated, 2008; EC, 2001a; Vankeirsbilck et al., 2011). ... 20
Table 2.6 - Values of the reference tariff (Tref) in PRE regime, published in Order Nº1/2014, applicable on the first trimester of 2014 (DGEG, 2014; ERSEa, 2014). ... 26
Table 2.7 - Average Annual Cost by Technology – mainland Portugal (ERSEa, 2014a). ... 26
Table 3.1 - Capital cost of different technologies for waste heat recovery for power generation (BCS, Incorporated, 2008). ... 40
Table 4.1 - General methodology and sequence of works of the present study. ... 51
Table 4.2 - Adopted WF for considered ranges of the hot source temperature and stated ORC efficiencies. ... 56
Table 4.3 - Process Capacity Parameters (PCP) and rP values (Campana, 2012). ... 57
Table 4.4 - Estimated impact of ORC application in the Portuguese target for 2016 on Savings of Final Energy in Industry. ... 59
Table 4.5 - Costs of ORC systems as an approximated function of installed power. ... 60
Table 5.1 – Categories evaluated eligible for the integration of ORC systems as an energy efficiency measure in the SGCIE for Industry. ... 65
Table 5.2 – Available Energy Audits in the different CAE for Industry... 67
Table 5.3 - Representativeness of the sample of installations on Total Energy consumption by Sector. ... 67
Table 5.4 - Representativeness of the installations analysed for ORC application on Total Energy consumption by Sector. ... 67
Table 5.5 - Sources of heat analyzed for ORC application by sector. ... 68
Table 5.6 - Observed temperatures of the waste heat sources in FDM, Meat production & Tobacco sector. ... 68
Table 5.7 - Observed waste heat sources - Chemicals & Plastics sector. ... 69
Table 5.8 - Observed waste heat sources - Ceramics sector. ... 70
Table 5.9 - Estimated waste heat sources - Ceramics sector. ... 71
Table 5.10 – Heat recovery strategies in analysed Cement plants. ... 71
Table 5.11 - Observed waste heat sources – Basic metals sector. ... 72
Table 5.12 - Observed temperatures of boilers in Wood & Cork sector. ... 73
Table 5.13 - Estimated wasted energy by sector referring to 2012 consumptions. ... 73
Table 5.14 – Installable ORC units in the Ceramic subsectors – 1st Method. ... 74
Table 5.15 – Installable total ORC electric power in the Ceramic sector – 1st Method. ... 75
Table 5.16 - Validation of the extrapolated results through the 1st Method for the Ceramic sector. ... 75
Table 5.17 - Installable total ORC electric power in the Ceramic sector – 2nd Method. ... 75
Table 5.18 - Installable total ORC electric power in the Cement sector. ... 77
Table 5.19 - Installable total ORC electric power in the Basic metals sector. ... 77
Table 5.20 – Comparison between waste heat recovery and cogeneration ORC systems in the Wood & Cork sector. ... 78
Table 5.22 - Estimated impact of ORC application as an energy efficiency measure in the Portuguese targets of savings on final energy consumption in Industry. ... 79
Table 5.23 – Payback periods, total investment and specific cost of the ORC systems in the final considered sectors of the Manufacturing Industry. ... 80
Table AI 1 - Operating data of continuous kilns for each sub-sector of Ceramic Industry (EC, 2007a). ... 97 Table AI 2 - ORC manufacturers and data on respective products. ... 98
Table AII 1 - Waste heat sources, wasted heat and ORC instalable electric power in FDM, Meat production and Tobacco plants. ... 100 Table AII 2 - Waste heat sources, wasted heat and ORC instalable electric power in Paper process plants. .... 103 Table AII 3 - Waste heat sources, wasted heat and ORC instalable electric power in Chemical & Plastic plants. ... 104 Table AII 4 - Considered values on the calculation of wasted heat and power generation for the Unknown kilns of the Ceramic Industry. Reference values from CTCV (2012) and BREF on Ceramics (2007). ... 105 Table AII 5 - Waste heat sources, wasted heat and ORC instalable electric power in Ceramic plants. ... 106 Table AII 6 - Waste heat sources, wasted heat and ORC instalable electric power in Cement plants. ... 109
Table AII 7 - Waste heat sources, wasted heat and ORC instalable electric power in Basic metals processing plants. ... 109
ACRONYMS AND ABBREVIATIONS
e.g. - Latin exempli gratia (for example)
f.i. – for instance
i.e. – that is
rec. – recovered
w/ – with
w/o – without
CAPEX – Capital expenditure
CC – Clinker cooler
CEN – Comité Européen de Normalisation (European Committee for Standardization)
CHP – Combined Heat and Power
CTCV – Centro Tecnológico da Cerâmica e do Vidro (Ceramics and Glass Technological Centre)
DGEG – Direcção Geral de Energia e Geologia (Directorate General for Energy and Geology)
EAF – Electric arc furnace
EC – European Comission
EE – Energy Efficiency
EEP – Energy Efficiency Plan
ESP – Electrostatic precipitators
ETS – Emission Trading System
EU – European Union
FDM – Food, drink and milk
GHG – Greenhouse gases
GWP – Greenhouse Warming Potential
HR – Heat recovery
IBC – Inverted Brayton Cycle
ICE – Internal Combustion Engine
IIP – Institute for Industrial Productivity
KCT - Kalina Cycle Technology®
LE – Large Enterprise
MRC – micro Rankine cycles
MS – Member-State of the European Union
NEAAP – National Energy Efficiency Action Plan
ODP – Ozone Depleting Potential
OMTS – Octamethyltrisiloxane
PBT – Payback time
PH – Preheater
PNALE – Plano Nacional de Atribuição de Licenças de Emissão (National Allocation Plan)
PRE – Produção em Regime Especial (Special Regime of Production)
PREn – Plano de Racionalização dos Consumos de Energia (Energy Consumption Rationalizations Plan)
QREN – Quadro de Referência Estratégica Nacional (National Strategic Reference Framework)
R&D – Research and Development
ROI – Return on Investment
ScRC – Supercritical Rankine Cycle
SGCIE – Sistema de Gestão dos Consumo Intensivos de Energia (Intensive Energy Consumption Management System)
SILC – Sustainable Industry Low Carbon
SME – Small and Medium Enterprise
SMI – Small and Medium-size Industrie
SRC – Steam Rankine cycle
TFC – Trilateral Flash Cycle
toe – Tonne of oil equivalent
We– Electric power
WF – Working Fluid
WHR – Waste heat recovery
WHRPG – Waste heat recovery for power generation
1 INTRODUCTION
1.1
FrameworkPeople's well-being, industrial competitiveness and the overall functioning of society are dependent on safe, secure, sustainable and affordable energy. In recent years the European Union (EU) faced several important energy issues that have pushed energy towards the top of national and European political agendas, such as the volatility in oil prices, interruptions of energy supply from non-member countries, blackouts aggravated by inefficient connections between national electricity networks, and the difficulties of market access for suppliers in relation to gas and electricity markets (EC, 2014a). The central goals for EU energy policy are laid down in the Lisbon Treaty: security of supply, competitiveness, and sustainability. Even if EU is currently a world´s dominant driving force towards the sustainable production of energy and a leader in implementing renewable energy policies, it is at the same time the world´s biggest (53.3%) importer of energy (Eurostat, 2012). In order to change this situation and reach Lisbon Treaty‘s goals, the European Council in 2007 created a major policy package known as the ―20-20-20 targets‖ with ambitious energy and climate change objectives for 2020: to reduce greenhouse gas emissions by 20%, rising to 30% if the conditions are right, to increase the share of renewable energy to 20%, and to make a 20% improvement in energy efficiency (Directive 2003/87/EC; Directive 2009/28/EC; Directive 2012/27/EU). This binding legislation was adopted in 2009 and these objectives would continue to deliver beyond 2020 helping to reduce emissions by about 40% by 2050 (EC, 2011a, 2011b).
In contrast with the climate protection and renewable targets, the third goal soon was detected to be only on the track to 10%, half of the initial target, mainly due to market and regulatory failures and not to the lack of economic potential (EC, 2011c). Unlike the first two, the efficiency target was not translated into binding legislation, leading to slippage in meeting the objective. A new Directive (CD 2012/27/EU on Energy Efficiency – ―EED‖) entered into force on 4 December 2012, aiming to bridge this gap and deliver the 2020 20% energy efficiency target. It does not introduce binding targets at national level, but "binding measures" in energy generation, use and supply. For example, each Member State (MS) was obligated to set an indicative national energy efficiency target and to achieve a certain amount of final energy savings over the obligation period (01 January 2014 – 31 December 2020) by using energy efficiency obligations schemes or other targeted policy measures to drive energy efficiency improvements in households, industries and transport sectors.
In the last years the main tool towards energy efficiency in Portugal was the National Action Plan for Energy Efficiency (PNAEE 2008-2015) which comprised a vast series of programmes and measures to deliver the EU targets set to Portugal of 25% savings on primary energy by 2020 and 1% savings on final energy consumption per year (Directive 2006/32/EC on Energy end-use Efficiency and Energy Services – ―ESD‖), both respecting to EC PRIMES forecasts carried out in 2007. The new Portuguese National Energy Efficiency Plan (PNAEE 2016) shows a higher value for the first target (26%), if all programs and measures it contemplates are fully met and implemented, but a lower one (8.2%) for the second target compared to the expected 9% in the ninth year i.e. 2016 (PCM, 2013). Concerning the distribution of the reduction in energy consumption over the sectors of activity, Industry shows the second large share (24%) for the 2016 target. The impact of PNAEE 2008-2015 for Industry resulted, by the end of 2010, in the execution of 49% of the 2016 target, which fell short of the objective. Therefore reinforcement is made in PNAEE 2016.
other initiatives (EC, 2012b). The recovery of industrial waste heat plays already an important role in EE. However, it is observed that more than 50% of industrial waste heat is of low-grade and an important opportunity reside in power generation through a number of new solutions that have been proposed to generate electricity from low temperature heat sources. Among other, the works on Organic Rankine Cycle (ORC) were intensified and it is being progressively adopted as a premier technology to convert low-grade heat resources into power (Navarro-Esbri et al., 2013).
In Portugal, Manufacturing Industry is responsible for 29% of final energy consumption, of which 27% electricity (INE, 2012). The sector presents improvements in EE in the last years, but at the very modest rate of 1% between 2000 and 2009 (ADENE, 2012). The recovery of the untapped low-grade industrial waste heat for power generation could help Portugal reaching its EE target, while rising energy efficiency in industry and decreasing the CO2e emissions. Analogous study appears to be developed for France concluding over 50MWe could be implemented in steel factories and more than 15MWe in cement factories (David et al., 2011). Lukawski (2009) investigated the possibility of introducing standardized ORC power plants to the European energy market.
1.2
ObjectivesThis work focuses on the ORC as a Waste Heat Recovery for Power Generation (WHRPG) technology capable of exploiting low-grade waste heat in the Manufacturing Industry, applied to the case of Portugal. The results support the ORC as a proposed measure for energy efficiency in the Manufacture Industry.
The main objectives are as follows:
1) Review the practises of Heat Recovery in the different industrial sectors and the opportunities for WHRPG;
2) Review the WHRPG technologies with detail to ORC;
3) Identify waste heat sources in Industrial sectors eligible for ORC; 4) Conclude the market, economic and political framework of ORC;
5) Assess the technical and economic potential for ORC application in the Portuguese manufacturing Industry, based onEnergy Audits to installations provided by DGEG and other documents;
6) Estimate the impact of the application of the proposed ORC systems in the execution of the national target on Energy Efficiency.
1.3
Organization of the workThe present dissertation is divided into 6 Chapters.
Chapter 2. The situation of energy consumption and energy efficiency in Industry is summarized connected to the EU strategy for Energy and Carbon emissions. Reference is made to undergoing studies on WHR in Industry. A review on the opportunities for WHR is performed, referring to the estimated dimension of available waste heat in the Manufacturing Industry, present state of exploitation, characteristics of the waste heat sources and techniques in use or applicable by industrial sector. Other common and/or specific sources of heat eligible for ORC are presented. The review allowed assessing later the untapped waste heat in the Portuguese Manufacturing Industry. The political and economic framework of WHRPG practises is summarized, addressing the main constraints for their feasibility, with detail to the Portuguese case. The main tools to promote energy efficiency and the clean generation of electricity in Portugal are addressed. National case studies are presented.
performance constraints are summarized. Finally, it is presented a group of case studies in the different industrial sectors where the ORC was applied.
Chapter 4. The methodology of the work is presented by a serial of tasks referring to the literature review stages and data treatment. The practical part of the work is discriminated with reference to assumptions, calculation methods and consulted documents. The work general approach is presented, as well as the complementary specific approaches used to each industrial sector.
Chapter 5. The development of the tasks summarized in Chapter 4 is performed and results are presented and discussed. The industrial sectors in Portugal are characterized, and it is concluded the political and economic framework for ORC implementation in the Portuguese manufacturing industry. The ORC total installable power is calculated and a brief economic analysis performed. It concludes the benefits of ORC application on CO2e emissions and on the execution of national EE target set by EU requirements.
2 WASTE HEAT RECOVERY FOR POWER GENERATION IN THE MANUFACTURING INDUSTRY
2.1
FrameworkThe industrial sector in EU-28 accounts for approximately 26.1% of final end-use of energy, consuming approximately 289 Mtoe annually and emitting about 5 671 kt of CO2e associated with industrial processes (Eurostat, 2011a, 2001b). The EU Low-carbon Roadmap shows the path for reducing EU‘s CO2e emissions by 80% by 2050, and to the industry sectors that would mean aggregate reductions of 34-40% by 2030, and of 83-87% by 2050, considering assumptions of technology and fossil fuel price. Sectors subject to the Emission Trading System (ETS) are, on aggregate, bound to reduce by 2020 their carbon emissions by 21% from the level in 2005, compared with 10% for the non-ETS sectors (EC, 2013).
The EU Energy Efficiency Action Plan of 2006 recognized manufacturing industry as one of the most promising sectors to reduce primary energy consumption, with an estimated overall potential of 25%. The EU Impact Assessment of the Commission staff on the EEP 2011 recognized that the energy intensive industries (EII) make already use of energy efficiency improvements to decrease costs but that it is still some remaining potential, and that this is particularly true for small and medium-size industries (SMI). With the right technology and support, SMI could make energy savings of 20%, and by changing certain production processes, savings of 30% up to 65%.
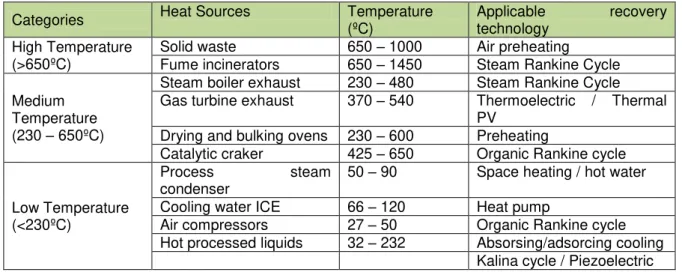
Efforts to improve industrial energy efficiency focus on production planning, investment in energy-efficient equipment (e.g. furnaces, pumps and motors), recycling energy in the industrial production process (e.g. pre-heating of combustion air and/or load, drying, steam generation, district heating & cooling) and recovery of excess energy and subsequent utilization in other processes. Selection of heat recovery procedure shall follow, in a pursuit for simplicity and cost-efficiency, the direct re-use to process, heat transfer via heat exchangers (recuperators, regenerators, air preheaters, economizers, heat pipes, waste heat boilers, etc.), energy transformation (heat pumps, power generation, absorption/adsorption refrigeration) and ―over the fence‖ energy users. Nevertheless, it shall be note that according to EU directives, management of e.g. waste recovered as raw material is a priority as compared to energy recovery. Table 2.1 addresses some recovery techniques depending on the heat source temperature grade.
Table 2.1 - Examples of hot sources for recovery, ranges of temperature and applicable technologies.
Categories Heat Sources Temperature (ºC) Applicable technology recovery
High Temperature (>650ºC)
Solid waste 650 – 1000 Air preheating Fume incinerators 650 – 1450 Steam Rankine Cycle
Medium Temperature (230 – 650ºC)
Steam boiler exhaust 230 – 480 Steam Rankine Cycle Gas turbine exhaust 370 – 540 Thermoelectric / Thermal
PV
Drying and bulking ovens 230 – 600 Preheating
Catalytic craker 425 – 650 Organic Rankine cycle
Low Temperature (<230ºC)
Process steam
condenser
50 – 90 Space heating / hot water
Cooling water ICE 66 – 120 Heat pump
Air compressors 27 – 50 Organic Rankine cycle Hot processed liquids 32 – 232 Absorsing/adsorcing cooling
In many branches of industry a lot of thermal energy is needed and about 75% of final energy is for thermal purposes such as furnaces, reactors, boilers and dryers. Waste heat is intrinsic to all industrial manufacturing and roughly one-third of the energy consumed by industry is discharged as thermal losses directly to the atmosphere or to cooling systems (Dupont & Sapora, 2009). Experts assume that the annual unused industrial waste heat potential amounts to 140 TWh in Europe alone (Paepe et al., 2012). A survey made by the Energy Information Administration (EIA, Annual Energy Review 2006) shows that the quantity of waste heat available from U.S. industry is bigger than current energy production from all renewable sources combined. Captured and reused waste heat is an emission-free substitute for costly purchased fuels or electricity, and numerous technologies and strategies are available for transferring waste heat to a productive end-user, both thermal and power generation.
However, industrial waste heat remains largely unutilized due to various technological, market and regulatory barriers (read also Section 2.4). Investigation of current WHR practices shows that waste heat is generally recovered from clean, high-temperature waste heat sources in large capacity systems. A report made for the US Department of Energy (BCS Incorporated, 2008) identifies key opportunities: optimizing existing systems, developing technologies for chemically corrosive systems, recovering heat from non-fluid heat sources and recovering low-temperature waste heat.
While low temperature waste heat has less thermal and economic value than high temperature heat, it is available in large quantities, accounting for more than 50% of industrial waste heat (Quoilin et al., 2011; BCS Incorporated, 2008), and therefore should not be neglected. Low-grade waste heat is available in waste streams with temperatures between 200 and 500ºC (Bianchi & Pascale, 2011), and many small-medium size industrial applications only discharge some hundreds of kWth from processes, which is not compatible with the adoption of superheated water-steam turbine cycles if power generation is to be applied.
Steam Rankine cycles (SRC) are still the most familiar heat-to-power systems in industry and are generally economically preferable where the source heat temperature is above 350ºC (BCS, Incorporated, 2008). However, an important number of technologies have been proposed to generate electricity from low-grade heat sources. Chapter 3 provides a review on these technologies, among which Organic Rankine Cycle (ORC), the subject of this study. Only through ORC, a potential of 750 MWe is estimated for power generation from industrial waste heat in U.S., 500 MWe in Germany (Quoilin et al., 2013), 65 MWe in French steel and cement industry (David et al., 2011), and at least 5000 MWe in Europe (Campana, F., 2012).
Campana (2012) accessed the ORC waste heat recovery in European EII, which represents the first comprehensive estimate of ORC units that can be installed in cement, steel, glass and oil & gas industries in the EU-27 (Campana et al., 2012). The study was based on an accurate methodology related to real plants in operation or under construction, and was carried out in the framework of an European research project named Heat Recovery in Energy Intensive Industries (―HREII‖). The study found that, in the most convenient considered scenario, up to about 20 000 GWh of thermal energy per year can be recovered and 7.6 Mton of CO2e can be saved by the application of ORC technology to the investigated and most promising industrial sectors. The selection of the most promising industrial processes was made based on the published report of the EU project Sustainable Industry Low Carbon (SILC), which compared industries involved in ETS that could benefit by heat recovery initiatives to reduce GHG emissions.
2.2
Factors affecting Waste Heat Recovery feasibilityThe heat content of a waste stream is a function of both the temperature and the mass flow of the stream:
̇ ̇
(Eq. 1)̇
kJ/h Heat contenṫ
kg/h Mass flow ratekJ/kg Specific enthalpy
The specific enthalpy variation can be written as follows:
(Eq. 2)
kJ/(kg ºC) Specific heat capacity
ºC Cooling/heating of the stream
It results:
̇ ̇
(Eq. 3)
The heat source temperature is an essential parameter since it determines the magnitude of the temperature difference between heat source and sink, which influence the maximum theoretical efficiency of energy conversion (to thermal, mechanical or electrical energy), heat transfer rate and heat exchangers design and material. Generically, the maximum heat obtainable from a hot stream without applying extra energy to cooling is its cooling to ambient temperature (25ºC). However, temperatures of 30 - 40ºC are more representative of industrial atmosphere. Also, cooling down to dew points can be a limitation for example when the fuel has much sulphur content and condensation must be avoided due to deposit and possible corrosion of the heat exchanger surface.
The conversion efficiency investigated in this work concerns only thermal to electric power conversion, and will depend on the adopted technology, namely ORC. The heat absorbed by the receptor source is equal to the heat given by the hot source:
̇
̇
(
) ̇
(Eq. 4)
̇
kJ Heat absorbed by the receptor source
kJ/kg Enthalpy at the inlet/outlet of
the heat exchanger
Enthaply of the working fluid
Enthaply of the heat stream
̇
kg/h Receptor stream mass floẇ
kg/h Heat source mass floẇ
(Eq. 5)̇
W Heat transfer rateW/( m2 ºC)
Heat transfer coefficient
A
m2 Exchange area
ºC Temperature difference between two streams
Waste heat sources can be categorized into ranges according to temperature, generically low- (< 200ºC), medium (200-600ºC) and high-grade (> 650ºC), but this can vary among industrial sectors (Ferland et al., 2013). Low-grade heat streams present a challenge to heat exchangers (HX) both because latent heat (condensation) becomes interesting to exploit, additionally to sensible heat (Figure 2.2), and the smaller ∆T demands higher exchange surface (Figure 2.1).
Figure 2.1 - The influence of temperature differential between heat source and sink on the heat exchange surface area varying with heat transfer coefficient (U).
Figure 2.2 - Heat recovery curve for natural gas-fired boiler (adapted from BCS
Incorporated, 2008).
Heat transfer rates in the heat exchangers (HX) are dependent on the composition and phase of the streams, which will both determine heat capacity and thermal conductivity. Generic hot streams in industry can be gaseous (e.g. combustion exhaust gases, process off-gases, cooling air), liquid (e.g. cooling water) or solid (e.g. hot slag). It is possible to refer also to ―condensing sources‖ such as surplus steam from production process or steam from cooling loops.
The chemical compositions of the stream do not directly influence the quality or quantity of the available heat unless the chemical composition has fuel value which can be exploited, for example, through combustion of the stream (e.g. coke oven gas). However, HX exposed to unclean gases, for example, can become coated or suffer from fouling. The composition of combustion exhaust gases will depend on raw materials and used fuels, but mainly it is undesirable the presence of acid (H2S, SOX, NOX, HCl, HF), caustic (e.g. NH3) and oxidizing gases (e.g. O3). These pollutants can be present in gaseous emissions during drying, calcining and firing processes. Gaseous fuels are virtually sulphur-free, but solid fuels and fuel oils contribute to sulphur oxides on combustion. Anyway, basic compounds from raw materials (e.g. CaO formed by dissociation of CaCO3 during ceramic firing) can reduce sulphur emissions by reacting with sulphur oxides (EC, 2007a).
also used to maintain thermal efficiency (EC, 2001). Anyway, this is not as important for WHR devices operating downstream of flue-gas cleaning systems.
Besides all the discussed factors limiting actual heat availability for recovery, others such as economies of scale and the installation operating schedules can determine the feasibility of a given heat recovery application. Small-scale operations are less likely to install heat recovery (HR) strategies because payback periods may be longer; discontinuous operating periods can mean great variance in hot source temperature and be incompatible with HX material or the HR system. In these situations, additional systems may be required to provide heat when the waste heat source is not available (e.g. regenerators).
2.3
Sources of Low-grade Waste Heat and Potential for Power GenerationThe following section will provide an overview on the characteristics and opportunities of low-grade waste heat sources available on the manufacturing industry, and their potential for power generation, whereas Chapter 5 provides conclusions specifically to Portuguese manufacturing industrial installations. Common sources and specific sources according to production processes of each industrial sector will be reviewed. A full description of the sectors and manufacturing processes can be raid on respective Best Available Technology reference documents (BREF) that have been adopted under both the IPPC Directive (2008/1/EC) and the IED.
2.3.1 Cross-cutting sources in Industry
Common to several industrial sectors is the use of furnaces, kilns, ovens, boilers, compressors and internal combustion engines (ICE) that can provide valuable waste heat. However, not all is recoverable for electric power generation due to limiting factors as the ones summarized just before.
For additional understanding, furnaces and kilns are very similar in design, and are closely related to dryers. The major difference is that dryers only have an outer metal shell, whereas furnaces and kilns have refractory bricks for insulation. Furnaces that operate at temperatures under 500°C are generally called ovens. Kilns are furnaces used for non-metallic mineral products (Naik et al.).
Waste-gas heat losses of fuel-fired furnaces, kilns, boilers, ovens and dryers are unavoidable. A portion of the fuel combustion heat is transferred to the heating device and its load, which can be a receptor working fluid or final products. When the energy transfer reaches its practical limit, the spent combustion gases are exhausted holding valuable thermal energy. Reducing exhaust losses should always be the first step to raise device efficiency, but once that goal has been met, WHR can be considered. Direct heat recovery (to process, charge and/or combustion air preheating), use of recuperators, regenerators, economizers and waste heat boilers are some common recovery strategies (DOE, 2004).
There are several types of furnaces, being some transversal to several industrial sectors and other specific to one. They vary in operating times (batch or continuous), fuels and heat recovery strategies. Furnaces operate with low efficiencies against, for example, 80-85% efficient natural gas fired boilers. Therefore, exiting waste gas energy is of higher quality in the first and lower in the second, reaching temperatures of 230-600ºC for drying and baking ovens and 425-650ºC for heat treatment furnaces. However, boilers are largely available in several industries and can account from 10 to 80% of total energy consumption. A total of unrecovered waste heat from boilers was estimated in 105587 TJ annually for U.S. (BCS Incorporated, 2008). Steam generation is greatest in the chemicals, refining, food, paper and primary metals industries. The application of economizers in condensing and non-condensing boilers to recover heat from flue-gases is a tested technology and can raise boiler efficiency from 1 to 15% (Carbon Trust, 2011). Flue gases of a non-recovered boiler range 260ºC against 150-170ºC of recovered boilers. Dryers are widely used in several industrial sectors. Heat is normally discharged as warm humid air.
demand (Worrel et al., 2008). Recovery of ―high‖ grade heat comes from ―de-superheating‖ the refrigerant between the compressor and condenser, on common temperatures between 60-90ºC and up to 110ºC. Recovery of ―low‖ grade heat comes from the refrigerant being condensed between 20 to 40ºC (Carbon Trust, 2011). It has been estimated that approximately 14.6 kWh of recoverable heat is available for each 1.7 m3/h of compressor capacity. However, recoverable heat from a compressed air system is normally insufficient to be used to produce steam directly or drive a power cycle (EC, 2009).
Internal combustion engines (ICE) can only convert about one third of the fuel energy into mechanical power (Saidur et al., 2012). Gas turbines are known for their relatively low efficiency, especially under partial load, with flue gases typically between 370-540ºC. Cogeneration is usually desired, but a bottoming power cycle can also be considered. A universal design of binary units should be procured for greater cost-effectiveness (Lukawski, 2009). Basically, there are four engine waste heat streams that can be recovered by a bottoming cycle: exhaust gas, charge air, jacket water, and lubricating oil (Paanu et al., 2012).
Other less common sources for heat valorisation are the hot streams before abatement systems, which need usually cooling. If a waste heat recovery for power generation (WHRPG) system is to be applied, the electricity consumption of the waste treatment can be covered (HREII, 2013a).
Different industries have a different threshold for what they characterize as low temperature and thus low-grade waste heat sources. For example, in the glass and metal industries, low temperature is anything below 315°C; in facilities that produce food and beverages, is below 80°C. Others, such as the petroleum refining and chemicals sectors, have a similar range (170-200°C). Nevertheless, criteria applied to heat streams such as state, flow rate, heat content, source and temperature can be used to identify potential candidates of waste heat recovery technologies (Ferland et al., 2013).
2.3.2 Sources by Industrial sector and Heat Recovery practices
Inside the project HREII, a study was conducted to identify the potential for HR in each NACE sectors, and the results are summarized in Table 2.2. In theory, heat recovery can be applied to other sectors, but only the ones for which it is possible to intervene at current state of the art and/or with real cases of applications were selected (Rossetti, 2010).
When ―low interest‖ is defined, it can be due to a combination of factors such as technological limitations for dirty heat sources or with modest thermal waste, low standardization of processes and systems that hinder the planning and design, applications that involve a limited number of actors with limited recovery, and economic and legal barriers.
Table 2.2 - Potential for heat recovery on manufacture industrial sectors (adapted from Rossetti, 2010).
Potential for heat recovery of Manufacturing Industry sectors (NACE Rev. 3)
Low Medium High
C10 – Food products
C16 - Wood and products of wood and cork, except furniture; manufacture of articles of straw and plaiting material
C23.1.1 - Flat glass
C19 - Coke and refined petroleum products C23.2 - Refractory products
C20 - Chemicals and chemical products C23.5 - Cement, lime and plaster
C31 - Furniture
C23 - Other non-metallic mineral products C23.6 - Articles of concrete, cement and plaster
C24.4 - Basic precious and other non-ferrous
metals C24.1 - Basic iron and steel
FDM, Meat production & Tobacco
Food, drink and milk industries (FDM) require electrical and thermal energy for virtually every step of the process, thus cogeneration is a valuable alternative for the sector. Whereas the process heating is the main consumer in FDM installations (29% of the total energy used in the sector), followed by process cooling and refrigeration (about 16%), for example at slaughterhouses the refrigeration plant is the biggest consumer of electricity (45-90%) (EC, 2006).
Sources of heat recovery can be exhaust gases from dryers and steam boilers, cooling of air compressors and fridges, cooling towers, stack gases from slaughterhouses, installations for instant coffee extraction, among many others. It was estimated for UK that about 85% of the energy consumption in the food and beverage industry, including animal production, is consumed at temperatures of less than 300ºC, and about 5 to 7% of total energy consumed in the sector is wasted and assumed to be of low-grade (Law et al., 2011). Besides generic unit operations as compressors and boilers, Table 2.3 summarizes sector specific operations.
Table 2.3 - Sources of low-grade heat in food processing industry (Law et al., 2011).
Waste Heat Source
Process Equipment Type Temperature (ºC)
Cooking Fryers, Ovens Gas/vapour 150-200
Drying Spray / rotary dryers Air/vapour 110-160
Evaporation & Distillation Steam ~100
Refrigeration Water ~60
Chemicals and Refining
It was chosen to incorporate a reference to the Refining sector, which does not belong to the Manufacturing Industry, with the reasons that follow.
Petroleum refining and chemicals stand out as the sectors with the highest uses of energy in OECD, and are stated to have together the largest potential for waste energy recovery after Forest Products (Ferland et al., 2013). They share some characteristics that create a good overlap for the potential candidate WHR technologies for both industries such as the remaining unrecovered waste energy is low-temperature (~200°C) and distributed across large plant sites.
The Institute for Industrial Productivity (IIP) and Texas Industries of the Future (TXIFOF) organized a Technology Forum (Houston 2012) from which resulted a report characterizing the low-temperature waste energy streams in both sectors, and their potential both for thermal to thermal recovery or energy conversion. Four WHRPG technologies were compared, among which ORC that was evaluated in an early study1 to have 95% of its market in chemical and refining sectors, being 71% considered economically viable. In the same Forum it was evaluated the feedback from major sectors‘ manufacturers, and concluded that more than 50% would follow up ORC and fuel cells technologies for potential applications in their industries.
Refining
Typical refinery waste heat streams origin from processes such as atmospheric distillation, vacuum distillation, fluid catalytic cracking, hydrocracking, hydrogen plants, catalytic reforming, hydrotreating and hydrorefining. Despite the high level of heat integration and heat recovery normally applied in refineries, crude distillation units are among the most energy intensive units, followed by hydrotreating. Specific consumption of CDU goes from 400 to 800 MJ/t to heat total volume of crude to processing temperature of 350ºC; exhaust gas temperature of 400ºC can be observed (Campana, 2012; EC, 2003).
1
The waste heat streams associated with the referred processes were estimated to support ORC systems in a power range from 0.75 to 5 MWe. Maier et al. (1979) estimated that about 55% of the total wasted energy in a refinery with capacity of 200 000 bbl/day is discharged through air and water-cooled heat exchangers. About 30% of that thermal power was estimated to be of low-grade. If only 65% of the low grade wasted heat could be rejected to ORC system, for which was assumed a thermal efficiency of only 10%, almost half of the studied refinery electricity demand would be satisfied (Meacher, 1981).
Figure 2.3 - Energy losses by source and process unit in a 200 000 bbl/d refinery plant (adapted from Meacher, 1981).
Chemicals
In chemical plants, stack gases from thermal oxidizers, fired heaters, process heaters, fired furnaces and pressurized corrosive gases are typically between 180-200ºC and can provide an estimated 8 600 GWh of electricity generation yearly for the U.S.A. (Ferland et al., 2013).
The chemical industry comprehends numerous processes to produce numerous products, from detergents to pesticides. Some consume a large amount of energy, such as for fertilizers (ammonia), whereas others provide a net energy gain (e.g. through exothermic reactions), such as from nitric and sulphuric acid (Figure 2.4). As an example, from the primary sulphur burning, plus the catalyst bed and process gas cooling, up to 67% of the overall waste heat can be recovered as high pressure steam; from the acid cooling system, up to 30-40% for drying processes as low pressure steam. About 1.5% is lost is stack gases (EC, 2007b).
Figure 2.4 - Generic wet sulfuric acid process and opportunities for HR.
Heat exchange between streams is well established in the inorganic and organic chemical plants. The high amount of surplus heat available from processes units‘ flue-gas requires the design of an efficient overall steam system in which high pressure steam is generated. At several pressure levels, the steam will or can be used to feed steam turbines to drive compressors and/or generate electricity,
0% 25% 50% 75% 100%
Atmospheric & Vacuum destillation
Alkylation Catalytic cracking
Catalytic reforming Refinery unit process energy losses by unit (%)
Miscellaneous & Endothermic
Water cooler
Air cooler
drive pumps and fans and feed processes direct (steam injection) or indirectly (heat exchange). Also, exothermic reactions need temperature control that can be made using absorbing fluids (e.g. thermal oil) which become superheated and can be used for further thermal processes, steam and power generation. Modern ammonia plants do not import energy to drive mechanical equipment, but in fact in most cases energy is exported to other consumers either as steam or as electricity.
Rubber and Plastics
Energy is needed for the production of polymers, even if the process is exothermic. The demand for energy also depends if the polymerisation unit is integrated into a larger complex with the need for low pressure steam, for example.
Around 95% of the energy required to process the polymer escapes during the process as heat through radiation, convection and conduction. BAT practices for heat recovery account for the waste heat from incinerators, purge streams and thermal oxidizers, which can be exploited through steam or hot oil generation used for process heating (EC, 2007c).
Heat from the fumes of spread fabrics and forming machines are usually not suitable for heat exchanging due to the contamination by polymeric substances. Njobet (2012) analysed the total heat exchange during a polymer (polyamide) extrusion process and calculated that 8.1 kWth/ton molten polyamide is wasted during cooling, raising the temperature of cooling water up to 45ºC.
Ceramics
The primary energy use in ceramic manufacturing is for kiln firing and, in many processes, drying of intermediates or shaped ware is also energy intensive. The firing process takes place with temperatures between 650 and 2 000ºC, depending on the ceramic products, with typical exhaust temperatures ranging from 100 to 500ºC (see Table AI 1 for operating data). Firing can use different types of kilns (e.g. intermittent, continuous, rotary) and can include more than one firing phase (e.g. household ceramics are fired between one and four times). Intermittent kilns can be used to produce specialized ceramic products and are operated at lower feed rates. Roller kilns are now almost universally used for wall and floor tile production, rotary kilns for the manufacture of expanded clay aggregates and tunnel kilns are used in a wider range of ceramic industry sectors.
As many other high temperature furnaces, ceramic kilns are highly inefficient and there is a high thermal recovery potential often due to rejected heat mass flow and moderate temperature of the kiln system flue-gases. Only about 5 to 20% of the energy input is used to fire the product and about 50 to 70% would be lost in cooling air and kiln exhaust gases if not for HR strategies. It is possible to distinguish the pre-heating, firing and cooling sections in continuous kilns (Figure 2.5 (a)), even if more exhaust outlets can exist. Exhaust air from cooling area is often recovered to dryers, with or without the supplement hot air from gas burners. Exhaust gases from kiln can be recovered through heat exchangers to preheat the combustion air, but this application can be limited due to corrosion problems caused by acid combustion gases and often to flue-gas low temperatures (100 to 300ºC, depending on the product to be fired). The cooling air stream is usually at slightly lower temperatures but its considerable volumes of clean hot air makes it the best candidate for supplying driers, greenhouses and potteries, feed the kiln combustion air or district heating & cooling systems. Excess heat from an afterburner (thermo-reactor, thermal oxidizers) can also be used, either in the kiln or in the dryer (EC, 2007a).
Figure 2.5 - Schematic diagram of a generic tunnel kiln (a) and an example of a combined heat recycling system (b) (adapted from EC, 2007).
Glass
Glass making is a high temperature, energy intensive activity, and in general the energy necessary for melting glass accounts for over 75% of the total energy requirements of glass manufacture (EC, 2013b).
The majority of the glass melting takes place in continuously operated melting furnaces, with discontinuous melting (e.g. pot furnaces or day tanks) being used for the production of special glass products. There are many furnace designs in use, and they are usually distinguished in terms of the method of heating (fossil fuel, electricity or both), the combustion air preheating system employed (regenerative or recuperative), and the burner positioning.
A modern regenerative container furnace, cross-fired or end-fired, will have an overall thermal efficiency of around 50% (maximum 60%), with waste gas losses of around 30%. The term ‗regenerative‘ refers already to the form of heat-recovery system inherent to the furnace that preheats air prior to combustion (Figure 2.6). Less efficient heat recovery is made through a metal heat exchanger on conventional recuperative furnaces. Oxy-fuel melting involves the replacement of the combustion air with oxygen (> 90 % purity), reducing the majority of the nitrogen from the combustion atmosphere and thus the volume of waste gases by about two thirds. These furnaces do not utilize heat-recovery systems to preheat the oxygen supply to the burners, and therefore it is more likely to recover waste heat by preheating load and using waste heat boilers for electricity generation (BCS Incorporated, 2008). In electric furnaces the absence of combustion leads to extremely low waste gas volumes.