______________________________________________________________________________________________________
1,3,4,5 Department of Agricultural Engineering, University of Goiás – UEG, Anápolis, Goiás, Brazil
2 Biosystems Engineering Department, “Luiz de Queiroz” College of Agriculture/University of São Paulo – ESALQ/USP, Piracicaba, São
Article
________________________________________________________________________________________________ Ciências Ambientais Environmental Sciences
Reference Evapotranspiration Estimation In Climate
Change Scenarios For Rio Verde In The State Of Goiás,
Brazil
Lucas C. Santos1, Fabiani D. Bender2, Elton F. Reis3, Guilherme H. T. Cruz4 & Frank F. Capuchinho5
* Corresponding Author: [email protected] Received: June 2, 2017 Todos autores contribuíram de forma igualitária Accepted: June 24, 2017
Published: July, 2017
ABSTRACT
Long-term changes in evapotranspiration can have extreme effects in hydrological processes as well as crop yields. The objective of this study was to quantify the expected changes in evapotranspiration in climate change scenarios using the Penman Monteith/FAO56 (PM) standard method and empirical equations for estimating reference
evapotranspiration (ET0), specifically for the conditions of Rio Verde, in the state of Goiás, Brazil. Data from the National
Institute of Meteorology, and Meteorology and Hydrology System of the State of Goiás were used to estimate the ET0
by using the following methods: Modified Penman, Radiation, Blaney-Criddle, Hargreaves-Samani, and Priestley-Taylor
and Turc, which were compared with the PM method on the daily scale. From the ET0 obtained in each of these
methods, their performance was evaluated through statistical indices in four future climate scenarios. The projections originated from two emission scenarios based on the HadGEM2-ES global climate model with medium (2040-2069) and long (2070-2099) term scenarios. The results presented that the Radiation and Turc methods are currently—and can be
under the predicted conditions of future climate scenarios—the best options for estimation of ET0 in Rio Verde, when
meteorological data are not available to implement the PM method. The Modified Penman and the
Hargreaves-Samani methods should not be considered for estimating ET0 in the location evaluated.
Keywords: Global climate model, evapotranspirometric demand, irrigated agriculture
Introduction
Global climate change has become more significant in the last decade. Climate change is studied from different perspectives, such as socioeconomic, technical, and scientific. The agricultural activity — which normally encompasses these three perspectives — has significant concerns about the potential repercussions of climate change on water resources that agriculture is economically dependent (MOLINA, 2015).
Based on future climate projections, changes in the total accumulated rainfall and the increase in air temperature (AMBRAZZI et al., 2007; MARENGO, 2009; PBMC, 2013) will result in a higher atmospheric water demand. This is a worrying scenario because high water deficits are expected, and agriculture is the central axis of rural activity. Therefore, information on evapotranspiration (ET) is a valuable tool in water management, since it is used to define the water demand for crops, and irrigation
management strategies. However, the ET measurement is rarely explicitly made; usually it is conceptually quantified from the reference evapotranspiration (ET0) (ALLEN et al., 1998).
Among the various existing methods for ET0
estimation, the Penman-Monteith (PM) model is the one with the greatest application and acceptance by the scientific community, due to its satisfactory performance in both temperate and tropical climates. Although the PM method is considered standard, its use demands climatic elements that are not usually measured in meteorological stations, which has led to the adoption of empirical methods. These methods require local calibration before being used, thus avoiding significant errors in the ET0
estimation.
According to Koedyk and Kingston (2016), despite the uncertainties connected with climate changes and the different methodologies to estimate ET, studies that cover this issue are relevant, even at the local scale. These studies help to create
strategies to manage the possible increase in water demand for crops, and therefore, will enable the rational use of water resources.
The objective of this study was to quantify the expected changes in evapotranspiration in climate change scenarios using the Penman Monteith/FAO56 (PM) standard method and empirical equations for estimating reference evapotranspiration (ET0), specifically for the
conditions of Rio Verde, in the state of Goiás, Brazil.
Material and Methods
The municipality of Rio Verde, in the state of Goiás, Brazil (17°47'53''S, 51°55'53''W and altitude of 748 m) has an Aw (Savana Tropical) climate, with a dry winter and rainy summer, according to the Köppen classification. The region has an average annual temperature of 20 to 25°C, and average annual precipitation above 1,500 mm.
The reference evapotranspiration (ET0) was
estimated using the data collected from 1986 to 2016 by the automatic collection platform of the Meteorology and Hydrology System of the State of Goiás (SIMEHGO, in portuguese) and the National Institute of Meteorology (INMET, in portuguese). The meteorological variables considered were: solar radiation (MJ m-2 day-1); insolation (hours);
maximum, minimum and average air temperature (°C); average relative air humidity (%); average wind speed (m s-1); and atmospheric pressure (hPa).
Failures were filed using the grid database developed by Xavier et al. (2015), which consists of interpolation of daily data from several sources, and is available in horizontal spacing of 0.25° latitude and 0.25° longitude.
Future climate projections were developed from two emission scenarios based on the global climate model (GCM) HadGEM2-ES, which is part of the Coupled Model Intercomparison Project Phase 5 – CMIP5 (CMIP, TAYLOR; STOUFFER, MEEHL, 2009). This GCM was one of the models used in the future climate projections of the fifth assessment report of the Intergovernmental Panel on Climate Change (IPCC-AR, IPCC, 2013). Such climate change projections developed by CMIP5 are conducted in four concentration or emission scenarios called Representative Concentration Pathways (RCPs), and represent expected conditions in the future for the total radiative forcing by the end of this century. In this study, the scenarios RCP4.5 and RCP8.5 were used. The first is an intermediate emission scenario and the second a high emission scenario, with radiative forcing values at the end of this century, assuming values of 4.5 and 8.5 W m-2, respectively.
To generate the future scenarios the delta method (WILBY et al., 2004) was used. This method consists in adding the delta value of the monthly change projected by the GCM to the temperature variable and multiplying the change to the rain variable, imposed daily to the historical database
changed, this means, the same values of the historical database were considered. The projections were performed for medium (2040-2069, MT) and long (2070-2099, LT) terms periods, in an intermediate (RCP4.5) and high emission scenario (RCP8.5), resulting in four future climate scenarios: RCP4.5MT, RCP8.5MT, RCP4.5LT, and RCP8.5LT.
The computational program REF-ET (ALLEN, 2000) was used to estimate the ET0 from the
meteorological elements of each of the four future scenarios by using the following methods: Modified Penman/FAO24, Radiation/FAO24, Blaney-Criddle/FAO24, Hargreaves-Samani (1985), and Priestley-Taylor and Turc (1961). These methods were compared with the Penman-Monteith/FAO56 (PM) standard method on the daily scale.
Regression analysis was performed with the daily ET0 data, and the values obtained by the tested
methods were correlated with those of the standard method for the annual period and for each of the future scenarios. The performance analysis was based on the following parameters: coefficients of the regression equation (β0 and β1), coefficient of
determination (r2), mean relative error (MRE), root
mean square error (RMSE), and performance index (c) obtained from the product between the coefficient of correlation and the agreement index.
Results and Discussion
It is expected that an increase in the atmospheric CO2 will cause an increase in
temperature, which would lead to higher evapotranspiration. This expectation was confirmed in Rio Verde, GO, Brazil (Figure 1), which presented percentage variations between the temperature and ET0 estimated from the standard PM method in
the conditions of the future scenarios compared to the current climatic conditions.
The future climate model showed an increase in air temperature up to 23.2% in the RCP8.5LT scenario. This result would represent temperature of 5.8°C higher than the average temperature observed in the period from 1986 to 2016, which are in accordance to those presented by the 5th IPCC Report (IPCC, 2013). This report estimated the worst case scenario, showing an increase of CO2 of
approximately 130% in the atmosphere by the end of the 21st century. When the other future climate scenarios was considered, the temperature variations were more moderate but still significant, with average of 8.8%, 11.5%, and 11.5% for the RCP4.5MT, RCP8.5MT, and RCP4.5LT scenarios, respectively.
The variations found in the evapotranspiration were slightly lower than those from the air temperature. During the spring, the highest temperatures were recorded, reaching the maximum of 16.2% in the RCP8.5LT scenario. In the other future climate scenarios, the increments in the ET0 in relation to the current climatic conditions were
of 5.3% (RCP4.5MT), 7.2% (RCP8.5MT), and 7.0% (RCP4.5LT). The ET0 estimation methods — Penman
Modified/FAO24, Radiation/FAO24, Blaney-Criddle/FAO24, Hargreaves-Samani (1985), and
Priestley-Taylor and Turc (1961) — were compared to the standard PM method to current conditions and future scenarios (Table 1).
Figure 1. Annual variation in temperature (A) and ET0 (B) estimated by the Penman-Monteith/FAO56 method using an average
of 30 years for current (1986-2016) conditions and future climate scenarios, with intermediate (RCP4.5) and high (RCP8.5) emissions in the medium (2040-2069) and long (2070-2099) terms.
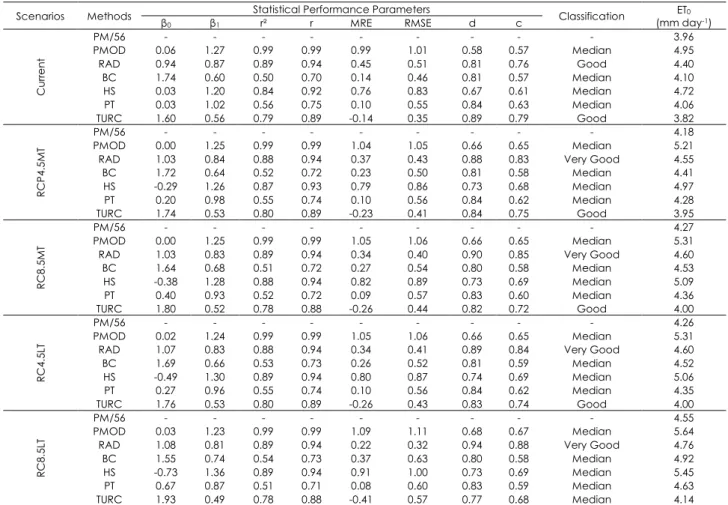
Table 1. Regression parameters (β0, β1), coefficient of determination (r2), coefficient of correlation (r), mean relative error (MRE),
root mean square error (RMSE), concordance index (d), and confidence or performance index (c) of daily ET0 in Rio Verde,
Goiás, Brazil, for current climate scenarios (1986-2016) and future scenarios.
Scenarios Methods Statistical Performance Parameters Classification ET0
(mm day-1) β0 β1 r² r MRE RMSE d c Cu rre nt PM/56 - - - 3.96 PMOD 0.06 1.27 0.99 0.99 0.99 1.01 0.58 0.57 Median 4.95 RAD 0.94 0.87 0.89 0.94 0.45 0.51 0.81 0.76 Good 4.40 BC 1.74 0.60 0.50 0.70 0.14 0.46 0.81 0.57 Median 4.10 HS 0.03 1.20 0.84 0.92 0.76 0.83 0.67 0.61 Median 4.72 PT 0.03 1.02 0.56 0.75 0.10 0.55 0.84 0.63 Median 4.06 TURC 1.60 0.56 0.79 0.89 -0.14 0.35 0.89 0.79 Good 3.82 RCP 4. 5M T PM/56 - - - 4.18 PMOD 0.00 1.25 0.99 0.99 1.04 1.05 0.66 0.65 Median 5.21
RAD 1.03 0.84 0.88 0.94 0.37 0.43 0.88 0.83 Very Good 4.55
BC 1.72 0.64 0.52 0.72 0.23 0.50 0.81 0.58 Median 4.41 HS -0.29 1.26 0.87 0.93 0.79 0.86 0.73 0.68 Median 4.97 PT 0.20 0.98 0.55 0.74 0.10 0.56 0.84 0.62 Median 4.28 TURC 1.74 0.53 0.80 0.89 -0.23 0.41 0.84 0.75 Good 3.95 RC8 .5M T PM/56 - - - 4.27 PMOD 0.00 1.25 0.99 0.99 1.05 1.06 0.66 0.65 Median 5.31
RAD 1.03 0.83 0.89 0.94 0.34 0.40 0.90 0.85 Very Good 4.60
BC 1.64 0.68 0.51 0.72 0.27 0.54 0.80 0.58 Median 4.53 HS -0.38 1.28 0.88 0.94 0.82 0.89 0.73 0.69 Median 5.09 PT 0.40 0.93 0.52 0.72 0.09 0.57 0.83 0.60 Median 4.36 TURC 1.80 0.52 0.78 0.88 -0.26 0.44 0.82 0.72 Good 4.00 RC4 .5LT PM/56 - - - 4.26 PMOD 0.02 1.24 0.99 0.99 1.05 1.06 0.66 0.65 Median 5.31
RAD 1.07 0.83 0.88 0.94 0.34 0.41 0.89 0.84 Very Good 4.60
BC 1.69 0.66 0.53 0.73 0.26 0.52 0.81 0.59 Median 4.52 HS -0.49 1.30 0.89 0.94 0.80 0.87 0.74 0.69 Median 5.06 PT 0.27 0.96 0.55 0.74 0.10 0.56 0.84 0.62 Median 4.35 TURC 1.76 0.53 0.80 0.89 -0.26 0.43 0.83 0.74 Good 4.00 RC8 .5LT PM/56 - - - 4.55 PMOD 0.03 1.23 0.99 0.99 1.09 1.11 0.68 0.67 Median 5.64
RAD 1.08 0.81 0.89 0.94 0.22 0.32 0.94 0.88 Very Good 4.76
BC 1.55 0.74 0.54 0.73 0.37 0.63 0.80 0.58 Median 4.92
HS -0.73 1.36 0.89 0.94 0.91 1.00 0.73 0.69 Median 5.45
PT 0.67 0.87 0.51 0.71 0.08 0.60 0.83 0.59 Median 4.63
TURC 1.93 0.49 0.78 0.88 -0.41 0.57 0.77 0.68 Median 4.14 PM56 = Penman Monteith/FAO56; PMOD = Modified Penman; RAD = Radiation; BC = Blaney-Criddle; HS = Hargreaves-Samani; PT = Priestley-Taylor; TURC = Turc.
0 5 10 15 20 25 Te mp e rat u re vari a tion ( %) RCP4.5MT RCP8.5MT RCP4.5LT RCP8.5LT 0 5 10 15 20 25 ET o vari a tio n (%) RCP4.5MT RCP8.5MT RCP4.5LT RCP8.5LT A B
The methods that presented the best performance
in the current climate scenario, in comparison to the
standard PM method, were the Radiation and Turc. Both were classified as “Good” for the climatic conditions of the location evaluated. The first had an overestimation of 0.45 mm day-1 and the second
an underestimation of 0.14 mm day-1. Despite the
simplicity of the ET0 estimation of these two methods
when compared to the PM standard, preference should be given to the Radiation method when wind speed data are available because it has a more explicit input for the aerodynamic term; this may be significant in areas subject to advective effects, especially for those with irrigation (PRADO and LEAL, 2016). The other methods were classified as "Medians". Similar results were found by Oliveira et al. (2001) and Oliveira et al. (2005) in studies on estimation of ET0, also in the state of Goiás.
In general, all methods showed an increase in evapotranspiration for future climate scenarios from 2040 to 2099. These results were expected, since the global climate model HadGEM2-ES projected increases in temperature, which is believed to accelerate the processes of evaporation and transpiration. The highest evapotranspiration were found by the Modified Penman method, with an overestimation of up to 1.09 mm day-1 in the
RCP8.5LP scenario.
The radiation method has been efficient in current climate conditions, and also presented satisfactory performance for the other scenarios— including an improvement in its classification, which was observed using the confidence index—and was classified as “Very Good” in all future scenarios. These results place it as an alternative to the standard PM method when data to implement the latter is not available.
The Turc method remained the second best alternative under future scenario conditions, and its satisfactory performance is believed to be justified by the occurrence of average relative air humidity greater than 50% in 11 months out of the year; this is similar to the climate in the western region of Europe, where the Turc method was developed and where its application is recommended (KASHYAP and PANDA, 2001).
The other methods evaluated in future climate scenarios presented "Median" performance; however, their use should be avoided, especially those of Modified Penman and Hargreaves-Samani, which had average overestimate of 25% and 20%, respectively. Cavalcanti Júnior et al. (2011) evaluated ET0 estimation methods in humid periods
of the semiarid region of the Northeast of Brazil and found similar results using Modified Penman method. In this study, the results of the Hargreaves-Samani method was expected because it was originally developed for the climatic conditions in the state of California in the United States, which has semiarid climate and, therefore, is different from the climatic conditions of Rio Verde.
Finally, it is believed that the results presented in this study may be useful in the development of water resource management strategies, especially for those connected to irrigated agriculture, since it is the largest freshwater user among the economic sectors. However, these results are conditioned to the maintenance of the PM method as the standard equation for ET0 estimation. These results depend on
several factors, such as: the future scenario of CO2
emission, the climate system sensitivity to the forcing promoted by greenhouse gases, and the plant’s responses to atmospheric gas dynamics. The later is probably the most relevant because it considers resistance parameters—stomatal and shoot characteristics—that puts the PM method in the condition of reference.
Conclusions
The results presented that the Radiation and Turc methods are currently — and can be under the predicted conditions of future climate scenarios — the best options for estimation of ET0 in Rio Verde,
when meteorological data are not available to implement the PM method.
The Modified Penman and the Hargreaves-Samani methods should not be considered for estimating ET0 in the location evaluated.
Acknowledgement
The authors thank the National Institute of Meteorology (INMET) and the Meteorology and Hydrology System of the state of Goiás (SIMEHGO), Brazil, for their meteorological data used in this research, and the funding agency Coordination for the Improvement of Higher Education Personnel (CAPES, in portuguese) for the post doctoral scholarship of the first author and also the financial support through funding PNPD/CAPES (Agreement UEG/CAPES N. 817164/2015-PROAP).
References
AMBRAZZI, T.; ROCHA, R. P.; MARENGO, J. A.; PISNITCHENCO, I.; NUNES, L.; FERNANDEZ, J. P. R.
Cenários regionalizados de clima no Brasil e América do Sul para o século XXI: Projeções de clima futuro usando três modelos regionais –
Relatório n°3. Ministério do Meio Ambiente; Secretária da Biodiversidade e Florestas; Diretoria de Conservação e Biodiversidade, p. 73, 2007. CAVALCANTI JÚNIOR, E. G.; OLIVEIRA, A. D.;
ALMEIDA, B. M.; ESPÍNOLA SOBRINHO, J. Métodos de estimativa da evapotranspiração de referência para as condições do semiárido Nordestino. Semina, Londrina, v.32, p.1699-1708, 2011.
IPCC 2013 Climate Change 2013: The Physical Science Basis. Working Group I Contribution to the
Intergovernmental Panel on Climate Change Fifth Assessment Report (Cambridge: Cambridge
University Press)
KASHYAP, P. S.; PANDA, R. K. Evaluation of evapotranspiration estimation methods and development of crop-coefficients for potato crop in a sub-humid region. Agricultural Water
Management, Amsterdan, v. 50, n. 1, p. 9-25, 2001.
KOEDYK, L. P.; KINGSTON, G. G. Potential evapotranspiration method influence on climate change impacts on river flow: a mid-latitude case study. Hidrology Research, London, v.48, n.2, p.951-963, 2016.
MARENGO, J. A. Mudanças Climáticas: Detecção e cenários futuros para o Brasil até o final do século XXI. In: CAVALCANTI, I. F. A.; FERREIRA, N. J.; SILVA, M. G. J.; SILVA DIAS, M. A. F. Tempo e Clima no
Brasil. São Paulo: Ed. Oficina de Textos, 2009. p.
407-424.
MOLINA, M. M. Climate change effects on evapotranspiration in Mexico. American Journal of
Climate Change, v.4, p.163-172, 2015.
OLIVEIRA, L. F. C.; CARVALHO, D.; F.; ROMÃO, P. A. ; CORTÊS, F. C. Estudo comparativo de modelos de estimativa da evapotranspiração de referência para algumas localidades no estado de Goiás e Distrito Federal. Pesquisa Agropecuária
Tropical, Goiânia, v. 31, n.2, p. 121-126, 2001.
OLIVEIRA, R.; Z.; OLIVEIRA, L. F. C.; WEHR, T.; R.; BORGES, L. B.; BONOMO, R. Comparação de metodologias de estimativa da evapotranspiração de referência para a região de Goiânia, GO. Bioscience Journal, Uberlândia, v. 21, n.3, p. 19-27, 2005.
PRADO, L. C.; LEAL, B. G. Meteorological variables influence analysis over Petrolina –Juazeiro pole monthly reference evapotranspiration. Latin
America Transactions, v.14, n.10, p.4373-4376,
2016.
PBMC, 2013. Contribuições do Grupo de Trabalho 1
ao Primeiro Relatório de Avaliação Nacional do Painel Brasileiro de Mudanças Climáticas. Sumário Executivo GT1 Painel Brasileiro de Mudanças Climáticas (PBMC). [s.l: s.n.]. Disponível em:
<http://www.pbmc.coppe.ufrj.br/documentos/M CTI_PBMC_SumárioExecutivo4_Finalizado.pdf>. TAYLOR, K. E.; STOUFFER, R. J.; MEEHL, G. a. A
Summary of the CMIP5 Experiment Design.
Disponível em: <http://cmip-pcmdi.llnl.gov/cmip5/docs/Taylor_CMIP5_design. pdf>.
WILBY, R. L.; CHARLES, S. P.; ZORITA, E.; TIMBAL, B.; WHETTON, P.; MEARNS, L. O. Guidelines for Use of Climate Scenarios Developed from Statistical Downscaling Methods. Analysis, v. 27, p. 1–27,
2004. Disponível em:
<http://www.ctn.etsmtl.ca/cours/mgc921/dgm_n o2_v1_09_2004.pdf>.
XAVIER, A. C.; KING, C. W.; SCANLON, B. R. Daily gridded meteorological variables in Brazil (1980-2013). International Journal of Climatology, Malen, v.36, p.2644-2659, 2015.