Origin, evolution and genome distribution of microsatellites
Eder Jorge Oliveira, Juliano Gomes Pádua, Maria Imaculada Zucchi, Roland Vencovsky
and Maria Lúcia Carneiro Vieira
Universidade de São Paulo, Escola Superior de Agricultura ‘Luiz de Queiroz’, Departamento de Genética,
Piracicaba, SP, Brasil.
Abstract
Microsatellites, or simple sequence repeats (SSRs), have been the most widely applied class of molecular markers used in genetic studies, with applications in many fields of genetics including genetic conservation, population genet-ics, molecular breeding, and paternity testing. This range of applications is due to the fact that microsatellite markers are co-dominant and multi-allelic, are highly reproducible, have high-resolution and are based on the polymerase chain reaction (PCR). When first introduced, the development of microsatellite markers was expensive but now new and efficient methods of repetitive sequence isolation have been reported, which have led to reduced costs and microsatellite-technology has been increasingly applied to several species, including non-model organisms. The ad-vent of microsatellite markers revolutionized the use of molecular markers but the development of biometric methods for analyzing microsatellite data has not accompanied the progress in the application of these markers, with more ef-fort being need to obtain information on the evolution of the repetitive sequences, which constitute microsatellites in order to formulate models that fit the characteristics of such markers. Our review describes the genetic nature of microsatellites, the mechanisms and models of mutation that control their evolution and aspects related to their gen-esis, distribution and transferability between taxa. The implications of the use of microsatellites as a tool for estimat-ing genetic parameters are also discussed.
Key words:microsatellites, molecular genetics, genetic structure of populations.
Received: November 23, 2004; Accepted: August 25, 2005.
Introduction
During the twenty-first century, the protection of bio-diversity is expected to be both crucial and continuing, with conservation genetics being of primary importance for avoiding the extinction of most endangered species along-side the ecological, political and economic aspects of bio-diversity protection. The application of molecular techniques, including genome approaches, to conservation genetics has made possible the examination of the genetics of species in danger of extinction and genetic analysis has become widely used in conservation research.
Traditional molecular markers have, in general, pro-vided insufficient statistical power and accuracy for esti-mating genetic differences but the discovery of highly variable loci such as microsatellites means that the statisti-cal power available for determining differentiation between species groups at risk of extinction is now often very high (Hedrick, 2001 and references therein).
Microsatellites, also known as simple sequence re-peats (SSR) or short tandem rere-peats (STR), are non-coding repetitive DNA regions composed of small motifs of 1 to 6 nucleotides repeated in tandem, which are widespread in both eukaryotic and prokaryotic genomes (Field and Wills, 1998; Tóthet al., 2000). Broadly used as genetic markers, microsatellites have a particular attribute in that they suffer higher rates of mutation than the rest of the genome (Jarne and Lagoda, 1996). Microsatellites are classified according to the type of repeat sequence as perfect, imperfect, inter-rupted or composite. In a perfect microsatellite the repeat sequence is not interrupted by any base not belonging to the motif (e.g.TATATATATATATATA) while in an imper-fect microsatellite there is a pair of bases between the re-peated motifs that does not match the motif sequence (e.g.
TATATATACTATATA). In the case of an interrupted microsatellite there is a small sequence within the repeated sequence that does not match the motif sequence (e.g.
TATATACGTGTATATATATA) while in a composite microsatellite the sequence contains two adjacent distinc-tive sequence-repeats (e.g. TATATATATAGTGTGTGT GT).
Send correspondence to Maria Lúcia Carneiro Vieira, Universidade de São Paulo, Escola Superior de Agricultura “Luiz de Queiroz”, Departamento de Genética, Caixa Postal 83, 13400-970 Pira-cicaba, SP, Brazil. E-mail: [email protected].
In the past few years, microsatellites have attracted the attention of researchers for a number of reasons, includ-ing their extensive use in the construction of genetic maps of several types of organisms (Knapiket al., 1998; Cregan
et al., 1999), the association between the instability of the number of repeats and human genetic diseases (Mahadevan
et al., 1992; Stallings, 1994; O’Donnell and Warren, 2002), their practicability and ease of use in studies of population genetics, and for genotyping and paternity analysis (Wright and Bentzen, 1994; Schlötterer, 2000).
Although originally designed for research in humans, microsatellite analysis has become a powerful tool for re-search on animals (Schlötterer et al., 1991) and plants (Dayanandanet al., 1997; White and Powell, 1997; Stein-kellneret al., 1997; Ciprianiet al., 1999; Roaet al., 2000; Collevattiet al., 2001). According to Heywood and Iriondo (2003), microsatellite markers provide relevant informa-tion for identifying conservainforma-tion units and for investigating the genetic processes that take place in populations such as patterns of gene flow, generation of genetic neighborhoods and the incidence of genetic drift. Currently, microsatellite markers are commonly employed for the analysis of plant population genetic structure of both wild (Zucchiet al., 2002) and crop species (Pintoet al., 2003a, b) because of their co-dominant nature and high informativeness.
More recent research based on expressed sequence tags (ESTs) suggest that the frequency of microsatellites in plants is greater than was previously thought, with Mor-ganteet al. (2002) having found that the number of micro-satellites per Mb is about 1844 inArabidopsis thaliana, 2757 in rice, 2000 in soybean, 1470 in maize and 1796, in wheat.
Until a few years ago, microsatellites were thought to be selectively neutral markers and not affected by selective pressures. However, it is now evident that the expansion of the number of repeats may cause human diseases. For ex-ample, Huntington’s disease is caused by increases in the length of a CAG motif repeat present in the huntingtin pro-tein gene on human chromosome 4 (Moxon and Wills, 1999), and an increasing number of neurodegenerative dis-orders have been related to expanded microsatellite repeats, mainly in the tri-nucleotide class (Goldstein and Schlot-terer, 1999; Cummings and Zoghbi, 2000; Everett and Wood, 2004). Quite interesting is the fact that micro-satellites are preferentially associated with non-repetitive DNA in plant genomesi.e.they frequently occur within and near genes (Morganteet al., 2002).
Genetic Features of Microsatellites
An homozygous microsatellite locus has the same number of repeats on both homologous chromosomes, whereas a heterozygous microsatellite locus has a different number of repeats for each allelee.g.one allele can contain 9 repeats and the other 10. However, at the same locus the population as a whole usually contains several alleles each
with a different number of repeats, which means that micro-satellite markers are very useful for discriminating different individuals. Assuming thatmis the number of alleles in a population, the maximum number of different genotypes (NDG) will bem(m+ 1)/2 and the number of possible het-erozygous genotypes (NHG) will be m(m - 1)/2, e.g. if
m= 48, NDG = 1,176 and NHG = 1,128. The high discrimi-nating power of microsatellites is an important characteris-tic which justifies their use in population genecharacteris-tic studies and forensic science.
Mutation Mechanisms
Although microsatellites have been extensively used in a considerable number of studies covering the most var-ied areas of genetics, the mutational dynamics of these genomic regions is still not well understood (Schlötterer, 2000), although it is known that the mutation rate of micro-satellites is much higher than that of other parts of the ge-nome, ranging from 10-2to 10-6nucleotides per locus per generation (Siaet al., 2000 and references therein).
Several mechanisms have been suggested to explain the high mutation rate of microsatellites, including errors during recombination, unequal crossing-over and polymer-ase slippage during DNA replication or repair (Strandet al., 1993).
In regard to the inclusion of errors during recombina-tion, Levinson and Gutman (1987) found that strains of
Escherichia coliwith or without a functional recombina-tion system had a similar mutarecombina-tion rate, suggesting that re-combination is not the predominant mechanism in the generation of microsatellite variability.
When unequal crossing-over occurs, there can be drastic changes such as the loss or gain of a large number of repeats. This is because when microsatellite repetitive re-gions are present, a hairpin (the dark region in Figure 1) can be formed during synapsis, which means that only parts, usually unequal in length, of each chromosome will be ex-changed and one chromosome will receive a larger frag-ment because of the larger number of microsatellite repeats exchanged, the homologues chromosome receiving a smaller number of repeats.
During DNA replication or repair, DNA polymerase slippage can occur in which one DNA strand temporarily dissociates from the other and rapidly rebinds in a different position, leading to base-pairing errors and continued leng-thening of the new strand and an increase in the number of repeats (i.e.additions) in the allele if the error occurs on the complementary strand or a decreased number of repeats (i.e.deletions) if the error occurs on the parent strand (Fig-ure 2).
system for DNA loops or because of alterations in DNA polymerase or its cofactors that result in increased slippage rates. Mutations in the genes of the DNA repair system sub-stantially increase (up to 700 times) microsatellite instabil-ity inE. coli (Bichara et al., 2000), yeast (Strand et al., 1993; Siaet al., 1997) and mammal cells (Kolodner and Marsischky, 1999) while mutations affecting the DNA polymerase correction domain produce less drastic effects (Siaet al., 2000).
Mutation Rates: The Theoretical Models
An important question to be answered is which theo-retical model should be applied to correctly determine
popu-lation genetic parameters obtained from microsatellite data. Mutational models are used to derive the expected number of alleles in a population from the observed heterozygosity and also in the statistical analyses of genetic variation, but all models have some disadvantages when applied to micro-satellite data. In general, four models can be used.
Infinite alleles (IA) model
In this model, each mutation randomly creates a new allele. Applying this model to microsatellite loci, mutations alter the number of repeats. For example, an allele with 10 repeats is considered to be as closely related genetically to an allele with 15 repeats as to one with 16 repeats,i.e. prox-imity in terms of the number of repeats does not indicate a greater phylogenetic relationship. This is Wright’s (1931) classical model in which he usesF-statistics.
Stepwise mutation (SM) model
When a microsatellite locus mutates, it gains or loses a repeat. This implies that two alleles differing by only one motif are more related (i.e.share a more recent common an-cestor) than alleles differing by several repeats. Slatkin (1995) proposed a genetic differentiation measure (RST) similar to Wright’s (1951) FST and Nei’s (1973) GST but based on the SM model.
The SM model is usually preferred when estimating relations between individuals and population structure, ex-cept in the presence of homoplasy (i.e.when two alleles are identical by state but not by descent). Homoplasy may seri-ously influence population studies involving high mutation rates and large population sizes together with strong allele size constraints (Estoupet al., 2002). The model described by Slatkin (1995) is based on traits with continuous distri-bution, number of base pairs or number of repeats, and it groups individuals according to the number of repeats.
Two phase (TP) model
Di Rienzoet al. (1994) introduced this model as an extension of the SM model for studies on microsatellites. It states that most mutational events result in an increase or decrease of one repeat unit, though infrequent alterations of a large number of repeats also occur.
K-alleles (KA) model
Crow and Kimura (1970) proposed the KA model in 1970, which assumes that if there are exactlykpossible al-leles in a given locus then the probability of a given allele mutating into any other isµ/k - 1, whereµis the mutation rate.
Genesis of Microsatellites
In yeasts, it seems that no minimum number of re-peats is required for microsatellites to evolve (Pupko and Graur, 1999). Rose and Falush (1998) compared the ex-Figure 1- Unequal crossing-over between homologous chromosomes.
Black and gray regions correspond to microsatellite repeat sequences.
pected and observed numbers of microsatellites in the yeast genome and found that long repeats are more common than would be expected by chance and attributed this to slip-page. A small number of repeats (fewer than 8 nucleotides,
e.g.2 tetranucleotides, 4 dinucleotides or 8 mononucleo-tides) is less common than would be expected by chance events, which explains the fact that DNA polymerase slip-page is rare.
A study on the origin of microsatellites concluded that a minimum number of repeats (proto-microsatellite) is required before DNA polymerase slippage can extend the number of repeats (Rose and Falush, 1998, Messieret al. 1996). It has been shown that in species that have primates as their common ancestor (e.g.gorillas, chimpanzees and humans) a GA mutation at theη-globin locus changed the sequence ATGTGTGT to ATGTATGT, thus creating a microsatellite (ATGT)2which evolved into (ATGT)4in
Af-rican monkeys and (ATGT)5 in humans (Messier et al.
1996).
Zhuet al. (2000) conducted an elegant study on mu-tated human genes and demonstrated that more than 70% of all 2 to 4 nucleotide insertions resulted in 2 to 5 new peats, most of which are not extensions of pexisting re-peats but new microsatellites originating from random sequences. This indicates that the types and processes that lead to the expansion of microsatellite loci and polymor-phism also occur with few repeats.
In humans, as compared to yeasts, a completely dif-ferent mechanism for generating microsatellites has been deduced from the association of microsatellites with retro-transposons (Nadiret al., 1996). The authors speculated that microsatellites rich in A-base were generated by the extension of terminal 3’ of retrotranscripts, similarly to the mRNA polyadenylation mechanism.
According to Arcotet al. (1995), theAluSINEs (in-terspersed nuclear elements) family is largely dispersed in the primate genome, and is likely to contribute to the gene-sis of microsatellites due to the presence of adenine-rich re-gions at the 3’ terminal and within the sequence. The association between microsatellites andAluelements can be explained in terms of three mechanisms: 1) theAlu ele-ment integrates into a pre-existing microsatellite, resulting in repeats of the microsatellite flanking the element; 2)Alu
elements are integrated with mutations that are introduced in the primary transcript during reverse transcription, with the mutation acting as a nucleus for microsatellite genesis; and 3) the accumulation of random mutations in the poly(A) tail ofAluelements, followed by the expansion of this region by slippage or intra-allelic recombination to produce microsatellites. Mechanism 1 assumes that micro-satellites are presenta priori to the insertion ofAlu ele-ments, whereas mechanisms 2 and 3 are based on indirect evidence suggesting that the internal adenine-rich region and oligo(dA) 3’ terminal of theAluelements are sources for microsatellite genesis.
While such an association has been found to apply to a great number of organisms, a high density of transposable elements does not always coincide with a high density of microsatellites (Lin et al., 1999). Therefore, retrotrans-position as a generalized mechanism for microsatellite gen-esis remains questionable.
Ramsayet al. (1999) analyzed microsatellite flanking sequences in hops and showed that a high proportion of clones were homologous to known transposons. An associ-ation was found between the repetitive dispersed element R173 and the transposons BARE-1, WIS2-1A and PREM1. The microsatellites found in Ramsey’s study were of two types, those with single sequences in the flanking region and those associated with retrotransposons and other repet-itive dispersed elements. Three subtypes compose the sec-ond type: a) those positioned at terminal 3’ of the transposon with a single sequence at the other terminal; b) those positioned at terminal 5’; and c) those in which the in-ternal sequence of the transposon is homologous in both flanking regions.
Microsatellite Size Distribution in Genomic
Sequences
The number of repeats is a crucial factor determining the evolutionary dynamics of microsatellite DNA, and it is important to investigate which parameters influence the length of repeats. Taking the simplest model of micro-satellite evolution, DNA slippage is a symmetrical process and, consequently, the number of repeats added is on aver-age the same as the number removed.
Kruglyaket al. (1998) proposed a model for the size distribution of microsatellites in genomic sequences that does not assume selection or mutation to be size-related processes, infinite growth being prevented by the accumu-lation of base substitutions at microsatellite loci. An impor-tant aspect of this model is that it assumes a consimpor-tant base substitution rate in which the slippage rate can be deter-mined on the basis of the microsatellite length distribution in genomic sequences. This means that species with short microsatellites (e.g. Drosophila melanogaster) should have lower microsatellite mutation rates than species with longer microsatellites.
We can test this theory by comparing the mutation rates of microsatellites with equal number of repeats. Given that microsatellite loci are quite well conserved in different species, it is possible to determine whether the number of repeats diverges according to species. A comparison of microsatellites from chimpanzees and humans showed that human microsatellites contain many more repeats (Amoset al., 1996; Cooperet al., 1998).
Genome Distribution
within coding and non-coding sequences (Arcot et al., 1995; Wilder and Hollocher, 2001) and the possible func-tional roles of different repeats (Valle, 1993). The fre-quency of genomic microsatellites also varies per taxon, in terms of absolute numbers of microsatellite loci and prefer-ential repeats (Hancock, 1999). In plants, the estimated fre-quency is 0.85% inArabidopsisand 0.37% in Zea mays
while in fish it is 3.21% in Tetraodon nigroviridis and 2.12% inFugu rubripes(Crolliuset al., 2000) and inHomo sapiens chromosome 22 the microsatellite frequency is 1.07% whereas in the wholeCaernorhabditis elegans ge-nome it is only 0.21% (Tóthet al., 2000).
According to Morganteet al. (2002), microsatellite frequency differs amongst some plant species i.e. Arabidopsis, maize, soybean, wheat and rice, and is high in
Arabidopsisand lower in species with comparatively larger genomes such as maize and wheat. Morganteet al. (2002) point out that there is a significant positive linear relation-ship between microsatellite frequencies and the percentage of single copy DNA, suggesting that microsatellites should be more frequent within single copy DNA than repetitive DNA. The suggestion that microsatellite frequency is a function of the relative proportion of single copy DNA rather than the size of the genome as a whole is interesting, although this contradicts studies affirming that microsa-tellites are elements derived from repetitive sequences and that an increase in microsatellite density is closely-related to an increase in genome size (Schlötterer and Harr, 2000).
Due to the high microsatellite mutation rate it is to be expected that coding regions have a low microsatellite den-sity because if they do not these regions would be signifi-cantly altered, possibly leading to loss of functionality. Comparative studies (Tóthet al., 2000) in both coding and non-coding regions of different species have confirmed this hypothesis by showing that only tri- and hexa-nucleotides are to be found in excessive numbers over a wide range of repeat unit sizes. In contrast, other types of repeats were much less frequent in coding regions than in non-coding re-gions. This means that selection against mutations that change the reading frame of a gene restrict the presence of microsatellites in coding regions, while microsatellites with repeats in multiples of three develop evenly in both re-gions (Metzgaret al., 2000). Obviously, this is related to the fact that RNA bases are read as triplets.
The density of perfect and imperfect microsatellites in genomic regions and expressed sequence tags (ESTs) of
Arabidopsis thaliana,Oryza sativa,Glycine max,Zea mays
andTriticum aestivumhas been assessed by Metzgaret al. (2000) and confirmed by Morganteet al. (2002), both of whom showed that different selective pressures seem to be acting on 5’ and 3’ untranslated regions (UTRs) and open reading frames (ORFs) of transcription units. These authors found that microsatellite frequency at the 3’ UTR region is higher than that expected for the whole genome, with tri-and tetra-nucleotides contributing markedly to this
in-crease. Moreover, the 5’ UTR region shows a much higher microsatellite frequency than other genomic fractions, and this is due to the presence of di- and tri-nucleotides, princi-pally AG/CT and AAG/CTT repeats. The difference in se-lective pressure between the 3’ and 5’ UTR regions is clearly due to the higher frequency of CT and CTT repeats in comparison to AG and AAG at the 5’ end as compared to the 3’ end.
The contrasting frequency data for different genomes strongly suggests that microsatellite distribution is not merely a reflection of the base composition of the genome but that the DNA repair system plays an important role in determining microsatellite distribution in different species.
Tóthet al. (2000) reported that the total number of 1 to 6 repeat microsatellites varies depending on the taxo-nomic group concerned, ranging from 13,889 (approxi-mately 429 per Mb, excluding single-base repeats) in
Rodentia, to 4,139 (154 per Mb) in Embryophyta, 3,004 (99 per Mb) inSacharomyces cerevisiaeand 2,139 (88 per Mb) in Caernorhabditis elegans. Since 1 Mb corresponds to 2,000 non-overlapped clones with insert sizes of approxi-mately 500 bp, 21.45% positive clones in rodents and 4.4% inC. eleganswould be expected using traditional methods for isolating microsatellites. However, when specific re-peats are focused, the expected frequency of any tri- or tetra-nucleotide repeat is less than 1% of positive clones in all taxa. Songet al. (2002) analyzed 4.5 Mb of the wheat genome and estimated that the occurrence of tri-nucleotides with eight or more repeats was 3.0 x 10⁴for (TAA/ATT)n,
2.3 x 10⁴for (CTT/GAA)n, 1.2 x 10⁴for (CAA/GTT)n, 2.3 x
103for (CAT/GTA)nand 1.5 x 10³for (GGA/CCT)n.
Linet al. (1999) showed that there was a strong re-duction in the density of di-nucleotide microsatellites around the centromere of chromosome 2 of A. thaliana. This tendency was also found inDrosophila(Pardueet al., 1987; Lowenhauptet al., 1989). Interestingly, the under-representation of microsatellites in these genomic regions with a high density of transposons contrasts with the associ-ation between microsatellites and the 3’ region of retro-transposons of humans (Nadir et al., 1996). If a causal correlation exists between microsatellite genesis and trans-poson insertion, a higher microsatellite density would be expected in the centromere region.
Non-random microsatellite distribution can also be detected on a more refined scale. Microsatellites that tend to form clusters, leading to non-random distribution in se-quences smaller than 15 kb (Bachtroget al., 1999), being found inD. melanogaster. Similarly, microsatellite cloning frequently reveals more than one microsatellite sequence in a clone and also indicates that the microsatellites are orga-nized in clusters (Estoupet al., 1999).
Functional Importance of Microsatellites
spe-cies. Some reports indicate that microsatellites are associ-ated with the regulation and/or functioning of genes, for example (CT)nmotif microsatellites at the 5’ UTR region
of certainArabidopsisgenes play a role in anti-sense tran-scription (Kashi and Soller, 1999 and references therein).
Microsatellites are known to be related to pathogenic-ity and genomic variabilpathogenic-ity in microorganisms and many examples of microsatellites associated with the modulation of microbial gene expression have been identified (Jackson
et al., 1997; Field and Wills, 1998; Saunderset al., 1998). For instance, tetra-nucleotide repeats are present within the ORFs in genes coding forHaemophilus influenzae lipo-polysaccharides, with variation in repeat number influenc-ing protein production (Belkum, 1999). Repetitive micro-satellite-like sequences have also been found in a number of virulence genes in pathogens (Hoodet al., 1996).
TheAdaptive Peaks Theory(Wright, 1931; 1932) and the fact that the frequency of a microsatellite allele repre-sents a maximum local adaptive value for the population suggests that the majority of mutations generating new al-leles result in gene variants of lower local adaptive value.
A number of authors have suggested another function for microsatellites and show that di-nucleotide repeats can act as recombination hot spots (Treco and Arnheim, 1986; Wahlset al., 1990; Baileyet al., 1998). This microsatellite function allows populations to recover genetic variation lost through genetic drift and rapidly adjust to evolutionary demands (Foster and Trimarchi, 1994; Rosenberget al., 1994).
There is strong evidence that microsatellites can be found upstream of the promoter region and thus regulate the expression of eukaryote genes. For instance, the regula-tion of several genes depends on the binding of GAGA transcription factors to a small segment of the micro-satellite composed of CT repeats present at the first intron promoter of these genes (Biggin and Tjian, 1988; Gilmour
et al., 1989), GAGA binding appearing to activate tran-scription by removing nucleosomes from the promoter or separating the gene from the position effect (O’Donnellet al., 1994).
Microsatellite Transferability
Progress in the use of microsatellites has encountered setbacks due to the high cost of developing specific prim-ers. However, many studies have shown that primer pairs designed for one species can be used for other species of the same genus (Isagi and Suhandono, 1997; Ciprianiet al., 1999) or even for different genera of the same family (White and Powell, 1997; Roaet al., 2000; Zucchiet al., 2002), this microsatellite attribute being known as transfer-abilityor cross-species amplification.
Transferability can be a very important factor in facil-itating the use of microsatellites because it reduces costs when working on taxa with low microsatellite frequencies or from which microsatellites are difficult to isolate.
Micro-satellite transferability amongst related species is allowed by the homologous nature of the DNA sequence in micro-satellite flanking regions. However, as expected, the suc-cessful amplification rate declines as genetic divergence between species increases (Primmer and Merilä, 2002).
It is worth noting that studies on both humans (Ru-binsztein et al.; 1995; Morin et al., 1998) and birds (Ellegrenet al., 1995) have shown thatthe degreeof micro-satellite polymorphism is not transferable,i.e.high levels of polymorphism detected in one species may not be found at the correspondent locus of another species after primers have been transferred.
In plants, conserved microsatellite loci have been ob-served across cultivars, subspecies and related species (Mé-taiset al., 2002). Zucchiet al. (2003) were successful in transferring primers originally developed for Eucalyptus
spp. (Brondaniet al., 1998) toEugenia dysenterica,both of which are members of the same family but separated by a considerable phylogenetic distance. In this case, 3% micro-satellite locus amplification was possible but about 30% of the primers amplified non-specific PCR products, reveal-ing the occurrence of mutational events in the primer-binding region.
Working with birds, Lillandtet al. (2002) were suc-cessful in using primers originally developed for 18
Corvidaespecies in Perisoreus infaustus, although some primers that did not produce good quality amplified prod-ucts had to be redesigned in order to amplify the original lo-cus. This supports the hypothesis that transferability is not overly dependent on phylogenetic proximity. Micro-satellite transferability is very advantageous when dealing with birds because there is a low frequency of micro-satellites in avian genomes.
In felines, 18 primers developed forPanthera tigris sumatraeshowed total transferability to 11 species belong-ing to three other feline genera, Felis, Acinonyx and Neofeliswas also demonstrated (Williamsonet al., 2002).
However, very low levels of transferability have been reported in the amphibian generaTriturus(Garneret al., 2003) andRana(Primmer and Merillä, 2002), possibly due to the fact that amphibians have a very large genome, twice as big as mammals and four times that of birds. These two studies not only show that phylogenetic proximity is a pre-dominant factor in successful transfer but also that transfer-ability is probably affected by other factors such as the size and complexity of the genome concerned and whether or not the microsatellite belongs to a coding region.
Plant Population Structure: The Genetic Power
of Microsatellites
analysis (Wright and Bentzen, 1994), but also for the study of natural plant populations (Collevattiet al., 1999; Day-nandanet al., 1997).
Knowledge of the distribution of genetic variability between and within natural plant populations is essential to adopt competent strategies forex situandin situgermplasm conservation and microsatellites are extremely useful for estimating genetic population parameters as (i) population structure, (ii) parentage and paternity analysis and (iii) gene flow, all of which will be discussed in more detail below.
Genetic structure of populations
The most efficient measure to assess population structure is based on Wright’sF-statistics (1951), Wright’s inbreeding coefficient (FST, also calledθ) being particularly useful for analysing microsatellite markers because it is able to discriminate between alleles, especially that rare ones, althoughFSTproduced using such markers can some-times be overestimates of the true value.
Microsatellite markers include loci with a large num-ber of alleles, but one question that should be asked is whether a large number of loci or a large number of alleles is more important in genetic assessment. Working on the relationship between the allele number and the coefficient of variation of four genetic distances, Kalinowski (2002) used simulated data to show that highly polymorphic loci provided better estimates of genetic distance than less poly-morphic loci and that increased allele number was associ-ated with a decrease in the coefficient of variation of each of the four genetic distances studied. These results show that there is no requirement to examine either highly poly-morphic loci or large numbers of loci, the only requirement being that a sufficient number of alleles is examined.
However, the high mutation rate of microsatellites can also invalidate many assumptions used in some con-ventional population structure analysis because different populations may share homoplasic alleles at frequencies that depend on both the rate and the details of the mutation process (Estoup et al., 2002). When such effects are ig-nored the rate of gene flow or genetic introgression can be overestimated (Ballouxet al. 2000). Slatkin (1995) devel-oped theRSTstatistic (also called , analogous toFST) to take into account the effects of mutation, but althoughRST per-forms better thanFSTin some circumstances it can also be sensitive to details of the mutation process (Balloux and Goudet, 2002).
Since mutation rate varies widely between loci within species (Di Rienzoet al. 1998) one advantage of loci with a high mutation rate is that genetic differentiation reaches equilibrium faster, offering the possibility of obtaining esti-mates from larger and more widely spaced populations. Using a microsatellite data set from Mauritian skinks, Nichols and Freeman (2004) proposed a method for analyz-ing genetic data to obtain separate estimates of population
size and migration rate for sampled populations without precise prior knowledge of mutation rates at each locus.
When working with microsatellites and low migra-tion rates, theF-statistic is sensitive to the mutation rate but, unlike the situation under a strict stepwise mutation model, under these conditionsRSTis independent of the mu-tation rate and, due to its high associated variance, can be less accurate at reflecting population differentiation than
FST(Balloux and Lugon-Moulin, 2002). Moreover,RSTwill be deflated when the mutation pattern includes mutations involving more than one repeat when the number of possi-ble allelic states is finite (Slatkin, 1995).
The estimation and comparison of bothFandR -sta-tistic is especially relevant for critical comparison and care-ful interpretation of data and may give the most valuable information about the genetic structure of a population. Collevattiet al. (2001) used microsatellite loci to investi-gate the population genetic structure of the endangered tropical treeCaryocar brasilienseand found thatFSTwas significant lower (0.07) thanRST(0.29) over all loci. This was due to the high and variable mutation rates of micro-satellites that usually display high levels of within-po-pulation heterozygosity. Slatkin (1995) states that statistics such asFST, which are based on an infinite allele model and consider alleles to be identical by descent, tend to underes-timate population differentiation and produce lower values than their correspondingRSTvalues. In some cases, how-ever, no significant differences have been found between
FSTandRSTvalues, examples being the assessment of ge-netic structure in populations of Mesoamerican big-leaf mahogany (Swietenia macrophylla, Meliaceae) carried out by Novicket al. (2003), which produced similar overallFST
(0.109) andRST(0.177) values, and the study of mahogany (S. macrophylla) by Lemeset al. (2003) in which the over-all values ofFST(0.097) andRST(0.147) were again quite close, a further example being the study of Bowenet al. (2005) with loggerhead turtle (Caretta caretta) that again produced similarFST(0.002) andRST(< 0.001) values.
found in some species remains significant after controlling for the number of repeats.
Parentage and paternity analysis
Plant paternity analysis and gene flow studies have often employed microsatellite markers because unlike allozyme loci, which do not have sufficient variability to determine parentage by exclusion (Chakraborty et al., 1988), each microsatellite locus has many relatively rare al-leles and in most case an individual can be excluded from paternity using only a few loci (Dow and Ashley, 1996; Dowet al. 1995).
Chaseet al. (1996) used four microsatellite loci and six allozyme loci to estimate paternity exclusion in
Pithecellobium (Mimosoideae) and found that not only were microsatellite loci powerful tools for the analysis of population structures but also provide a means for accu-rately examining both gene flow and paternity, two impor-tant parameters in conservation biology.
Concerning relationship coefficients, a problem arose when the termcoefficient de parenté(proposed by Malécot, 1948) was translated ascoefficient of relationship(f) that had already been used by Wright (1922). Thuscoefficient de parentéis variously known as kinship (Malécot, 1948), parentage (Kempthorne, 1957) and coancestry (Falconer, 1960).
Kinship is usually calculated either by genetic meth-ods, which employ molecular markers to estimate related-ness based on a quantitative measure of kinship or by genealogical methods that employ qualitative pedigree data based on relationships such as full sibs, half sibs, father and son, etc.
Bernardoet al. (1996) used relationship coefficients to construct a mean genetic relation matrix for use with a best linear unbiased prediction (BLUP) model to calculate combination capabilities and additive and dominant genetic values. Using this methodology it is possible to select geno-types controlling the relationship level (an inverse measure associated with the effective population size; Souza and Sorrels, 1989) and to specify the minimum genetic distance for varietal protection (Hunter, 1989) in light of the fact that when a population is submitted to strong selection variabil-ity can be lost.
Molecular markers were not widely available until the 1980s, before which relationship coefficients were esti-mated using pedigree data but this type of data suffers from the disadvantage that it requires large amounts of historical information that is rare for plants and generally unavailable for natural populations.
Allozymes are not the best markers for estimation re-lationship because of their restricted ability for sampling the genome as a whole, the most effective marker for this type of estimation being microsatellites as they are codo-minant and hypervariable (and therefore able to distinguish between closely-related individuals), are abundant in
sev-eral genomes and are gensev-erally used in conjunction with the PCR. The fact that microsatellite studies employ PCR is the main reason why geneticists in general prefer microsatellite markers as opposed to restriction fragment length polymor-phic (RFLP) markers, which although codominant are not PCR-based. In general, only 30-40 microsatellite loci are needed to provide a satisfactory estimate of relationship (Blouin, 2003).
The reason why it is best to use codominant markers to estimate relationship coefficients is the need to discrimi-nate between alleles since, in heterozygous diploids, once we know two alleles at a specific locus it is possible to cal-culate its complete allelic and genotypic composition. Such considerations indicate that microsatellite markers are the most informative marker for calculating relationship coef-ficients. Several papers discussing how relationship coeffi-cients can be produced using molecular markers have been published (Queller and Goodnight, 1989; Liet al., 1993; Lynch and Ritland, 1999; Wang, 2002), all of which have concluded that a large number of markers and individuals must be used and that this is particularly important when maximum likelihood estimators are employed (Ritland, 1996). A good example of the use of a large number of microsatellite markers is the study of Bowerset al. (1999) who used 32 microsatellites loci to detect the relationships between 300 grape cultivars, the results showing that most cultivars originated from only a single pair ofPinotand
Gouais blancparents that were widespread in northeastern France during the middle ages.
Another important point is that the markers used for calculating relationships must be independent because if they are not the precision of the estimates will be low (Thompson and Meagher, 1998), this is the reason why all relationship models need to incorporate data from inde-pendent loci. Since microsatellites are able to distinguish between alleles, they are the most powerful molecular tool for relationship analyses such as paternity testing that re-quire a high level of precision. This type of analysis has a fundamental role in plant genetics, because it can provide the information necessary to detect the parent of a specific individual in a population. To exclude a random individual from paternity, paternity analysis uses exclusion-proba-bility techniques (Weir, 1996) which depend on the allele frequencies for that locus but not on the genotypes.
Due to its forensic importance, much paternity testing research has been carried out on humans but is equally ap-plicable to plants. In human paternity testing, the condi-tional probability that a specific man is not the father given the joint probabilities of mother-child combinations is given by the following equation:
Q Pu Pu P PU V PU PV
V U U u
= - - -
-¹
å
å
å
(1 ) 1 ( )2 4 3 3
2 2 2
wherePis the allelic frequency,Uis theu-thallele andV
It is easy to understand that as more alleles are identified the importance of a particular locus increases, analogous to the increase in exclusion probabilities as the number of loci used is increased. When several independent loci are in-volved andQlis the exclusion probability for locuslthe overall probability of exclusion (Q)is given by Weir (1996) as:
Q Ql
l
= -1
Õ
(1- )As recommended by the Combined DNA Index Sys-tem (CODIS), human paternity tests use 13 microsatellite loci to give aQvalue of 1 x 10⁻⁴(Chakrabortyet al., 1999) but if less loci are used then theQvalue will be higher (i.e.
more towards 1, indicating a lower value of exclusion), with, for example, two microsatellite loci with 10 alleles of equal frequency will give aQvalue of 0.96.
Gene flow
As pointed out by Avise (1994), loss of genetic vari-ability is the central topic in conservation genetics because small populations (especially of allogamous species) oc-curring in fragmented areas can suffer from inbreeding de-pression leading to the loss of heterozygosity, genetic diversity and adaptivity.
Gene flow is fundamental for the maintenance of metapopulations because it allows genetic diversity to be maintained by acting directly on the population structure and against random genetic drift. Thus gene flow results in homogenization of allelic frequencies and exactly the op-posite effect to genetic drift which tends to make popula-tions genetically more heterogeneous. Gene flow can be quantified indirectly usingFSTestimates, the number of pri-vate alleles, space autocorrelation and coalescence or di-rectly using morphological markers and paternity analysis. In plants, paternity analysis is the most widely-used method for estimating direct gene flow and by analyzing several loci estimates can be made of the probability of an individ-ual plant being the most probable male parent of a specific offspring among all possible male plants in a particular population. Once the male parent is identified, the pattern of pollen movement can be determined, although the appli-cability of this methodology is limited to small populations. In population genetics, the most usual procedure used to quantify gene flow between populations is based on
Wright’s infinite-alleles model (see Slatkin, 1995), which assumes migration-drift equilibrium among all popula-tions. Estimates of gene flow based on the analysis of ge-netic structure of populations can be obtained using theFST
statistic. Gene flow estimated by this method is known as
apparent gene flowbecause it assumes that the genetic structure of the population fits an island model in which there is equilibrium between migration and genetic drift. Under this assumptionFSTis a function of the number of migrants per generation,Nm, whereNis the population size andmis the proportion of migrants per generation, the relationship betweenFSTandNmbeing:
Nm
FST
= æ
-è
çç ö
ø ÷÷
1 4
1 1
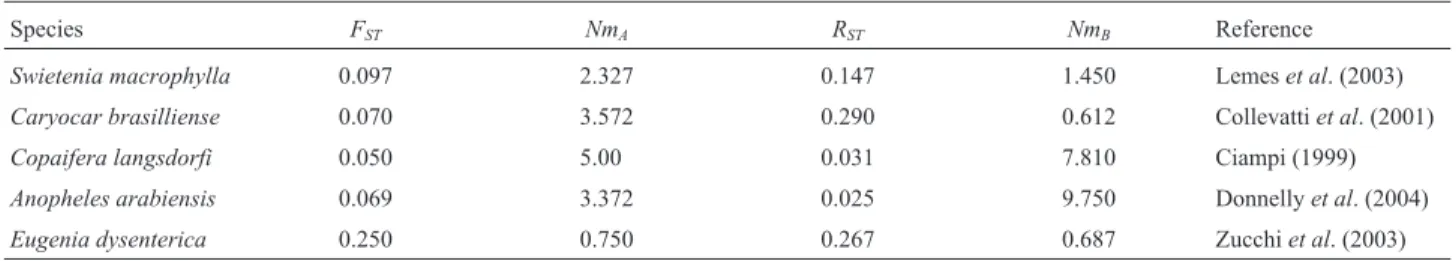
EstimatedNmvalues for tropical species are gener-ally higher than 1.0 (Ciampi, 1999; Lemeset al., 2003), with Wright (1951) stating that whenNmis higher than 1.0 or when there is one or more individual migrant per genera-tion the effect of migragenera-tion is sufficient to oppose the drift effect. This simple method for estimating gene flow has been used widely in conservation studies.The estimated gene flow based onFSTfor some tropical species is given in Table 1 where it can be seen that the values ranged from 0.75 to 5, although special care should be taken in interpret-ing these estimates because, as previously stated, gene flow estimates based onFSTmay not be reliable. However, it is interesting to note thatE. dysentericapopulation showed the lowest gene flow (Nm= 0.75 migrants per generation) and it is probably in serious risk, while forC. langsdorfthe situation is less drastic because the estimated flow of mi-grants was 5 per generation.
Gaggiottiet al.(1999) conducted simulation studies in which they compared two procedures for estimating gene flow (Nm) based on microsatellite data. These authors comparedNmvalues obtained using Wright’sFSTstatistic which is defined on the basis of the variance of gene fre-quencies withRSTvalues (Slatkin, 1995) which is estimate from the variance of the length of the allele, the underlying genetic model assuming stepwise mutations and constraints in the range of allelic size classes. The results of these simu-lations suggested that the use of microsatellite loci can lead to serious overestimation ofNmespecially when popula-tion sizes are large (N> 5,000) and the range of constraints
Table 1- MicrosatelliteFST,RSTand gene flow estimates calculated for populations of some tropical species. Note thatNmAwas based onFSTwhileNmB
was calculated fromRST.
Species FST NmA RST NmB Reference
Swietenia macrophylla 0.097 2.327 0.147 1.450 Lemeset al. (2003)
Caryocar brasilliense 0.070 3.572 0.290 0.612 Collevattiet al. (2001)
Copaifera langsdorfi 0.050 5.00 0.031 7.810 Ciampi (1999)
Anopheles arabiensis 0.069 3.372 0.025 9.750 Donnellyet al. (2004)
are high. For large population sample sizes (ns= 50) when many microsatellite loci (nl = 20) were present RST per-formed better thanFSTwhile when sample sizes were mod-erate or small (ns= 10) and the number of loci was low (nl= 20)FSTperformed better thanRSTin estimatingNm.
These results highlight the fact that when micro-satellites are used in interpopulation diversity and gene flow studies of natural populations there is no standard bio-metric estimation procedure adequate for all situations and procedures should be chosen according the characteristics of the data.
Effective population size
Gene diversity or expected heterozygosis (h) (Weir, 1996) is an important parameter in studies on the genetic structure of populations. At an intrapopulation levelhis defined on a locus basis as beingh= -1
å
pu2
, wherepuis the frequency of theuthallele at that locus. For estimation, an average value is generally obtained. It can be shown that the expression cited above can also be written as
h= -1 1 m m- p
2
/ s , for a locus withmalleles wheresp
2
is the variance of the allelic frequencies of the locus. Theh
parameter is therefore higher for loci with many alleles and for whichsp
2
is small. A favorable aspect for studying the molecular diversity of populations is provided when microsatellite markers are used because a large number of alleles is generally detected. For example, the potential range ofhfor a locus with three alleles, is 0 to 0.67 and for a locus with 10 alleles is 0 to 0.9 and consequently there is greater sensitivity in detecting diversity when microsatellite markers are used in comparison to other markers. This favorable aspect is also observed when pop-ulations are subdivided and total diversity is split into components between and within subpopulations, as pro-posed by Nei (1973).
In investigations involving several natural subpopu-lations belonging to a metapopulation, the use of micro-satellite markers results in a considerably higher number of exclusive or private alleles, which is very important for es-timating the degree of isolation of the subpopulations. However, when dealing with parameters such as the effec-tive populations size (Ne) that are used for measuring the drift of gene frequencies due to sampling occurred preced-ing generations it is questionable if microsatellite markers are adequate. In this case Vencovsky and Crossa (2003) have shown that Wright’sFstatistics (e.g. FSTandFIT) are fundamental for estimating the effective populations size of samples. A random model is required because interpopu-lation diversity in a given generation is a consequence of drift alone, when microsatellite mutation rates are high a random model is no longer applicable and estimates will be biased.
Acknowledgments
The authors would like to thank Ricardo V. Cesar for his kind contribution in the proofreading of this review.
References
Amos W, Sawcer SJ, Feakes RW and Rubinsztein DC (1996) Microsatellites show mutational bias and heterozygote in-stability. Nature Genetics 13:390-391.
Arcot SS, Wang Z, Weber JL, Deininger L and Batzer MA (1995) Alu repeats: A source for the genesis of primate micro-satellites. Genomics 29:136-144.
Avise J (1994) Molecular Markers, Natural History and Evolu-tion. Chapman & Hall, New York, 511 pp.
Bachtrog D, Weiss S, Zangerl B, Brem G and Schlötterer C (1999) Distribution of dinucleotide microsatellites in the
Drosophila melanogastergenome. Molecular Biology and Evolution 16:602-610.
Bailey AD, Pavelitz T and Weiner AM (1998) The microsatellite sequence (CT)n x (GA)n promotes stable chromosomal inte-gration of large tandem arrays of functional human U2 small nuclear RNA genes. Molecular and Cell Biology 18:2226-2271.
Balloux F and Goudet J (2002) Statistical properties of population differentiation estimators under stepwise mutation in a finite island model. Molecular Ecology 11:771-783.
Balloux F and Lugon-Moulin N (2002) The estimation of popula-tion differentiapopula-tion with microsatellite markers. Molecular Ecology 11:155-165.
Balloux F, Lugon-Moulin N and Hausser J (2000) Estimating gene flow across hybrid zones: How reliable are microsa-tellites? Acta Theriologica 45:93-101.
Belkum A Van (1999) Short sequence repeats in microbial patho-genesis and evolution. Cellular and Molecular Life Sciences 56:729-734.
Bernardo R, Murigneux A and Karaman Z (1996) Marker-based estimates of identity by descent and alikeness in state among maize inbreds. Theoretical and Applied Genetics 93:262-267.
Bichara M, Pinet I, Schumacher S and Fuchs R (2000) Mecha-nisms of dinucleotide repeat instability inEscherichia coli. Genetics 154:533-542.
Biggin MD and Tjian R (1988) Transcription factors that activate the ultrabithorax promoter in developmentally staged ex-tracts. Cell 53:699-711.
Blouin MS (2003) DNA-based methods for pedigree reconstruc-tion and kinship analysis in natural populareconstruc-tions. Trends in Ecology and Evolution 18:503-511.
Bowers J, Boursiquot JM, This P, Chu K, Johansson H and Meredith C (1999) Historical genetics: The parentage of Chardonnay, Gamay, and other wine grapes of northeastern France. Science 285:1562-1565.
Bowen BW, Bass AL, Soares L and Toonen RJ (2005) Conserva-tion implicaConserva-tions of complex populaConserva-tion structure: Lessons from the loggerhead turtle (Caretta caretta). Molecular Eco-logy 14:2389-2402.
Brondani RV, Brondani C, Tarchini R and Grattapaglia D (1998) Development, characterization and mapping of micro-satellite markers inEucalyptus grandisand E. urophylla. Theoretical and Applied Genetics 97:816-827.
expected proportion of offspring with unambiguous pater-nity. Genetics 118:527-536.
Chakraborty R, Stivers DN, Su B, Zhong YX and Budowle B (1999) The utility of short tandem repeat loci beyond human identification: Implications for development of new DNA typing systems. Electrophoresis 20:1682-1696.
Ciampi AY (1999) Desenvolvimento e utilização de marcadores microsatélites, AFLP e seqüenciamento de cpDNA, no estu-do da estrutura genética e parentesco em populações de copaíba (Copaifera langsdorffii) em matas de galeria no cerrado. PhD Thesis, Universidade Estadual Paulista ‘Júlio de Mesquita Filho’, Botucatu, 204 pp.
Cipriani G, Lot G, Huang WG, Matarazzo MT, Peterlunger E and Testolin R (1999) AC/GT and AG/CT microsatellite repeats in peach [Prunus persica(L) Batsch]: Isolation, characteri-sation and cross species amplification inPrunus. Theoreti-cal and Applied Genetics 99:65-72.
Collevatti RG, Brondani RV and Grattapaglia D (1999) Develop-ment and characterization of microsatellite markers for ge-netic analysis of a Brazilian endangered tree species
Caryocar brasiliense. Heredity 83:748-756.
Collevatti RG, Grattapaglia D and Hay JD (2001) Population ge-netic structure of the endangered tropical tree species
Caryocar brasiliense, based on variability at microsatellite loci. Molecular Ecology 10:349-356.
Cooper G, Rubinsztein DC and Amos W (1998) Ascertainment bias cannot entirely account for human microsatellites being longer than their chimpanzee homologues. Human Molecu-lar Genetics 7:1425-1429.
Cregan B, Mudge J, Fickus EW, Marek LF, Danesh D, Denny R, Shoemaker RC, Matthews BF, Jarvik T and Young ND (1999) Targeted isolation of simple sequence repeat markers through the use of bacterial artificial chromosomes. Theo-retical and Applied Genetics 98:919-928.
Crollius HR, Jaillon O, Dasilva C, Ozouf Costaz C, Fizames C, Fischer C, Bouneau L, Billault A, Quetier F, Saurin W, Bernot A and Weissenbach J (2000) Characterization and repeat analysis of the compact genome of the freshwater pufferfish Tetraodon nigroviridis. Genome Research 10:939-949.
Crow J and Kimura M (1970) An Introduction to Population Ge-netics Theory. Burgess Publishing Company, Minneapolis, 591 pp.
Cummings CJ and Zoghbi HY (2000) Trinucleotide repeats: Me-chanisms and pathophysiology. Annual Review of Geno-mics and Human Genetics 1:281-328.
Dayanandan S, Bawa KS and Kesseli R (1997) Conservation of microsatellites among tropical tree (Leguminosae). Ameri-can Journal of Botany 84:1658-1663.
Di Rienzo A, Donnelly P, Toomajian C, Sisk B, Hill A, Petzl-Erle ML, Haines GH and Barch DH (1998) Heterogeneity of microsatellite mutations within and between loci, and impli-cations for human demographic histories. Genetics 148:1269-1284.
Di Rienzo A, Peterson AC, Garza JC, Valdes AM, Slatkin M and Freimer NB (1994) Mutational processes of simple se-quence repeat loci in human populations. Proceeding of Na-tional Academy of Sciences 91:3166-3170.
Donnelly MJ, Pinto J, Girod R, Besansky NJ and Lehmann T (2004) Revisiting the role of introgression vs. shared ances-tral polymorphisms as key processes shaping genetic
diver-sity in the recently separated sibling species of the Anophe-les gambiaecomplex. Heredity 92:61-68.
Dow BD, Ashley MV and Howe HF (1995) Isolation and charac-terization of highly variable (GA/CT)n microsatellites in the bur oak,Quercus macrocarpa. Theoretical and Applied Ge-netics 91:137-141.
Dow BD and Ashley MV (1996). Microsatellite analysis of seed dispersal and sapling parentage in bur oak,Quercus macro-carpa. Molecular Ecology 5:615-627.
Ellegren H, Primmer CR and Sheldon B (1995) Microsatellite evolution: Directionality or bias in locus selection? Nature Genetics 11:60-62.
Estoup A, Cornuet JM, Rousset F and Guyomard R (1999) Juxta-posed microsatellite systems as diagnostic markers for admixture: Theoretical aspects. Molecular Biology and Evolution 16:898-908.
Estoup A, Jarne P and Cornuet JM (2002) Homoplasy and muta-tion model at microsatellite loci and their consequences for population genetics analysis. Molecular Ecology 11:1591-1604.
Everett CM and Wood NW (2004) Trinucleotide repeats and neurodegenerative disease. Brain 127:2385-2405.
Falconer DS (1960) Introduction to Quantitative Genetics. The Ronald Press, New York, 365 pp.
Field D and Wills C (1998) Long polymorphic microsatellites in simple organisms. Proceeding of the Royal Society of Lon-don, Series B: Biological Sciences 263:209-215.
Foster L and Trimarchi JM (1994) Adaptive reversion of a frameshift mutation inEscherichia coliby simple base dele-tions in homopolymeric runs. Science 265:407-409. Gaggiotti OE, Lange O, Rassmann K and Gliddon C (1999) A
comparison of two indirect methods for estimating average levels of gene flow using microsatellite data. Molecular Ecology 8:1513-1520.
Garner TWJ, Angelone S and Pearman B (2003) Genetic deple-tion in Swiss populadeple-tions ofRana latastei: Conservation im-plications. Biological Conservation 114:371-376.
Gilmour DS, Thomas GH and Elgin SC (1989)Drosophila nu-clear proteins bind to regions of alternating C and T residues in gene promoters. Science 245:1487-1490.
Goldstein DB and Schlotterer C (1999) Microsatellites: Evolution and Applications. Oxford University Press, New York, 343 pp.
Hancock JM (1999) Microsatellites and other simple sequences: Genomic context and mutational mechanisms. In: Goldstein DB and Schlötterer C (eds) Microsatellites: Evolution and Applications. Oxford University Press, New York, p 1-9. Hedrick W (2001) Conservation genetics: Where are we now?
Trends in Ecology and Evolution 16:629-636.
Hentschel CC (1982) Homocopolymer sequences in the spacer of a sea urchin histone gene repeat are sensitive to S1 nuclease. Nature 295:714-716.
Heywood VH and Iriondo JM (2003) Plant conservation: Old problems, new perspectives. Biological Conservation 113:321-335.
Hood DW, Deadman ME, Jennings M, Bisercic M, Fleischmann RD, Venter JC and Moxon ER (1996) DNA repeats identify novel virulence genes inHaemophilus influenzae. Proceed-ings of the National Academy of Sciences 93:11121-11125. Hunter BR (1989) ASTA approach on minimum distance. In:
Industry Research Conference, 44:193-195. American Seed Trade Association, Washington.
Isagi Y and Suhandono S (1997) PCR primers amplifying micro-satellite loci ofQuercus myrsinifoliaBlume and their con-servation between oak species. Molecular Ecology 6:897-899.
Jackson PJ, Walthers EA, Kalif AS, Richmond KL, Adair DM, Hill KK, Kuske CR, Andersen GL, Wilson KH, Hughjones ME and Keim P (1997) Characterization of the variable number tandem repeats in VITA from different Bacillus anthracis isolates. Applied Environment Microbiology 63:1400-1405.
Jarne P and Lagoda PJL (1996) Microsatellites, from molecules to populations and back. Trends in Ecology and Evolution 11:424-429.
Kalinowski ST (2002) How many alleles per locus should be used to estimate genetic distances? Heredity 88:62-65.
Kashi Y and Soller M (1999) Functional roles of microsatellites and minisatellites. In: Goldstein DB and Schlötterer C (eds) Microsatellites: Evolution and Applications. Oxford Uni-versity Press, New York, pp 10-23.
Kempthorne O (1957) An Introduction to Genetic Statistics. Wil-ley, New York, 545 pp.
Knapik EW, Goodman A, Ekker M, Chevrette M, Delgado J, Neuhauss S, Shimoda N, Driever W, Fishman MC and Jacob HJ (1998) A microsatellite genetic linkage map for zebrafish (Danio rerio). Nature Genetics 18:338-343.
Kolodner RD and Marsischky GT (1999) Eukaryotic DNA mis-match repair. Current Opinion Genetics 9:89-96.
Kruglyak S, Durret RT, Schug M and Aquadro CF (1998) Equilib-rium distributions of microsatellite repeat length resulting from a balance between slippage events and point mutations. Proceeding of National Academy of Sciences 95:10774-10778.
Lemes MR, Gribel R, Proctor J and Grattapaglia D (2003) Popula-tion genetic structure of mahogany (Swietenia macrophylla
King, Meliaceae) across the Brazilian Amazon, based on variation at microsatellite loci: Implications for conserva-tion. Molecular Ecology 12:2875-2883.
Levinson G and Gutman GA (1987) Slippedstrand mispairing: A major mechanism for DNA sequence evolution. Molecular and Biology Evolution 4:203-221.
Lin X, Kaul S, Rounsley S, Shea T, Benito MI, Town CD, Fujii CY, Mason T, Bowman CL, Barnstead M, Feldblyum TV, Buell CR, Ketchum KA, Lee J, Ronning CM, Koo HL, Mof-fat KS, Cronin LA, Shen M, Pai G, Van Aken S, Umayam L, Tallon LJ, Gill JE and Venter JC (1999) Sequence and anal-ysis of chromosome 2 of the plantArabidopsis thaliana. Na-ture 402:761-768.
Lowenhaupt K, Rich A and Pardue ML (1989) Nonrandom distri-bution of long mono and dinucleotide repeats inDrosophila
chromosomes: Correlations with dosage compensation, heterochromatin, and recombination. Molecular and Cell Biology 9:1173-1182.
Lynch M and Ritland K (1999) Estimation of pairwise relatedness with molecular markers. Genetics 152:1753-1766.
Mahadevan M, Tsilfidis C, Sabourin L, Shutler G, Amemiya C, Jansen G, Neville C, Narang M, Barcelo J, O’Hoy K, Le-blond S, Earle Macdonald J, De Jong J and Wieringa B (1992) Myotonic dystrophy mutation: An unstable CTG
re-peat in the 38 untranslated region of the gene. Science 255:1253-1258.
Malécot G (1948) Les Mathematiques de L’Herédité. Masson, Paris, 63 pp.
Messier W, Li SH and Stewart CB (1996) The birth of micro-satellites. Nature 381:483.
Métais I, Hamon B, Jalouzot R and Peltier D (2002) Structure and level of genetic diversity in various bean types evidenced with microsatellite markers isolated from a genomic en-riched library. Theoretical and Applied Genetics 104:1346-1352.
Metzgar M, Bytof J and Wills C (2000) Selection against frameshift mutations limits microsatellite expansion in cod-ing DNA. Genome Research 10:72-80.
Morgante M, Hanafey M and Powell W (2002) Microsatellites are preferentially associated with nonrepetitive DNA in plant genomes. Nature Genetics 30:194-200.
Morin PA, Mahboubi P, Wedel S and Rogers J (1998) Rapid screening and comparison of human microsatellite markers in baboons: Allele size is conserved, but allele number is not. Genomics 53:12-20.
Moxon R and Willis C (1999) DNA microsatellites: Agents of evolution? Scientific American 280:94-99.
Nadir E, Margalit H, Gallily T and Bensasson SA (1996) Micro-satellite spreading in the human genome: Evolutionary mechanisms and structural implications. Proceedings of the National Academy of Sciences 93:6470-6475.
Nei, M (1973) Analysis of genetic diversity in subdivided popula-tions. Proceedings of the National Academy of Sciences 70:3321-3323.
Nichols RA and Freeman KLN (2004) Using molecular markers with high mutation rates to obtain estimates of relative popu-lation size and to distinguish the effects of gene flow and mutation: A demonstration using data from endemic Mauri-tian skinks. Molecular Ecology 13:775-787.
Novick RR, Dick CW, Lemes MR, Navarro C, Caccone A and Bermingham E (2003) Genetic structure of Mesoamerican populations of big-leaf mahogany (Swietenia macrophylla) inferred from microsatellite analysis. Molecular Ecology 12:2885-2893.
O’Donnell KH, Chen CT and Wensink C (1994) Insulating DNA directs ubiquitous transcription of the Drosophila melanogasteralpha1 tubulin gene. Molecular and Cell Biol-ogy 14:6398-6408.
O’Donnell WT and Warren ST (2002) A decade of molecular studies of fragile X syndrome. Neurosciences 25:315-338. Pardue ML, Lowenhaupt K, Rich A and Nordheim A (1987)
(dCdA)n(dGdT)n sequences have evolutionarily conserved chromosomal locations inDrosophilawith implications for roles in chromosome structure and function. Embo Journal 6:1781-1789.
Petit RJ, Deguilloux MF, Chat J, Grivet D, Garnier-Géré P and Vendramin GG (2005) Standardizing for microsatellite length in comparisons of genetic diversity. Molecular Ecol-ogy 14:885-890.
Pinto LR, Vieira MLC, Souza Jr CL and Souza AP (2003a) Recip-rocal recurrent selection effects on the genetic structure of tropical maize populations assessed at microsatellite loci. Genetics and Molecular Biology 26:355-364.
populations submitted to a high-intensity reciprocal recur-rent selection. Euphytica 134:277-286.
Primmer CR and Merilä J (2000) A low rate of cross-species microsatellite amplification success in Ranid frogs. Conser-vation Genetics 3:445-449.
Pupko T and Graur D (1999) Evolution of microsatellites in the yeastSaccharomyces cerevisiae: Role of length and number of repeated units. Journal of Molecular Evolution 48:313-316.
Queller DC and Goodnight KF (1989) Estimation of genetic relat-edness using allozyme data. Evolution 43:258-275. Ramsay L, Macaulay M, Cardle L, Morgante M, Ivanissevich SD,
Maestri E, Powell W and Waugh R (1999) Intimate associa-tion of microsatellite repeats with retrotransposons and other dispersed repetitive elements in barley. The Plant Journal 17:415-425.
Ritland K (1996) Estimators for pairwise relatedness and individ-ual inbreeding coefficients. Genetical Research 67:175-185. Roa AC, Chavarriaga-Aguirre P, Duque MC, Maya MM,
Bonier-bale MW, Iglesias C and Tohme J (2000) Cross species am-plification of cassava (Manihot esculenta) (Euphorbiaceae) microsatellites: Allelic polymorphism and degree of rela-tionship American Journal of Botany 87:1647-1655. Rose O and Falush D (1998) A threshold size for microsatellite
expansion. Molecular Biology and Evolution 15:613-615. Rosenberg SM, Longerich S, Gee P and Harris RS (1994)
Adap-tive mutation by deletions in small mononucleotide repeats. Science 265:405-407.
Rubinsztein DC, Amos W, Leggo J, Goodburn S, Jain S, Li SH, Margolis RL, Ross CA and Fergusonsmith MA (1995) Microsatellite evolution - Evidence for directionality and variation in rate between species. Nature Genetics 10:337-343.
Saunders NJ, Peden JF, Hood DW and Moxon ER (1998) Simple sequence repeats in theHelicobacter pylorigenome. Molec-ular Microbiology 27:1091-1098.
Schlötterer C (2000) Evolutionary dynamics of microsatellite DNA. Chromossoma 109:365-371.
Schlötterer C, Amos B and Tautz D (1991) Conservation of poly-morphic simple sequence loci in cetacean species. Nature 354:63-65.
Schlotterer C and Harr B (2000)Drosophila virilishas long and highly polymorphic microsatellites. Molecular Biology and Evolution 17:1641-1646.
Schlötterer C and Tautz D (1992) Slippage synthesis of simple se-quence DNA. Nucleic Acids Research 20:211-215. Sia EA, Kokoska RJ, Dominska M, Greenwell P and Petes TD
(1997) Microsatellite instability in yeast: Dependence on re-peat unit size and DNA mismatch repair genes. Molecular and Cellular Biology 17:2851-2858.
Sia EA, Butler CA, Dominska M, Greenwell P, Fox TD, and Petes TD (2000). Analysis of microsatellite mutations in the mito-chondrial DNA ofSaccharomyces cerevisiae. Proceedings of the National Academy of Sciences 97:250-255.
Slatkin M (1995) A measure of population subdivision based on microsatellite allele frequencies. Genetics 139:457-462. Song QJ, Fickus EW and Cregan PB (2002) Characterization of
trinucleotide SSR motifs in wheat. Theoretical and Applied Genetics 104:286-293.
Souza E and Sorrells ME (1989) Pedigree analysis of north-american oat cultivars released from 1951 to 1985. Crop Sci-ence 29:595-601.
Stallings RL (1994) Distribution of trinucleotide microsatellites in different categories of mammalian genomic sequence: Implication for human genetic diseases. Genomics 21:116-121.
Steinkellner H, Lexer C, Turetschek E and Glossl J (1997) Con-servation of (GA)(n) microsatellite loci between Quercus
species. Molecular Ecology 6:1189-1194.
Strand M, Prolla TA, Liskay RM and Petes TD (1993) Desta-bilization of tracts of simple repetitive DNA in yeast by mu-tations affecting DNA mismatch repair. Nature 365:274-276.
Streisinger G and Owen JE (1985) Mechanisms of spontaneous and induced frameshift mutation in bacteriophage T4. Ge-netics 109:633-659.
Thompson EA and Meagher TR (1998) Genetic linkage in the es-timation of pairwise relationship. Theoretical and Applied Genetics 97:857-864.
Tóth G, Gáspari Z and Jurka J (2000) Microsatellites in different eukaryotic genomes: Survey and analysis. Genome Re-search 10:967-981.
Treco D and Arnheim N (1986) The evolutionarily conserved re-petitive sequence d(TG.AC)n promotes reciprocal exchange and generates unusual recombinant tetrads during yeast mei-osis. Molecular and Cell Biology 6:3934-3947.
Vencovsky R and Crossa J (2003) Measurements of representa-tiveness used in genetic resources conservation and plant breeding. Crop Science 43:1912-1921.
Wahls W, Wallace LJ and Moore D (1990) The Z-DNA motif d(TG)30 promotes reception of information during gene conversion events while stimulating homologous recombi-nation in human cells in culture. Molecular and Cell Biology 10:785-793.
Weir BS (1996) Genetic Data Analysis II. Sinauer, Sunderland, 445 pp.
White G and Powell W (1997) Isolation and characterization of microsatellite loci inSwietenia humilis(Meliaceae): An en-dangered tropical hardwood species. Molecular Ecology 6:851-860.
Wilder J and Hollocher H (2001) Mobile elements and the genesis of microsatellites in dipterans. Molecular Biology and Evo-lution 18:384-392.
Williamson JE, Huebinger RM, Sommer JA, Louis EE and Barber RC (2002) Development and cross species amplification of 18 microsatellite markers in the Sumatran tiger (Panthera tigris sumatrae). Molecular Ecology Notes 2:110-112. Wright S (1922) Coefficients of inbreeding and relationship.
American Naturalist 56:330-338.
Wright S (1931) Evolution in Mendelian populations. Genetics 16:97-159.
Wright S (1932) The roles of mutation, inbreeding, crossbreeding, and selection in evolution. Proceedings of the Sixth Interna-tional Congress on Genetics 1:356-366.
Wright S (1951) The genetical structure of populations. Annual Eugenics 15:323-354.
Zhu Y, Strassmann JE and Queller DC (2000) Insertions, substitu-tions, and the origin of microsatellites. Genetics Research 76:227-236.
Zucchi MI, Brondani RV, Pinheiro JB, Brondani C and Ven-covsky R (2002) Transferability of microsatellite markers
from Eucalyptus spp. to Eugenia dysenterica(Myrtaceae family). Molecular Ecology Notes 2:512-514.
Zucchi MI, Brondani RV, Pinheiro, JB, Coelho ASG, Chaves LJ and Vencovsky R (2003) Genetic structure and gene flow in
Eugenia dysentericaDC in the Brazilian cerrado utilizing SSR markers. Genetics and Molecular Biology 26:449-458.