Printed version ISSN 0001-3765 / Online version ISSN 1678-2690 http://dx.doi.org/10.1590/0001-3765201820170826
www.scielo.br/aabc | www.fb.com/aabcjournal
Spatial variability of tree species diversity in a mixed tropical forest in Southern Brazil
ALLAN L. PELISSARI1
, AFONSO F. FILHO2
, ANGELO A. EBLING3
, CARLOS R. SANQUETTA1, VINICIUS C. CYSNEIROS4 and ANA PAULA D. CORTE1
1
Departamento de Ciências Florestais, Universidade Federal do Paraná / UFPR, Av. Prof. Lothário Meissner, 632, 80210-170 Curitiba, PR, Brazil 2
Departamento de Engenharia Florestal, Universidade Estadual do Centro-Oeste / UNICENTRO, PR 153, Km 7, 84500-000 Irati, PR, Brazil 3
Departamento de Engenharia Florestal, Universidade Federal Rural da Amazônia / UFRA, PA 275, Km 13, 68515-970 Parauapebas, PA, Brazil
4
Programa de Pós-Graduação em Engenharia Florestal, Universidade Federal do Paraná / UFPR, Av. Prof. Lothário Meissner, 632, 80210-170 Curitiba, PR, Brazil
Manuscript received on October 19, 2017; accepted for publication on January 31, 2018
ABSTRACT
Floristic surveys and diversity indices are often applied to measure tree species diversity in mixed tropical forest remnants. However, these analyses are frequently limited to the overall results and do not allow to evaluate the spatial variability distributions of tree diversity, leading to develop additional tools. This study aimed to estimate the spatial variability of tree diversity and map their spatial patterns in a Brazilian mixed tropical forest conservation area. We used indices to measure the tree species diversity (dbh ≥ 10
cm) in 400 sampling units (25 m x 25 m) from a continuous forest inventory. Semivariograms were fitted to estimate spatial dependences and punctual kriging was applied to compose maps. Mean diversity values were constant in the continuous inventories, indicating a forest remnant in an advanced stage of ecological succession. On the other hand, tree diversity presented spatial patterns identified by geostatistics, in which the dynamics were composed of heterogeneous mosaics spatially influenced by tree species with different ecological features and densities, gap dynamics, advancement of forest succession, mortality, and
Araucaria angustilofia’s cohorts.
Key words: Araucaria angustilofia, Atlantic Forest biome, diversity indices, geostatistics.
Correspondence to: Allan Libanio Pelissari E-mail: [email protected]
* Contribution to the centenary of the Brazilian Academy of Sciences.
INTRODUCTION
Over the past century, intensive human exploitation
has caused severe logging and biodiversity loss in
native mixed tropical forests in the Southern region
of Brazil (Behling and Pillar 2007). Located at the transition between tropical forests in the North
and temperate fields in the South, Brazilian mixed
individuals belonging to the same species; and Margalef’s index (1958), which indicates species diversity as the ratio between the number of species and the logarithm of the total number of individuals in a sample.
However, these analyses have often been limited to the overall results of floristic compositions, whose approaches do not allow us to evaluate the spatial variability of tree diversity. This context leads, therefore, to a search for additional tools for modeling spatial patterns, such as geostatistical analyses based on the theory of regionalized variables, in which a spatial function is applied to measure a spatial phenomenon (Webster and Oliver 2007), aiming to compose maps, sampling procedures, and local interventions.
Nowadays, geostatistical methods and their interpolation techniques show potential for modeling and mapping spatial dependence in native forests (Ahmed and Ewers 2012, Akhavan et al. 2015, Barni et al. 2016, Benítez et al. 2016, Hernandez-Stefanoni and Ponce-Hernandez 2006, Roveda et al. 2016, Sales et al. 2007, Scolforo et al. 2016, Zawadzki et al. 2005). However, the lack of research for modeling the spatial variability of tree species diversity in mixed tropical forests represents
a significant gap in ecological knowledge, especially in light of the influence of current climate changes
on native forest conservation.
Thus, this study aimed to estimate the spatial variability of tree diversity and map their spatial
MATERIALS AND METHODS
STUDY AREA
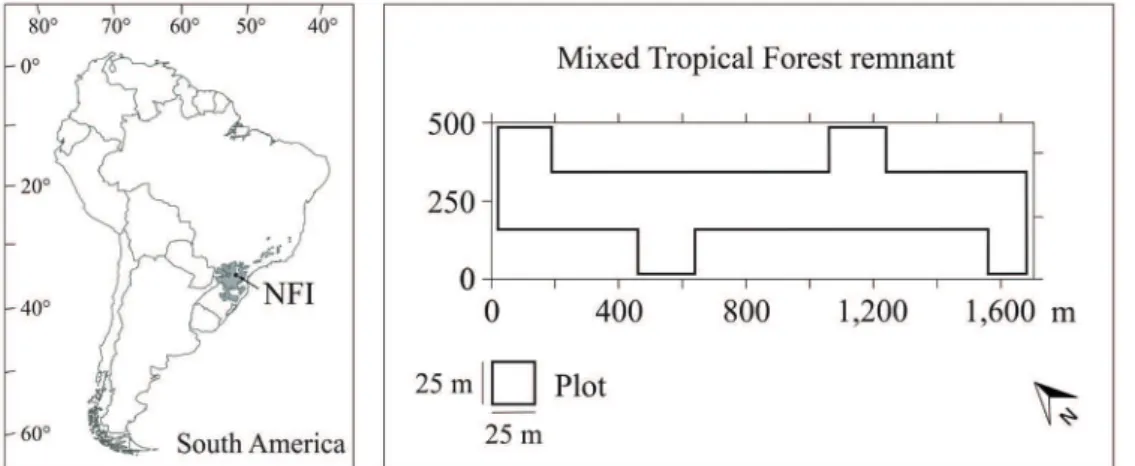
This study was carried out in a mixed tropical forest remnant with an absence of anthropic disturbance of the vegetation for around 60 years, located in the National Forest of Irati (NFI), in the Southern region of Brazil (Figure 1) at the coordinates 25° 01’ S, 25° 40’ S, 51° 11’ W, and 51° 15’ W. The
region’s climate is classified as temperate oceanic
(Cfb - Köppen), with cold summers, without a dry season, and with average temperature and annual rainfall of 17 °C and 1,400 mm, respectively (Alvares et al. 2013).
TREE SPECIES DIVERSITY MEASURES
We identified and classified, according to APG III (The Angiosperm Phylogenygroup 2009), trees with a diameter at 1.30 m above the ground
(dbh) ≥ 10 cm in 400 plots of 25 m × 25 m (Figure 1)
allocated in 40 ha of a mixed tropical forest remnant in a continuous forest inventory carried out in 2002, 2008, and 2014. Then, diversity indices were applied to measure tree species diversity in each plot, such as: Shannon’s index (1), in which the highest value represents high diversity; Simpson’s index (2), where the uppermost value indicates high species dominance and therefore low diversity; and Margalef’s index (3), in which the highest diversity is represented by a high value (Magurran 2003):
( )
1
ln
S
i i
i
H
p
p
=
(
)
(
)
1 1
i i
n n D
N N
−
= ∑ −
(2)
(
)
( )
1
ln
Mg
S
D
N
−
=
(3)where: H’ is the Shannon’s index, D is the Simpson’s index, DMg is the Margalef’s index, i i
n p
N
= , N the is
total number of trees in the sample, ni is the number of trees in the ith tree species, and S is the total number of tree species in the sample.
SPATIAL ANALYSES
Initially, descriptive statistics and Kolmogorov-Smirnov’s test (K-S), at 95% probability level (Feldman and Valdez-Flores 2010), were applied to the database, in which the transformations
( )
ln xi , ln
(
xi+1)
and xi were evaluated for non-normal data distributions (Webster and Oliver 2007, Robertson 2008). Afterward, geostatistics was used to estimate spatial diversity patterns through semivariance measures (4) determined between equidistant plots in the spatial directions: 0°, 45°, 90°, and 135°, and obtaining the mean semivariances between equivalent lag distances (h):( )
( )
( )( )
(
)
2 11
– 2
N h
i i
i
h Z x Z x h
N h γ
=
=
∑
+ (4)
where: γ( )h is the semivariance of Z(xi), h is the lag distance, and N(h) is the number of pairs of measured plots Z(xi) and Z(xi + h) separated by a distance h.
Confirming the absence of anisotropy, the isotropic Exponential, Gaussian, and Spherical semivariogram models (Webster and Oliver 2007)
were fitted to estimate the diversity indices at any
distance between the plots using the weighted least squares method for minimizing the sum of squares of semivariance deviations weighted by the number of pairs of plots in each lag distance (Reilly and Gelman 2007). Also, models were evaluated in accordance with Pelissari et al. (2017), considering smallest weighted sum of squared deviations
(WSSD), highest coefficient of determination (R2),
and validation statistics, such as lowest values of mean absolute error (MAE) and root mean square error (RMSE), and highest index of agreement (d).
Punctual kriging was applied to interpolate the diversity indices using the GS+ software (Robertson 2008), in which estimates were made using the weighted sum of the known values of neighboring plots around the unknown places. Thus, using
the selected semivariogram models, weights (λi)
were assigned through Lagrange multipliers to estimate unknown values (Chaudhry et al. 2013). Subsequently, diversity maps were produced with
considering a weighting power equal to two (Lloyd 2005).
RESULTS
In a mixed tropical forest remnant, 131 tree species
from 44 families were identified in 2014, in which
Myrtaceae was the richest family (19 species), followed by Lauraceae (15 species), and Fabaceae (11 species). We highlight Araucaria angustifolia
(Bertol.) Kuntze as a species with high density (7.2%) and greatest dominance (26.5%); followed by Ocotea odorifera Rohwer, with highest density (9.2%) and high dominance (5.5%); and Ilex paraguariensis A. St.-Hil., with similar density (9.2%) and dominance (5.0%).
Applying diversity indices, mean values equal
to 2.56 and coefficients of variation (cv) between
11 and 13% were observed for Shannon’s index
in the sample.
Data transformations ln
( )
xi , ln(xi+1), and xi were evaluated for Shannon’s and Simpson’s indices that showed negatively-skewed distributions. However, these transformations did not provide the appropriate normality condition and, therefore, the original data were used (Table II), since normal distribution is not an assumption required for applying geostatistical analysis, in which itis recommended to avoid the biased influence of
a few high values on the kriging interpolator in positively-skewed data distributions.
Spherical model showed the best fits for Shannon’s and Margalef’s indices, and Gaussian model was the most accurate for Simpson’s index
(Table II). In these fits, increasing semivariances from the nugget effect until the range were verified
in the isotropic semivariograms (Figure 2), in
TABLE I
Descriptive statistics of diversity indices in a mixed tropical forest remnant in the Southern region of Brazil.
Diversity index Year xmin x xmax sx cv K-S
2002 1.39 2.56 3.18 0.28 11.0% 0.077*
Shannon 2008 1.04 2.56 3.17 0.32 12.3% 0.094*
2014 0.85 2.56 3.20 0.33 12.9% 0.118*
2002 0.62 0.90 0.95 0.04 4.6% 0.169*
Simpson 2008 0.58 0.89 0.95 0.05 5.7% 0.222*
2014 0.36 0.89 0.95 0.07 7.5% 0.283*
2002 2.09 4.55 7.45 0.88 19.4% 0.038ns
Margalef 2008 1.44 4.56 6.93 0.92 20.5% 0.049ns
2014 1.34 4.75 7.03 0.97 20.4% 0.051ns
min
x
= minimum value;x
xx = mean value; xmax = maximum value; x Sx = standard deviation; cv = coefficient of variation; K-S =which we obtained the smallest weighted sum of squared deviations (WSSD), and coefficients of determination (R2) greater than 0.86 for Shannon’s index (Figures 2a-c), 0.760 to 0.925 for Simpson’s index (Figures 2d-f), and 0.849 to 0.888 for Margalef’s index (Figures 2g-i).
Multimodal diameter distributions for
Araucaria angustifolia species (Figures 3) were
identified in the mixed tropical forest, with cohorts
at the diameter classes equal to 10-30 cm and 40-60 cm. These tree cohorts showed there are some correlations in smallest scale, which cannot be observed in the semivariograms (Figures 2j-l), as well as to the annual tree mortality rates per plot between 2002 and 2008 (Figure 2m) and 2008 and 2014 (Figure 2n), in which high annual tree mortality was related to the species Ilex paraguariensis (42 and 21 trees ha-1), Casearia decandra Jacq. (21 and 17 trees ha-1), and Myrsine umbellata Mart. (20 and 19 trees ha-1).
Diversity index maps showed different spatial
patterns, with increasing diversity for Shannon’s (Figures 4a-c) and Margalef’s indices (Figures 4g-i), as well as spatial homogeneity for Simpson’s index, with increasing values in the lowest Shannon and Margalef areas at the X-coordinate 0-200 m (Figures 4d-f). IDW was applied to Araucaria
angustifolia basal area (Figures 4j-l), in which increasing values were observed in areas with expanding diversity according to Shannon’s and Margalef’s indices, especially at the X-coordinate 0-800 m. IDW was also applied to annual tree mortality rates (Figures 4m-n), in which highest mortality was observed mainly at the Y-coordinate 250-500 m and X-coordinate 0-200 m, where we
identified the lowest diversity in the index maps.
DISCUSSION
As a consequence of human pressure over the years, mixed tropical forest is one of the most vulnerable Brazilian forest ecosystems (Carlucci et al. 2011). The conservation of these forest remnants has
become a key challenge, since the efforts made by official agencies and non-governmental institutions
have not been able to maintain the integral preservation of the forest fragments (Sanqueta et al. 2002, Vibrans et al. 2008). Nevertheless, mixed tropical forest remnants are important sources for
scientific research, mainly for understanding their
species diversity dynamics.
In this paper, mean diversity index values
( )
x were similar to those of other studies inmixed tropical forests (Rondon Neto et al. 2002, Narvaes et al. 2005, Sonego et al. 2007), showing
TABLE II
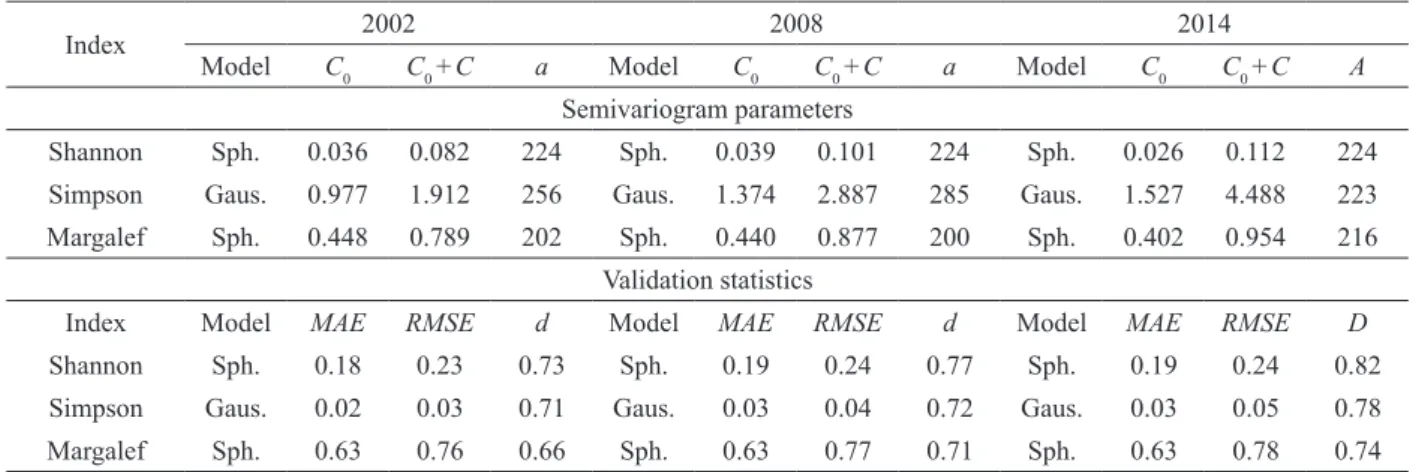
Semivariogram parameters and validation statistics of diversity indices in a mixed tropical forest remnant.
Index 2002 2008 2014
Model C0 C0 +C a Model C0 C0 +C a Model C0 C0 +C A
Semivariogram parameters
Shannon Sph. 0.036 0.082 224 Sph. 0.039 0.101 224 Sph. 0.026 0.112 224
Simpson Gaus. 0.977 1.912 256 Gaus. 1.374 2.887 285 Gaus. 1.527 4.488 223
Margalef Sph. 0.448 0.789 202 Sph. 0.440 0.877 200 Sph. 0.402 0.954 216
Validation statistics
Index Model MAE RMSE d Model MAE RMSE d Model MAE RMSE D
Shannon Sph. 0.18 0.23 0.73 Sph. 0.19 0.24 0.77 Sph. 0.19 0.24 0.82
Simpson Gaus. 0.02 0.03 0.71 Gaus. 0.03 0.04 0.72 Gaus. 0.03 0.05 0.78
Margalef Sph. 0.63 0.76 0.66 Sph. 0.63 0.77 0.71 Sph. 0.63 0.78 0.74
C0 = nugget effect; C0 +C = sill; a = range (m); Sph. = Spherical model; Gaus. = Gaussian model; MAE = mean absolute error;
Figure 2 - Scaled semivariograms of Shannon’s index (a to c), Simpson’s index (d to f), Margalef’s index (g to
i), and pure nugget semivariograms for Araucaria angustifolia basal area per plot (j to l) and annual tree mortality rates per plot (m, n) in a mixed tropical forest.
a constant tendency at the forest inventory times (Table I). These results indicate a behavior of temporal stability of tree diversity, associated with a forest remnant in an advanced stage of ecological
succession, in which small changes in coefficients
of variation (cv) are related to tree mortality and recruitment in the forest.
In the geostatistics fits (Table II), nugget effect
values (C0) represent the diversity variability in short scale, while range values (a) equal to or greater
than 200 m indicated the highest distance between
plots in which tree diversity spatial correlation is
identified. In addition, accuracy was confirmed by
the lowest values of mean absolute error (MAE)
and root mean square error (RMSE), and an index
of agreement (d) greater than 0.7 for Simpson’s and
Shannon’s indices; while the higher variability of
Margalef’s index influenced the values for MAE,
RMSE, and d.
of agreement (d) in the forest inventory (Table II). Thus, commonly used mean values did not make it possible to measure changes in spatial diversity, in which the spatial patterns were related
to the floristic variabilities through the recruitment
of trees into the threshold diameter (dbh ≥ 10
cm) from 85 tree species in areas with increasing diversity, especially Coussarea contracta (Walp.) Müll. Arg., Ilex paraguariensis, and Myrciaria floribunda (H. West ex Willd.) O. Berg. This behavior was most apparent in the Shannon (Figures 4a-c) and Margalef maps (Figures 4g-i) and is attributed to log transformation in their formulas, which makes the smallest spatial changes more evident. On the other hand, Simpson’s index, which uses a linear scale, resulted in the highest spatial variability homogeneity (Figures 4d-f),
indicating the influence of Araucaria angustifolia
as the most dominant species in the sample (Orellana et al. 2016).
Spatial diversity dynamics can be related to cohorts in communities with a high density, and are representative of species with a long-life cycle (Ogden and Stewart 1995), such as Araucaria angustifolia, and established after disturbance events that increase light conditions and favor natural regeneration (Claessens et al. 2006). Thus, in the multimodal diameter distributions (Figure
3), the first cohort is represented by the 40-60 cm class, while the second is identified by the 10-30 cm class, with a higher number of trees than the first cohort due to the lower influence of tree senescence
(Ebling and Péllico Netto 2015).
Natural disturbances affect spatial diversity distributions, benefiting specific forest communities
dominance for Simpson’s index.
A reduction in spatial diversity may result from environmental factors, such as the formation of gaps that increase the dominance of pioneer and secondary species in the successional dynamics (Hartshorn 1978, Whitmore 1989, Guariguata and Ostertag 2001). Subsequently, tree mortality will increase via competition with shade-intolerant species (Whitmore 1989, Luo and Chen 2015), resulting in a more random spatial distribution (Figures 3m-n). These results show the need for understanding the tropical forest succession mechanisms (Wright 2005, Quesada et al. 2009), especially considering current climate changes and loss of global biodiversity.
Our results also showed that tree mortality affects
spatial diversity dynamics and is directly responsible for spatial changes in the forest inventory. Thus, climate changes tend to increase tree mortality in
native forests through the intensification of extreme
weather events (Parks and Bernier 2010, Luo and Chen 2015, Chen et al. 2016), such as successive droughts and global temperature increases (Allen et al. 2010, Feldpausch et al. 2016), in which tree longevity makes rapid adaptation to environmental changes impossible (Lindner et al. 2010), especially among hardwood species, which are physiologically more susceptible (Mahareli et al. 2004), as are the mixed tropical species.
CONCLUSIONS
indicating a forest remnant in an advanced stage of ecological succession. On the other hand, tree
species diversity presents spatial patterns identified
by geostatistical analyses, in which the spatial dynamics were composed of heterogeneous mosaics
spatially influenced by tree species with different
ecological features and densities, gap dynamics, advancement of forest succession, mortality, and
Araucaria angustilofia’s cohort formation.
ACKNOWLEDGMENTS
This study was carried out with the support of
Conselho Nacional de Desenvolvimento Científico
e Tecnológico (CNPQ - Brazil) (case number: 168099/2014-4).
REFERENCES
AHMED SE AND EWERS RM. 2012. Spatial pattern of standing timber value across the Brazilian Amazon. PLoS ONE 7(5): e36099.
AKHAVAN R, KIA-DALIRI H AND ETEMAD V. 2015. Geostatistically estimation and mapping of forest stock in a natural unmanaged forest in the Caspian region of Iran. Caspian J Env Sci 13(1): 61-76.
ALLEN CD ET AL. 2010. A global overview of drought and heat-induced tree mortality reveals emerging climate change risks for forests. Forest Ecol Manag 259: 660-684. ALVARES CA, STAPE JL, SENTELHAS PC, GONÇALVES
JLM AND SPAROVEK G. 2013. Köppen’s climate classification map for Brazil. Meteorol Z22: 1-18. ARNOLD JP AND FONSECA CR. 2011. Herbivory,
pathogens, and epiphylls in Araucaria Forest and ecologically-managed tree monocultures. Forest Ecol Manag 262: 1041-1046.
BARNI PE, MANZI AO, CONDÉ TM, BARBOSA RI AND FEARNSIDE PM. 2016. Spatial distribution of forest biomass in Brazil’s state of Roraima, northern Amazonia. Forest Ecol Manag 377: 170-181.
BEHLING H AND PILLAR VD. 2007. Late Quaternary vegetation, biodiversity and fire dynamics on the Southern Brazilian highland and their implication for conservation and management of modern Araucaria forest and grassland ecosystems. Phil Trans R Soc B 362(1478): 243-251. BENÍTEZ FL, ANDERSON LO AND FORMAGGIO AL.
2016. Evaluation of geostatistical techniques to estimate the spatial distribution of aboveground biomass in the Amazon rainforest using high-resolution remote sensing data. Acta Ama 46: 151-160.
CARLUCCI MB, JARENKOW JA, DUARTE LS AND PILLAR VD. 2011. Conservação da floresta com araucária no extremo Sul do Brasil. Nat Conserv 9(1): 111-114. CHAUDHRY A, KHAN A, MIRZA AM, ALI A, HASSAN
M AND KIM JY. 2013. Neuro fuzzy and punctual kriging based filter for image restoration. Appl Soft Comput 13(2): 817-832.
CHEN HYH, LUO Y, REICH PB, SEARLE EB AND BISWAS SR. 2016. Climate change-associated trends in net biomass change are age dependent in western boreal forests of Canada. Ecol Lett 19(9): 1150-1158.
CLAESSENS L, VERBURG PH, SCHOORL JM AND VELDKAMP A. 2006. Contribution of topographically based landslide hazard modelling to the analysis of the spatial distribution and ecology of kauri (Agathis australis). Landsc Ecol 21: 63-76.
COLOMBO AF AND JOLY CA. 2010. Brazilian Atlantic Forest lato sensu: the most ancient Brazilian forest, and a biodiversity hotspot, is highly threatened by climate change. Braz J Biol 70(3): 697-708.
COOMES DA ET AL. 2005. The hare, the tortoise and the crocodile: the ecology of angiosperm dominance, conifer persistence and fern filtering. J Ecol 93: 918-935.
DALE VH, JOYCE LA, MCNULTY S AND NEILSON RP. 2000. The interplay between climate change, forests, and disturbances. Sci Total Environ 262(3): 201-204.
EBLING AA AND PÉLLICO NETTO S. 2015. Modelagem de ocorrência de coortes na estrutura diamétrica da Araucaria angustifolia (Bertol.) Kuntze. Cerne 21(2): 251-257. FELDMAN RM AND VALDEZ-FLORES C. 2010. Applied
probability and stochastic processes, 2nd
ed., Springer, New York, 397 p.
FELDPAUSCH TR ET AL. 2016. Amazon forest response to repeated droughts. Global Biogeochem Cycles 30: 1-19. GUARIGUATA MR AND OSTERTAG R. 2001. Neotropical
secondary forest succession: changes in structural and functional characteristics. Forest Ecol Manag 148: 185-206. HARTSHORN GS. 1978. Tree falls and tropical forest
dynamics. In: Tomlinson PB and Zimmermman MH (Eds), Tropical trees as living systems, New York, p. 617-638. H E R N A N D E Z S T E FA N O N I J L A N D P O N C E
-HERNANDEZ R. 2006. Mapping the spatial variability of plant diversity in a tropical forest: comparison of spatial interpolation methods. Environ Monit Assess 117(1-3): 307-334.
LINDNER M ET AL. 2010. Climate change impacts, adaptive capacity, and vulnerability of European forest ecosystems. Forest Ecol Manag 259: 698-709.
NARVAES IS, BRENA DA AND LONGHI SJ. 2005. Estrutura da regeneração natural em floresta ombrófila mista na Floresta Nacional de São Francisco de Paula, RS. Ciênc Florest 15(4): 331-342.
OGDEN J AND STEWART GH. 1995. Community dynamics of New Zealand conifers. In: Enright NJ and Hill RS (Eds), Ecology of the Southern Conifers, Melbourne, p. 81-119. ORELLANA E, FIGUEIREDO FILHO A, PÉLLICO NETTO
S AND VANCLAY JK. 2016. Predicting the dynamics of a native araucaria forest using a distance-independent individual tree-growth model. Forest Ecosyst 3: 1-12. PARKS CG AND BERNIER P. 2010. Adaptation of forests
and forest management to changing climate with emphasis on forest health: a review of science, policies and practices. Forest Ecol Manag 259(4): 657-659.
PELISSARI AL, FIGUEIREDO FILHO A, PÉLLICO NETTO S, EBLING AA, ROVEDA M AND SANQUETTA CR. 2017. Geostatistical modeling applied to spatiotemporal dynamics of successional tree species groups in a natural mixed tropical forest. Ecol Indic 78: 1-7.
POLISEL RT, IVANAUSKAS NM, ASSIS MC, SHEPHERD GJ AND YAMAMOTO K. 2014. Structure of the understory community in four stretches of araucaria forest in the state of São Paulo, Brazil. Acta Bot Bras 28(1): 86-101.
QUESADA M ET AL. 2009. Succession and management of tropical dry forests in the Americas: review and new perspectives. Forest Ecol Manag 258: 1014-1024.
REILLY C AND GELMAN A. 2007. Weighted classical variogram estimation for data with clustering. Technometrics 49(2): 184-194.
RIBEIRO TM, IVANAUSKAS NM, MARTINS SV, POLISEL RT, SANTOS RLR AND MIRANDA NETO A. 2013. Mixed rain forest in southeastern Brazil: tree species regeneration and floristic relationships in a remaining stretch of forest near the city of Itaberá, Brazil. Acta Bot Bras 27(1): 87-102.
ROBERTSON GP. 2008. GS+: Geostatistics for the environmental sciences. Gamma Design Software, Plainwell, 172 p.
RONDON NETO RM, WATZLAWICK LF, CALDEIRA MVW AND SCHOENINGER ER. 2002. Análise florística
Vertical structure of a fragment of mixed araucaria forest in Center-South Paraná State, Brazil. Floresta 32(2): 267-276. SCOLFORO HF, SCOLFORO JRS, MELLO JM, MELLO
CR AND MORAIS VA. 2016. Spatial interpolators for improving the mapping of carbon stock of the arboreal vegetation in Brazilian biomes of Atlantic forest and Savanna. Forest Ecol Manag 376: 24-35.
SHANNON CE. 1948. A mathematical theory of communication. Bell Syst Tech J 27(4): 623-666.
SILVA LCR, MACHADO SA, GALVÃO F AND FIGUEIREDO FILHO A. 2016. Floristic evolution in an agroforestry system cultivation in Southern Brazil. An Acad Bras Cienc 88: 973-982.
SIMPSON EH. 1949. Measurement of diversity. Nature 163: 688. SONEGO RC, BACKES A AND SOUZA AF. 2007. Descrição
da estrutura de uma Floresta Ombrófila Mista, RS, Brasil, utilizando estimadores não-paramétricos de riqueza e rarefação de amostras. Acta Bot Bras 21(4): 943-955. THE ANGIOSPERM PHYLOGENY GROUP. 2009. An
update of the Angiosperm Phylogeny Group classification for the orders and families of flowering plants: APG III. Bot J Linn Soc 161: 105-121.
VIBRANS AC, UHLMANN A, SEVEGNANI L, MARCOLIN M, NAKAJIMA N, GRIPPA CR, BROGNI E AND GODOY MB. 2008. Data ordination of mixed rain forest structure based on information of floristic forest inventory of Santa Catarina State, Southern Brazil: results of a pilot survey. Cienc Florest 18(4): 511-523.
WEBSTER R AND OLIVER MA. 2007. Geostatistics for environmental scientists, 2nd
ed., J Wiley & Sons, West Sussex, 315 p.
WHITMORE TC. 1989. Canopy gaps and the two major groups of forest trees. Ecology 70: 536-538.
WRIGHT SJ. 2005. Tropical forests in a changing environment. Trends Ecol Evol 20: 553-560.