ISSN: 1809-4430 (on-line) www.engenhariaagricola.org.br
2 Universidade Estadual de Londrina/ Londrina - PR, Brasil.
Received in: 8-31-2017 Accepted in: 5-31-2018
Doi: http://dx.doi.org/10.1590/1809-4430-Eng.Agric.v38n4p563-567/2018
IDENTIFICATION AND QUANTIFICATION OF FACTORS AFFECTING THE
OPERATIONAL CAPACITY OF SUGAR CANE HARVESTERS
João P. de L. Silva
1*, Ricardo Ralisch
2, Otávio J. G. Abi Saab
21*Corresponding author. Universidade Estadual de Londrina/ Londrina - PR, Brasil. E-mail: [email protected]
KEYWORDS
mechanized harvest,
efficiency,
agricultural
mechanization.
ABSTRACT
Several studies determined the theoretical and effective capacity of sugarcane harvesters.
However, in field conditions, some variables affect sugarcane production and their effect
on machine productivity is difficult to measure.
The objective of this study is to analyze
the correlation of the operational capacity of sugarcane harvesters with property size,
sugarcane yield, total operation time of harvesters, and lost productive time. This
correlation will be used to construct models that estimate machine capacity under
different working conditions. Harvest data were collected from 41 farms with different
sizes and rates of productivity, with the harvesting of 412,207 tons of sugarcane by eight
harvesters. Property size was the variable that, in isolation, better represented the
operational capacity of harvesters in both mg day
-1and mg h
-1, with a positive and strong
correlation between these two variables.
INTRODUCTION
The state of São Paulo is the largest producer of sugarcane in Brazil, with the harvesting of 4.77 million hectares, corresponding to 369.3 million tons of sugarcane in the 2016/2017 harvest (CONAB, 2017). In the 2013/14 harvest, 84.8% of the sugarcane harvested was mechanized, and this percentage varied according to geographical region, reaching 99.3% in the region of Andradina (IEA, 2015).
The performance of mechanical harvesting of sugarcane may change according to specific crop conditions, and harvesting capacity or field capacity is the most relevant factor (Ramos et al., 2016). In addition to the characteristics of the crop and cultivation area, Banchi et al. (2012) observed that the operational capacity of sugarcane harvesters is decreased as the number of hours worked is increased. The reduction in harvesting capacity as a function of the number of machine hours may be due to the lower operational time of harvesters because total operation time is represented by a decreasing function that varies according to the usage time of the machine (Banchi et al., 2009).
Plantation planning may also interfere with the machine’s working capacity because, according to Ramos et al. (2016), the size of the plots affects efficiency, and the longer is the plot length, the higher is the harvesting capacity. In this respect, crop installation should involve making a planting layout to achieve the longest possible row length and save the carriers for product transportation. In this respect, Neungmatcha & Sethanan (2015) developed software that determines the direction of sugarcane rows to reduce lost operation time and increase the efficiency of sugarcane harvesters.
Santos et al. (2014) observed that in the mechanized harvesting of sugarcane, the harvester accounts for the highest percentage of the production cost. In this context, studies on agricultural machinery and sugarcane mechanization are vital to improving crop yields, agricultural operations, and reduce costs (Peloia et al., 2010).
Therefore, the objective of this study is to analyze the correlation between the operational capacity of sugarcane harvesters and different factors for developing models that allow estimating the operational capacity of harvesters in different working conditions.
MATERIAL AND METHODS
The data were collected at the Paulicéia Unit of the Caeté Plant, owned by the Carlos Lyra group and located in Paulicéia, São Paulo state, Brazil, from April to August 2015, where 41 farms with different sizes and rates of sugarcane yield were used, with the harvesting of 412,207 tons of sugarcane by eight harvesters. The spacing of the rows was 0.9 × 1.5 m and was designated double alternate, in which the machine harvests two sugarcane rows at the same time.
TABLE 1. Identification of variables.
Variables Codes Units Description
Operational capacity OC Mg day-1 Amount of sugarcane harvested per machine per day
Operational capacity OCO Mg h-1 Amount of sugarcane harvested per machine per hour
Property size PS ha Crop area
Crop yield CY Mg ha-1 Tons of sugarcane per hectare
Total operation time TOT % Total operation time of the machine (%)
Lost operation time LOT % Lost operation time (%), including maintenance, maneuvering, lack of tackling trailer or truck
Effective operation time EOT % Percentage of time the machine is harvesting sugarcane
A quantitative study was conducted to identify and measure the correlations, presented in the form of a correlation matrix, in which the independent variables with the highest correlation coefficient were chosen to construct regression models that predict the operational capacity of sugarcane harvesters as a function of the selected factors. This analysis was conducted using Pearson’s product -moment correlation coefficient (Pearson’s r) (Zimmermann, 2014).
The variables with higher correlation coefficients were correlated with the operational capacity per day and hour. Assumptions and analyses of variance were carried out using software R, and the most significant linear regression models were used. The graphs were constructed using Microsoft Excel 2010.
RESULTS AND DISCUSSION
Correlation analysis and selection of variables
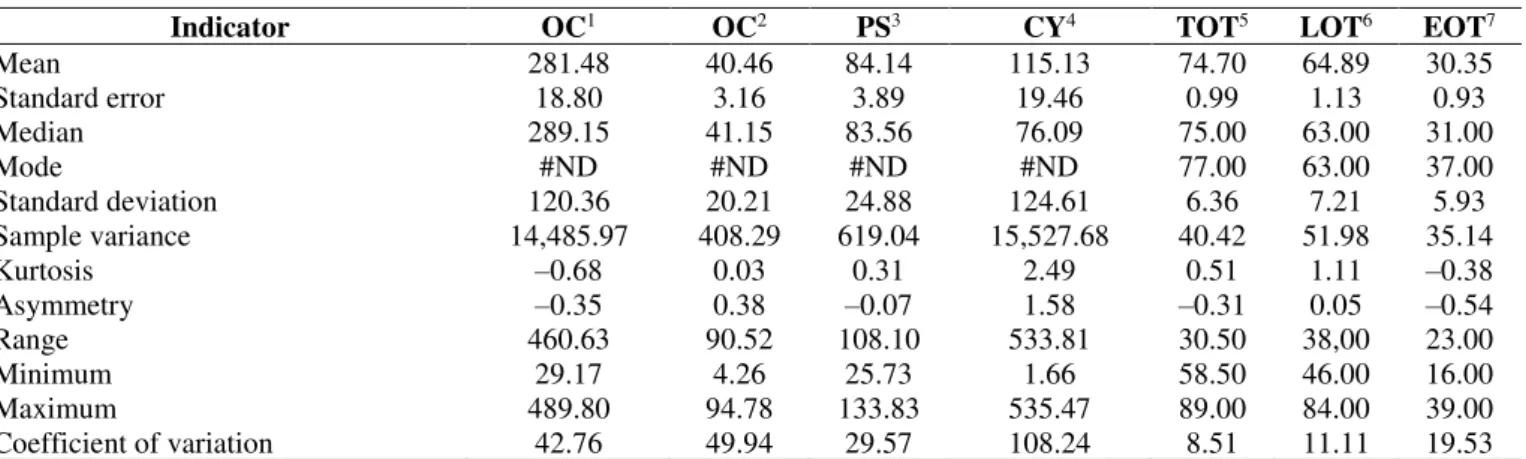
The descriptive statistics of the data is shown in Table 2. The factor with the lowest coefficient of variation (8.51%) was total operation time, whereas the factor with the highest coefficient of variation (108.24%) was property size. Sugarcane yield ranged from 25.73 to 133.83 Mg ha-1,
with an arithmetic mean of 84.14 Mg ha-1, and was higher
than the mean of the state of São Paulo and Brazil in the 2016 and 2017 harvests, corresponding to 77.50 and 72.62 Mg ha-1, respectively (CONAB, 2017). The percentage of
lost operation time was low, ranging from 46% to 84%, with a coefficient of variation of 11.11%. This inefficiency is due to different factors that limit harvesting, including the weather, sugarcane row length (Zamunér Filho, 2015), and the lack of tacking trailers and/or trucks (Farías et al., 2016). The percentage of production time ranged from 16% to 39%, with a coefficient of variation of 19.53%.
TABLE 2. Analysis of the descriptive statistics for the mechanized harvest of 412,207 tons of sugarcane.
Indicator OC1 OC2 PS3 CY4 TOT5 LOT6 EOT7
Mean 281.48 40.46 84.14 115.13 74.70 64.89 30.35
Standard error 18.80 3.16 3.89 19.46 0.99 1.13 0.93
Median 289.15 41.15 83.56 76.09 75.00 63.00 31.00
Mode #ND #ND #ND #ND 77.00 63.00 37.00
Standard deviation 120.36 20.21 24.88 124.61 6.36 7.21 5.93
Sample variance 14,485.97 408.29 619.04 15,527.68 40.42 51.98 35.14
Kurtosis –0.68 0.03 0.31 2.49 0.51 1.11 –0.38
Asymmetry –0.35 0.38 –0.07 1.58 –0.31 0.05 –0.54
Range 460.63 90.52 108.10 533.81 30.50 38,00 23.00
Minimum 29.17 4.26 25.73 1.66 58.50 46.00 16.00
The operational capacity ranged from 4.26 to 94.78 Mg h-1, and the minimum value was lower than that found
by Farías et al. (2016), wherein this parameter ranged from 41.00 to 61.00 Mg h-1 under field conditions (Table 2).
The correlation matrix results suggest that the operational capacity in Mg day-1 is strongly and positively
associated with the operational capacity in Mg h-1 (r = 0.88)
and property size (r = 0.72) (Table 3). However, the coefficients for crop yield and total operation time of harvesters were positive and unrepresentative, corresponding to 0.23 and 0.18, respectively. The correlation matrix shows that a machine with maximum operation time in an area with a high yield has maximum operational capacity (in Mg day-1) if this area is large
enough for adequate operation, with sugarcane row lengths that ensure optimal harvester operation and few interruptions in service for maneuvers or change of harvest
area, and similar results were reported by Ramos et al. (2016).
In this study, the lost production time presented a weak negative correlation and was ignored because of the low representativeness of the coefficients (Table 3). However, Farías et al. (2016) indicated that lost production time significantly affected machine capacity. This weak correlation does not suggest that lost production time is not important, but that other factors more strongly affected harvester performance under the conditions of the study.
Property size was strongly and positively correlated with operational capacity (in Mg h-1) (r = 0.71), whereas
both crop yield and total operation time were weakly and positively associated with operational capacity (r = 0.29 and 0.09, respectively). Lost operation time and total operation time were weakly and negatively correlated with operational capacity with r = –0.15 and –0.47, respectively.
TABLE 3. Correlation matrix between the operational capacity of sugarcane harvesters and the study variables.
OC1 OC2 PS3 CY4 TOT5 LOT6 EOT7
OC1 1
OC2 0.88 1
PS3 0.72 0.71 1
CY4 0.23 0.29 0.12 1
TOT5 0.18 0.09 –0.13 –0.04 1
LOT6 –0.17 –0.15 –0.15 0.16 –0.37 1
EOT7 –0.06 –0.47 –0.19 –0.23 0.16 –0.16 1
Legend: 1Operational capacity (Mg day-1); 2Operational capacity (Mg h-1); 3Property size (ha); 4Crop yield (Mg ha-1); 5Total operation time
(%); 6Lost operation time (%), including maintenance, maneuver, lack of tackling trailer or truck; 7Effective operation time (%).
Regression analysis
Operational capacity (Mg h-1)
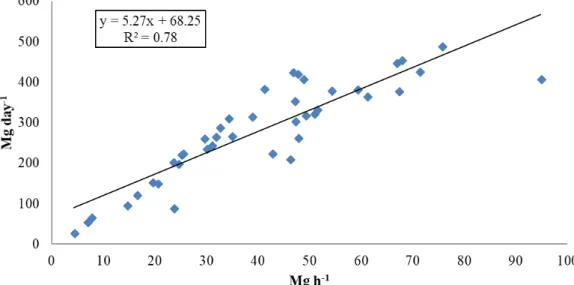
The harvester’s working capacity per hour was increased as the operating capacity per day was increased (Figure 1). The correlation coefficient (R2 = 0.78) indicates that 78% of the data on the harvester’s production per day is represented by the
working capacity per hour.
FIGURE 1. Operational capacity of eight sugarcane harvesters (Mg day-1) as a function of operational capacity (Mg h-1) at the
Rosa (2013) analyzed 13 studies and compared the operational capacity (Mg h-1) of sugarcane harvesters
according to the speed of advancement of the harvester and number of sugarcane rows harvested at the same time and found values ranging from 25.00 to 200.00 Mg h-1. The high
variability in the harvester’s working capacity indicates that other factors should be evaluated in the mechanized harvesting process. Testa (2014) reported that the increase in the number of sugarcane rows harvested simultaneously and the increased machine speed were directly associated with the increase in the effective field capacity of the harvester.
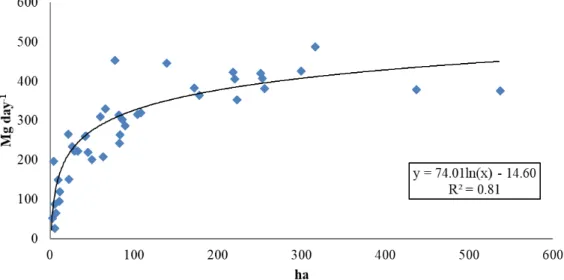
Property size
Property size directly affected the operational capacity of sugarcane harvesters, both in Mg day-1 and Mg
h-1, and the obtained logarithmic function (R2 = 0.81 and
0.66) indicated a strong positive correlation between these two variables (Figures 2 and 3). The correlation coefficient values evidenced that these two variables had good representativeness for use in the model. In addition, the adjustment of the logarithmic function (Figure 2) indicated that an increase from 100 to 200 ha resulted in an increase of 91% in the operational capacity in Mg day-1, whereas an
increase from 400 to 500 ha resulted in an increase of 5% in the operational capacity. Harvester performance is strongly associated with property size because of two factors: i) loss of time changing the harvesting strategy from one farm to another, which may be aggravated by the distance between properties; ii) length of crop rows considering that larger properties provide better conditions for planting longer sugarcane rows.
FIGURE 2. Operational capacity (Mg day-1) of eight sugarcane harvesters as a function of crop area at the 2015 harvest at the
Caeté Plant – Pauliceia Unit.
FIGURE 3. Operational capacity (Mg h-1) of eight sugarcane harvesters as a function of property size at the 2015 harvest at the
Harvester capacity was lower in smaller areas (Figures 2 and 3). Under the same topographic conditions, larger crops tend to have longer sugarcane rows, reducing the number of maneuvers at the end of the rows and reducing harvesting time. Ramos et al. (2016) observed that small areas decreased harvester efficiency and significantly increased fuel consumption.
Considering the effect of property size on the operational capacity of sugarcane harvesters, selecting larger areas for sugarcane cultivation is essential for optimizing the mechanized resources because these areas affect the estimation of the number of harvesters and the cost of production. Santos et al. (2014) found that the cost of mechanized harvesting was decreased as the cultivation area was increased.
Property size determines the crop area and consequently the length of sugarcane rows. The orientation of sugarcane rows defines crop yield and the operational cost of harvesters. Therefore, property size should be carefully evaluated by farm managers when making decisions that affect the final cost of production but may jeopardize the production system if other factors, including topography and the risk of erosion, are not considered.
CONCLUSIONS
Property size in isolation was strongly and positively correlated with the operational capacity of sugarcane harvesters in both Mg day-1 and Mg h-1.
Harvester performance is strongly associated with property size because of two factors: i) loss of time changing the harvest strategy from one farm to another, which can be aggravated by the distance between properties; (ii) length of crop rows.
Although the performance of machine operators strongly affects harvester performance, the conditions under which these machines are used determine the effective operating capacity and, consequently, the operating cost.
ACKNOWLEDGMENTS
To the Board of Directors of the Carlos Lyra group for providing the data and the Paulicéia Unit team of the Caeté Plant for creating the database.
REFERENCES
Banchi AD, Lopes JR, Martins JMS, Dimase M (2012) Capacidade operacional de colhedoras de cana-de-açúcar – Modelagem matemática em função da produtividade agrícola e da vida da máquina. Agrimotor (77):42-45.
Banchi AD, Lopes JR, Rocco GC (2009) Estudo da eficiência de disponibilidade mecânica em frotas agrícolas. Agrimotor (47):10-12.
Bramucci M, Seixas F (2002) Determinação e quantificação de fatores de influência sobre a produtividade de “harvesters” na colheita florestal. Scientia Florestalis (62):62-74.
CONAB – Companhia Nacional de Abastecimento (2017) Séries históricas. Available in:
http://www.conab.gov.br/conteudos.php?a=1252&t=&Pagi na_objcmsconteudos=2#A_objcmsconteudos. Accessed: Aug 01, 2017.
Farías MR, López ME, Brito JM, Castrejón JT, Cerro CC (2016) Analysis of the mechanized cutting process of sugarcane: a case study. Imperial Journal of
Interdisciplinary Research 2(10).
IEA – Instituto de Economia Agrícola (2015) Mecanização na colheita da cana-de-açúcar atinge 84,8% na safra agrícola 2013/14. Available in:
http://www.iea.sp.gov.br/out/verTexto.php?codTexto=136 01>. Accessed: Aug 01, 2017.
Neungmatcha W, Sethanan K (2015) Optimal mechanical harvester route planning for sugarcane field operations using particle swarm optimization. KKU Engineering Journal 42(2):125-133.
Peloia PR, Milan M, Romanelli TL (2010) Capacity of the mechanical harvesting process of sugar cane billets. Scientia Agricola 67(6):619-623.
Ramos CRG, Lanças KP, Santos RS, Martins MB, Sandi J (2016) Eficiência e demanda energética de uma colhedora de cana-de-açúcar em talhões de diferentes comprimentos. Energia na Agricultura 31(2):121-128.
Rosa JHM (2013) Avaliação do desempenho efetivo e econômico de uma colhedora de cana de açúcar (Saccharum spp.) em espaçamento duplo alternado. Dissertação Mestrado, Piracicaba, Universidade de São Paulo.
Santos NBD, Silva RPD, Junior G, Casimiro D (2014) Economic analysis for sizing of sugarcane (Saccharum spp.) mechanized harvesting. Engenharia Agrícola 34(5):945-954.
Testa JVP (2014) Desempenho operacional e energético de colhedoras de cana-de-açúcar (Saccharum spp.) para uma e duas linhas da cultura. 2014. 43p. Dissertação Mestrado, Jaboticabal, Universidade Estadual Paulista.
Zamunér Filho NA (2015) Planejamento e projeto de áreas de cana de açúcar: conservação do solo e logística da colheita. 2015. 214p. Tese Doutorado, São Carlos, Universidade de São Paulo.