Abstract— In this study, Ni-GDC Nano-powder was
synthesized via ion-exchange technique using sodium alginate as the templating material. Nanoparticles were obtained by controlling the calcination temperature. FE-SEM showed that the particle size of the grain decreased with the increase in the calcination temperature. Furthermore, pure NiO-GDC structure was obtained at the calcination temperature of 500 °C with no secondary phase present which is evident through the compositional characterization performed including XRD, FTIR and TGA analysis. The usage of ion-exchange sol gel technique has shown promising results to overcome high polarization observed at low operating temperature.
Index Terms— nanoparticles, ion-exchange sol gel, extrusion
dripping, solid oxide fuel cell
I. INTRODUCTION
OLID oxide fuel cell (SOFC) is an electrochemical device that converts the chemical energy of the hydrocarbon fuel directly to electrical energy [1-2]. Over the past few years solid oxide fuel cells (SOFCs) have drawn massive attention primarily due to their high efficiency that can reach up to 70% (pressurized hybrid system) which is almost twice the efficiency of the modern plants and engines (30-40% efficient) [1, 3]. Other motives for the development of SOFCs are facts such as being clean, simple having long-term stability and also known as a sustainable source of energy, having zero emission of greenhouse gases [1, 3-4]. All these features owned by the SOFC is one of the main reasons for the production of an effective fuel cell, as nowadays the motive of many engineering research is focused on producing a source of energy which is environmentally and economically viable. Moreover, the performance of a SOFC highly depends on the structure of the material used inside the fuel cell. Reducing the size of
Manuscript received June 10, 2016; revised July 22, 2016. This work was supported in part by the Ministry of Education, Malaysia under Grant number FRGS/2/2014 TK05/MUSM/02/1.
Cheng Keong Choo is with School of Engineering, Monash University Malaysia, Jalan Lagoon Selatan, Bandar Sunway, 47500 Subang Jaya, Selangor, Malaysia (e-mail: [email protected]).
Bahman Amini Horri is with Department of Chemical & Process Engineering, Faculty of Engineering and Physical Sciences, University of Surrey, Surrey GU2 7XH, United Kingdom (e-mail: [email protected]).
Babak Salamatinia is with School of Engineering, Monash University Malaysia, Jalan Lagoon Selatan, Bandar Sunway, 47500 Subang Jaya, Selangor, Malaysia (Tel: +603-55146249, Fax: +603-55146207, e-mail: [email protected]).
the material into nano range could increase the performance of a fuel cell about 100 times more as compared to the microstructure constructed SOFCs. Therefore, new routes are developed for producing nanomaterial at low temperature and further controlling the morphology, homogeneity of the nanostructure that would eventually lead to better electrochemical properties and high-efficiency fuel cells.
Anode is usually the thickest material in the SOFC and provides the mechanical support to the cell. In order to fulfill the mechanical strength properties as well as electrochemical properties, typically metals are utilized [3, 5]. However, the drawback of using metals in SOFC is the thermal limitations to the material which could easily be damaged [3]. The anode material should be porous to allow the passage of fuel towards the electrolyte.
Various synthesis techniques have been adopted over the past few years to prepare a desired material for low temperature solid oxide fuel cell (LT-SOFC) which include, co-precipitation reaction [6], hydrothermal synthesis [7], sol-gel process , solid-state reaction [8], and glycine nitrate process [9-10]. A lot of parameters are required to be controlled when performing the synthesis technique to
overcome problems such as inadequate sintering
temperature, non-homogeneous structure, poor particle distribution and surface area [8]. A new route using ion-exchange sol-gel technique is used to synthesize the NiO/GDC material, as it is a versatile route that can produce low cost material using cheap equipment. It is suggested that the usage of such method will help in cost reduction, long-term stability with minimal degradation of the material [1, 11-12] but results in high polarization loss of the electrode [13]. In this study, a potential new green route of sol-gel ion-exchange technique is used to synthesize NiO/GDC nanocomposite. To the knowledge of the authors so far synthesis of low temperature anode nanocomposite composed of NiO, Gd2O3 and CeO2 by using ion-exchange
sol-gel process route has not been reported. This nanocomposite is believed to carry the potential of reducing the size of the nanocomposite produce to overcome the problem of high polarization resistance. In this study the The effect of calcination temperature for the synthesis of NiO-GDC by Ion-Exchange sol gel method is studied closely to understand the links between the properties of the synthesized products.
Synthesis and Characterization of Nickel (II)
Oxide/Gadolinium-Doped Ceria (NiO/GDC)
Nanocomposites As a Potential Material for
Anode Supported LT-SOFCs
Cheng Keong Choo
1, Bahman Amini Horri
1,2, and Babak Salamatinia
1,*II. MATERIALS AND METHODS
A. Materials
Sodium Alginate (LF20/40, 65-75% guluronate) was obtained from FMC Biopolymer. Cerium (III) nitrate hexahydrate, gadolinium (III) nitrate hexahydrate and nickel (II) nitrate hexahydrate of 99% purity were purchased from Sigma-Aldrich which was used in the preparation of metal nitrate solutions. All the chemicals used in the study were of Analytical Grade.
B. Experimental Procedure
Sodium alginate (Na-Alg) was first dissolved in desired amount of deionized water in a water bath maintained at 80°C and stirred at a rate of 100 rpm by a magnetic stirrer to allow a homogeneous dispersion. Na-Alg solution was then cooled down to room temperature (27±2 ºC) before being dripped. The metal nitrates (Cerium (III) nitrate, Gadolinium (III) nitrate, Nickle (II) nitrate) were then dissolved in 81.27 ml of deionized water in a 500 ml measuring cylinder. After both the alginate solution and the metal nitrate solution is prepared, Na-Alg was dripped using a 0.6 mm needle with 20 mm internal diameter syringe in the metal nitrate solution, while the solution is constantly being stirred by a magnetic stirrer at 100 rpm. The dripping is performed using a syringe pump at a rate of 0.7 ml/min. After the dripping is complete the solution containing beads is left for a contact time of 24 hr at a stirring rate of 100 rpm to ensure maximum ion-exchange between the metal ions and Na-Alg beads at room temperature. The beads are then filtered by using a filter paper and washed with deionized water. The beads were then transferred into petri dishes and oven dried at 60°C for 24 hr. Finally the dried sample of the beads underwent calcination in the furnace at varying temperatures of 400oC, 500oC and 600oC at fixed calcination time of 6 h with an increasing temperature ramp of 5°C/min. The product samples were then characterized using various characterization methods, namely Field Emission Scanning Electron Microscopy (FESEM, S-3400N Hitachi), X-ray Diffractometry (D8 Discover Bruker), Thermalgravimetric Analysis (TGA Q50), Fourier Transform Infrared Spectroscopy (FTIR, NICOLET 1810) and BET surface area (BET ASAP2020)
III. RESULTS AND DISCUSSION
A. Morphology Analysis
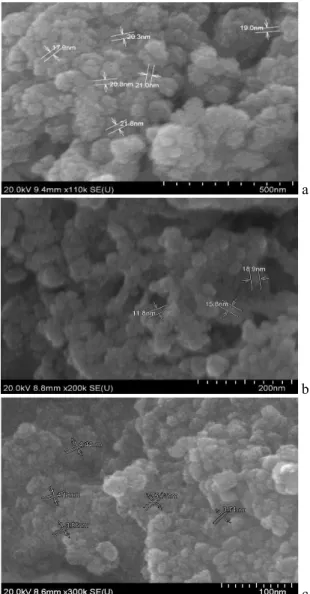
Fig. 1 and Fig.2 present the FE-SEM images for the morphology of the NiO-GDC and the grains behavior over the range of 400oC to 600oC. The particles demonstrate decrease in size with increasing calcination temperature with the smallest particles size obtained at 600°C at a calcination time of 6 hours. Commercial NiO and GDC particles size is reported by Park et al. to be 78.6 ± 10.5 nm and 86.7 ± 6.8 nm respectively [14]. Based on Fig. 1(a), it is observed that with a fairly homogeneous distribution of the particle with particle size of 19 nm was formed at the calcination temperature of 400°C which would have a great contribution in obtaining a porous microstructure. Furthermore, the Ni/GDC structure is observed to have more pores and has decreased grain size which is suitable for gas phase transport through the anode material when the temperature increases. The particle are less agglomerated and tend to be more evenly distributed at 500°C that can be seen by comparing
Fig. 1(a) and Fig. 1(b) which is the desirable need for the effective performance of the anode.
Further increasing the temperature to 600°C decreases the grain size to a great extent with an average particle size of 4.18 nm. However, it was observed that a high amount of agglomerates are formed in the structure. A homogeneous distribution could still be observed, however, the increase in the agglomeration of particle could decrease the surface area of the microstructure which is not desirable for the anodic performance. Analysis of the trend for NiO-GDC structure over the range of calcination temperature shows that the increase in the calcination temperature could decreases the grain size of NiO-GDC. Porosity of the structure also changes with calcination temperature which is observed to increase with the temperature. Specific surface area depends on the particle size and the agglomeration of the structure, the surface area is predicted to increases with the calcination temperature as the particle size becomes smaller. Theoretically the highest surface area should be obtained from the calcinated sample of 600°C but the dominating effect of agglomeration of the particle tends to decrease the surface area and the porosity of the structure.
a
b
c Fig. 1. FE-SEM images for Ni/GDC product at (a) 400oC, (b)500oC and (c) 600oC
from the surface of the bulk phase nano-powder. Each needle has a uniform thickness (average of 30 nm) with equal sized length. Similar structure is formed as the temperature increase to 500°C that shows the formation of structure that gives a resemblance more towards a rod as the edges are not so pointy with an average width of 70 nm. Fig. 2(c) shows equally sized nanowires being produced that are also developed form the bulk phase of the nano structure. The bottom left of the image shows the formation of nanowires which might not be detected from the front view of the sample. As the temperature increases the needle structure nanocomposite is transformed into more ordered nanowires structure. This structure requires further analysis using EDX to confirm the component and uniform distribution of the metals within the synthesized material.
a
b
c Fig. 2. FE-SEM images for secondary Ni/GDC structure formation at (a) 400oC, (b) 500oC and (c) 600oC
B. X-Ray Diffraction Analysis (XRD)
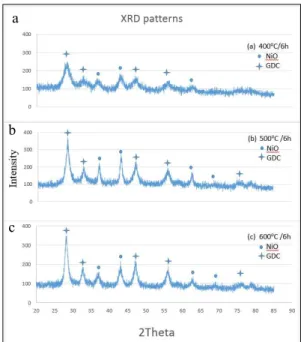
Fig. 3 shows the chemical composition of the calcinated sample of NiO/GDC nanoparticles at 400°C, 500°C and 600°C for 6 hours. It is observed that the synthesized sample calcinated at 500°C and 600°C show similar crystallite sizes due to similar intensities of the peaks [15]. It can be seen from the XRD images that the intensities of peaks increase significantly from 400°C to 500°C. This indicates that the crystalline size increasing rapidly with calcination temperature [16]. Furthermore, the NiO and GDC crystalline
phases were shown to be cubic and fluorite structures, respectively. Moreover, it was also seen that the NiO calcinated at 400°C show lower intensity peaks as compared to the other two calcination temperatures. This suggest that the Ni(OH)2 present in the nanopowder calcinated at 400°C
might have not been fully converted to NiO. Furthermore, it is seen that no traces of Ni could be detected from the XRD results which indicates that the NiO formed has not been reduced during calcination. This usually occurs if the powder is reduced under hydrogen (H2) rather than air. XRD
pattern shows relatively sharp peaks of GDC for 500°C and 600°C as compared to 400°C, this explains the formation of GDC when Gd2O3 has been integrated fully into CeO2 [17].
This can also be observed from Fig. 3(a) as no peaks for GDC could be detected from the XRD results which signify that not enough GDC has been formed yet at that particular calcination temperature.
Fig. 3. XRD patterns for NiO-GDC calcinated at (a) 400oC, (b) 500o C and
(c) 600oC.
C. Fourier Transform Infrared Spectroscopy (FTIR)
Fig. 4 shows the results obtained from FTIR analysis for the as prepared NiO/GDC composites calcinated at various temperatures and the samples before calcination. The FTIR for the dried gel in Fig. 4(d) shows a strong and broad peak ranging from a wavelength of 3200-3600 cm-1 which corresponds to the H-bonded stretching vibration of the O-H functional group [18]. This peak is due to the formation of Ni(OH)2 hydroxyl group when all the aqueous nitrates and
alginate were mixed to form beads where the O-H group was still present inside after drying. The wavelength within the range of 1000 cm-1 to1700 cm-1 shows absorbance of carbonaceous bonds. This is due to the polymeric compound, sodium alginate, which is present inside the dried sample.
In all the dried beads after calcination at 400oC, 500oC and 600oC no peaks is observed at approximately around 3500cm-1 which indicates that the Ni(OH)2 within the
structure has being converted into nickel oxide completely. a
b
This was also confirmed by XRD pattern as it shows all the peaks of NiO and no peaks for Ni(OH)2. Furthermore, there
were no peaks detected at 2850cm-1 and 2920cm-1 corresponding to C-H and O-H stretch for the calcinated NiO-GDC nanocomposites.
Apart from that, the analysis of the calcinated samples at different temperature shows similar peaks at the same wavelengths. This indicates that all the calcinated samples have almost the same bond compositions excluding the powder calcinated at 400oC. As seen from Fig. 4(b), there are a few peaks ranging from 1000-1700 cm-1 which corresponds to the stretching of COO-, C-H, C-O, C-C, C-N bonds vibrations [3, 18]. Furthermore, the absorption peaks in Fig. 4a, Fig. 4b and Fig 4c at 500-700cm-1 is attributed to the stretching of the Ni-O and Ce-O-C (GDC) bonds [18-19]. Moreover, the samples calcinated at 500oC and 600oC show presence of only NiO and GDC which indicates that the samples are in the pure phase.
Fig. 4. FT-IR adsorption spectrum for NiO-GDC calcinated at (a) 400oC
for 6h, (b)500o C for 6h and (c)600oC for 6h and (d) dried gel
D. Thermalgravimetric Analysis (TGA)
TGA was performed on the dried samples to determine the relation between the decreases in the weight percentage of the sample as a function of increasing temperature. The change in the phase can be detected due to the dehydration, oxidation and decomposition that can help in correlating the chemical structure of the sample. Fig. 5 shows the TGA analysis of the dried sample with three major weight loss stages as observed from the TGA plots. The first drop occurs from 50°C to 180°C with a 10% decrease in the weight which corresponds to the dehydration of the dried sample due to the presence of water molecule. The second decrease in the weight loss occurs between 180°C to 300°C, which is due to the decomposition of polymeric organic precursor (alginate) that remained after the process of drying as it was carried at a low temperature of 60°C. Another reason for this decrease is the decomposition of the byproduct nickel hydroxide (Ni(OH)2), cerium hydroxide
(Ce(OH)4) and gadolinium hydroxide (Gd(OH)3) to their
oxides, the literature provides the theoretical weight loss to be 17.8% and 17.3% for (Ni(OH)2) and (Ce(OH)4),
respectively [18, 20]. Weight loss of approximately 35% (90-55%) occurred for the second drop, and the third major drop in the weight occurs at 360°C to 500°C with a 30% (55-25%) decrease in the weight. The third stage of weight loss represents the oxidation of carbon to CO bond that
formed as a byproduct during the thermal heating of the dried sample. Combining the total weight loss yields a high value of 75% by weight that attributes to the presence of significant amount of water, organic solvent, oxidation of carbon and decomposition of hydroxyl bonds. The main finding of this analysis revealed that further increase in temperature above 500°C provides no weight loss in the samples which indicates the complete combustion and formation of metal oxide, concluding that calcination temperature of 500°C is suitable to provide pure NiO-GDC nanocomposite with no secondary phases.
Fig. 5. TGA plot of (a) Weight % vs. Temperature and (b) Weight vs. Temperature for the dried nanocomposite samples before calcinaion
E. Surface Area Analysis
As investigated before from the FE-SEM images in Fig. 1, the porosity of each calcinated NiO-GDC powder changes with the calcination temperature. BET measures the pore size, surface area and pore volume of the mesoporous powder, which is interrelated to the triple phase boundary of the anode material. Results obtained from BET for the surface area of the calcinated powder are 18.4 m2/g, 22.1 m2/g and 15 m2/g for the calcination temperature of 400°C, 500°C and 600°C, respectively. The surface area of the commercial NiO-GDC powder (50:50 wt.%) is reported to be 8.63 m2/g [21]. The surface area of powder is as predicted earlier from the characterization test, where the highest surface corresponds to the NiO-GDC powder calcinated at 500°C. The surface area increases as the temperature is increased from 400°C to 500°C due to the reduction in the size of the nano-composite, however further increase in the calcination temperature to 600°C decreases the surface area to 15 m2/g which is even lower than the surface area obtained at 400°C due to the agglomeration of the very small particles formed during calcination.
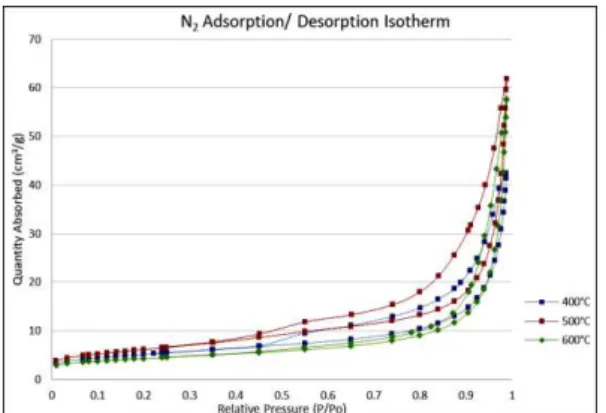
The N2 adsorption/desorption isotherm of NiO-GDC for
the calcination temperature of 400°C, 500°C and 600°C is seen in Fig. 6. The hysteresis loop developed is generally related to the condensation in the mesopore which plays a huge role in determining the structure of the pores. The narrow hysteresis loop indicates low porosity and disorder of the structure. As determined from the isotherm plot the loop is the widest for the calcination temperature of 500°C and narrowest for 600°C. The initial increase in the loops width at a higher temperature of 500°C relates to high porosity and uniformity in the microstructure with the least agglomeration, however further increase to 600°C causes agglomeration of the nano-composite, resulting in low surface area and poor quality of the mesoporous structure. (d) Dried gel
Fig. 6. N2 Adsorption/Desorption isotherm plot for the calcination
temperature of 400°C, 500°C and 600°C.
TABLE I shows the result for the surface area, pore size and pore volume of the calcinated sample at different temperature. Highest surface area is obtained at a temperature of 500°C, and the highest pore size of 29 nm is obtained from the calcination temperature of 600°C. Higher pore size is suitable for the gas phase transport through the pores, however based on the result from the isotherm plot, non-uniform pore structure is obtained at 600°C which will act as a barrier for the gas transport through the pores. Moreover, highest pore volume of 0.0965 cm3/g is attained by the calcination temperature of 500°C along with the high surface area and the pore size of 19 nm that is smaller than the pore size of 29 nm for 600°C, however the pore are uniform that result in effective gas phase transport through the structure.
Fig. 7 shows the pore size distribution for the calcinated sample at 400°C, 500°C and 600°C, where the distribution obtained for the calcinated sample at a temperature of 600°C has quite different pattern than the pore distribution obtained at the other two calcination temperature. The pore volume becomes zero at approximately around 120 nm for the temperature of 600°C, where the distribution pattern is non-zero over the pore diameter of around 80 nm and 40 nm for the temperature of 400°C and 500°C, respectively. Behaviour of the graphs illustrates that there are significant number of NiO-GDC mesopores in the calcinated sample of 400°C and 500°C, with small pore sizes as compared to the 600°C sample.
The lower limit of particle size distribution is influenced by the diameter of the micropores that are filled at the lowest pressure, according to the mean field theory [19].
Mesopores that are smaller than this have been filled at the lowest experimental pressure, which provides a very illogical result for the pore size distribution graph. This is because mean filed theory diverges when the pore size becomes smaller, which can be observed from the graph for the calcination temperature of 400°C and 500°C. In other words, smaller pore size is hard to measure due to the experimental limitation and can be calculated theoretically from the equation stated by N.quarke [22]. This takes into account both the upper and the lower limit (zero) for the particle size distribution.
The result obtained from the pore size distribution relates with the information provided in Table 1, where the highest pore size of 29 nm is obtained for 600°C that shows a logical graph for the pore distribution, however, as the pore size is decreased poor result quality of the pore size distribution is obtained. Therefore it was seen that a high ratio of mesopores are available in the microstructure of 400°C and 500°C as compared to the microstructure obtained at 600°C.
a
b
c Fig. 7. Pore size distribution for the calcination temperature at (a) 400°C, (b) 500°C and (c) 600°C.
IV. CONCLUSION
Successful synthesis of the Nickel (II) oxide/Gadolinium doped ceria was achieved using a new route of ion-exchange sol gel technique for the preparation of nano-composite that can be used as an anode material for low-temperature olid oxide fuel cell. The nanoparticles formed at the calcination temperature of 500°C were found to provide the most desirable characteristics for a high performance fuel cell. As the process produces nanoparticle which will result in the extended triple phase boundary and ultimately overcoming the problem of high polarization observed at low operating temperatures.
TABLEI
SURFACE AREA,PORE SIZE (NM) AND PORE VOLUME OBTAINED FROM BET
ANALYSIS FOR THE CALCINATED SAMPLES AT DIFFERENT TEMPERATURE.
Calcinatio n Temperat
ure
BET Surface
Area (m2/g)
Pore Size (nm)
Pore Volume (cm3/g)
B
JH
Ads
or
pti
o
n
B
JH
De
sor
pti
on
B
JH
Ads
or
pti
on
B
JH
De
sor
pti
on
400oC
18.4047 18.808 12.571 0.0638 0.0664 500oC 22.1327 19.133 13.742 0.0951 0.0965 600oC
ACKNOWLEDGMENT
The authors would like to acknowledge Monash University Malaysia for all the lab and analytical support. Mr. Faizan Azhar and Arsalan Azhar are highly appreciated for their assistance during this project.
REFERENCES
[1] V. Gil, et al., "Sinterability, microstructures and electrical properties of Ni/Gd-doped ceria cermets used as anode materials for SOFCs," Journal of the European Ceramic Society, vol. 27, pp. 4205-4209, 2007.
[2] H. N.T., et al., "Synthesis and characterization of
nanofiber-structured Ba 0.5 Sr 0.5 Co 0.8 Fe 0.2 O 3− δ perovskite oxide
used as a cathode material for low-temperature solid oxide fuel cells," Materials Science and Engineering, vol. 177, pp. 205-209, 2012.
[3] M. Aparicio, et al., Sol-Gel Processing for Conventional and
Alternative Energy: Springer Science & Business Media, 2012.
[4] C. Xia and M. Liu, "Microstructures, conductivities, and electrochemical properties of Ce 0.9 Gd 0.1 O 2 and GDC–Ni anodes for low-temperature SOFCs," Solid State Ionics, vol. 152, pp. 423-430, 2002.
[5] M. Mogensen, et al., "Physical, chemical and electrochemical properties of pure and doped ceria," Solid State Ionics, vol. 129, pp. 63-94, 2000.
[6] S. Mosch, et al., "Performance and stability of SOFC anode prepared by co-precipitation," Solid State Ionics, vol. 179, pp. 1606-1610, 2008.
[7] M. Hirano and E. Kato, "Hydrothermal synthesis of cerium (IV) oxide Powders," Journal of the American Ceramic Society, vol. 79, pp. 777-780, 1996.
[8] Z. Shao, et al., "Advanced synthesis of materials for intermediate-temperature solid oxide fuel cells," Progress in
Materials Science, vol. 57, pp. 804-874, 2012.
[9] C. Xia, "Low-temperature SOFCs based on Gd0.1Ce0.9O1.95 fabricated by dry pressing," Solid State Ionics, vol. 144, pp. 249-255, 2001.
[10] C. Xia, et al., "Reduced-Temperature Solid Oxide Fuel Cells Fabricated by Screen Printing," Electrochemical and Solid-State Letters, vol. 4, p. A52, 2001.
[11] S. Badwal and K. Foger, "Solid oxide electrolyte fuel cell review," Ceramics International, vol. 22, pp. 257-265, 1996. [12] d. Souza, et al., "Thin-film solid oxide fuel cell with high
performance at low-temperature," Solid State Ionics, vol. 98, pp. 57-61, 1997.
[13] M. C. Tucker, "Progress in metal-supported solid oxide fuel cells: A review," Journal of Power Sources, vol. 195, pp. 4570-4582, 2010.
[14] S.-Y. Park, et al., "Preparation of highly porous NiO– gadolinium-doped ceria nano-composite powders by one-pot glycine nitrate process for anode-supported tubular solid oxide fuel cells," Journal of Asian Ceramic Societies, vol. 2, pp. 339-346, 2014.
[15] D. A. d. Macedo, et al., "Electrical Conductivity and Microstructure of NiO-CGO Composites Prepared By One-Step Synthesis," ECS Transactions, vol. 50, pp. 21-31, 2013. [16] C. Ding, et al., "Synthesis of NiO–Ce 0.9Gd0.1O1.95
nanocomposite powders for low-temperature solid oxide fuel cell anodes by co-precipitation," Scripta Materialia, vol. 60, pp. 254–256, 2009.
[17] C. Xia and M. Liu, "Microstructures, conductivities, and electrochemical properties of Ce0.9Gd 0.1O2 and GDC–Ni anodes for low-temperature SOFCs," Solid State Ionics, vol. 152 pp. 423–430, 2002.
[18] Y.-P. Fu and C.-H. Lin, "Microwave-induced combustion synthesis of Ni–Zn ferrite powder and its characterization,"
Journal of magnetism and magnetic materials, vol. 251, pp.
74-79, 2002.
[19] N. Seaton, "Determination of the connectivity of porous solids from nitrogen sorption measurements," Chemical Engineering
Science, pp. 1895-1909, 1991.
[20] A. I. Y. Tok, et al., "Hydrothermal synthesis and characterization of rare earth doped ceria nanoparticles," Materials Science and Engineering: A, vol. 466, pp. 223-229, 2007.