Arq. Bras. Med. Vet. Zootec., v.69, n.3, p.676-682, 2017
Egg production evaluation of laying hens by multivariate analysis
[Avaliação da produção de ovos de poedeiras por análise multivariada]
P.B. Ferreira1, P.R.N. Rorato2, F.C.B. Mello2, B. Bevilaqua2, A. Macedo2, L.B.P. Brittes2
1Universidade Federal do Pampa – Uruguaiana, RS 2Universidade Federal de Santa Maria – Santa Maria, RS
ABSTRACT
This study aimed to verify the existence of differences between hens from the Barred Plymouth Rock (PRB) breed and White Plymouth Rock (PRW) breed by multivariate analysis of weekly egg production and cumulative during the years of 1998 and 2010, from the Laboratório de Avicultura (LAVIC) of the Departamento de Zootecnia at the Universidade Federal de Santa Maria (UFSM). For the analysis of the univariate and multivariate variance, the experimental design was completely randomized with two treatments (breed) and 299 repetitions of the PRW breed and 350 of the PRB breed. The parameters analyzed were the weekly productions of eggs per bird from the 21st to the 50th week of age (P21, P22, ..., P50) and production of eggs accumulated being from the 21st to the 25th (PA1), 21st to the 30th (PA2), 21st to the 35th (PA3), 21st to the 40th (PA4), 21st to the 45th (PA5) and 21st to 50th (PA6). Analyzes of univariate and multivariate variance were conducted and the comparison of means were made by "T" Student and Wilks respectively (P < 0, 05). Based on the results, an analysis of the principal components was performed with parameters PA1, PA2, PA4, PA5 and PA6. With the average egg production per family accumulated, a cluster analysis using Euclidean distance and single linkage method (nearest neighbors) was performed. The first two principal components meet the total variation in egg production accumulated from the 21st to 25th, 21st to 30th, 21st to 40th, 21st to 45th and 21st to 50th weeks of age. Most of the phenotypic variation of the layers can be explained by the production of eggs accumulated from the 21st until the 40th week of age, and this variable is highly correlated with total egg production. Families from the PRW and PRB breed form seven distinct groups, but homogeneous by the similarity between them. This allows direct crossings between different groups, in the pursuit for heterosis.
Keywords: analysis of multivariate variance, cluster, principal components
RESUMO
Objetivou-se verificar a existência de divergência entre poedeiras das raças Plymouth Rock Barrada (PRB) e Plymouth Rock Branca (PRW) por meio da análise multivariada da produção de ovos semanal e acumulada dos anos de 1998 e 2010, do Laboratório de Avicultura (Lavic) do Departamento de Zootecnia da Universidade Federal de Santa Maria (UFSM). Para as análises de variância uni e multivariada, o delineamento experimental foi inteiramente ao acaso, com dois tratamentos (raças) e 299 repetições da raça PRW e 350 da raça PRB. Os parâmetros analisados foram a produção de ovos semanal por ave da 21ª à 50ª semana de idade (P21, P22,..., P50) e a produção de ovos acumulada, sendo da 21ª à 25ª (PA1), 21ª à 30ª (PA2), 21ª à 35ª (PA3), 21ª à 40ª (PA4), 21ª à 45ª (PA5) e 21ª à 50ª (PA6). Realizaram-se as análises de variância uni e multivariada, e a comparação de médias foi feita pelos testes “T” de Student e de Wilks, respectivamente (P<0,05). Com base nos resultados, foi realizada a análise de componentes principais, com os parâmetros PA1, PA2, PA4, PA5 e PA6. E, com as médias de produção de ovos acumulada por família, foi realizada a análise de agrupamento por meio da distância euclidiana e pelo método de encadeamento único (vizinhos mais próximos). Os dois primeiros componentes principais reúnem a variação total da produção de ovos acumulada da 21ª à 25ª, 21ª à 30ª,
21ª à 40ª, 21ª à 45ª e 21ªá 50ª semanas de idade. A maior parte da variação fenotípica das poedeiras pode ser explicada pela produção de ovos acumulada da 21ª até a 40ª semana de idade, e essa variável tem alta correlação com a produção de ovos total. As famílias da raça PRW e da raça PRB formam sete grupos distintos, mas homogêneos, pela similaridade existente entre elas, o que permite direcionar cruzamentos entre os diferentes grupos, em busca da heterose.
Palavras-chave:análise de variância multivariada,agrupamento,componentes principais
INTRODUCTION
Egg production is a trait controlled by many pairs of genes, and is influenced by the environment; it has great influence on the relationship between income/cost on egg production commercial activity. To improve this relation, new methodologies to improve the selection process of laying hens have being studied, in order to maximize gains. In egg production evaluation, the information obtained by univariate analysis may be incomplete, especially when the variables are correlated (Paiva et al., 2010). The multivariate analysis evaluates a set of characteristics simultaneously taking into account the existence of correlation, evaluating more accurately the differences
between the treatments (Cohen et al., 2003).
The multivariate analysis of principal components, takes into simultaneous account all the interest characteristics, each component being a linear combination of a trait. This analysis has the property of retaining, in the first estimate, components the major fraction of the
observed variation (Abreu et al., 1999). The
principal component analysis can reveal
correlations not previously identified,
contributing to a better interpretation of the data
(Yamaki et al., 2009). However, evaluation of
the divergence in graphical analysis and the establishment of similarity groups based on visual inspection of the dispersion through the analysis of the main components are questionable and may not be present a clear view of the degree of similarity between the individuals studied. Supplemental information is recommended beyond the principal components using cluster analysis techniques, which allows the establishment of groups in a less subjective
way than visual examinations (Barbosa et al.,
2006).
The objective of this study was to verify the existence of differences between Barred
hens by multivariate analysis of weekly egg production and cumulative by periods.
MATERIALS AND METHODS The egg production data used to this study was collected from 1998 to 2010 from Barred Plymouth Rock (PRB) and White Plymouth Rock (PRW) breeds laying hens, from the Laboratório de Avicultura (LAVIC) of Universidade Federal de Santa Maria (UFSM) Departamento de Zootecnia. Both breeds are composed by hens from different families, six from PRW and 11 from the PRB.
These hens are originated from annual crosses within breed families with the objective of minimizing inbreeding and taking advantage of the complementarity and heterosis. The hens were raised in an experimental laying cages measuring 0,33 x 0,45 x 0,40m, with capacity for two animals, containing a water cooler cup type and a feeder trough type. During all growing phases, the birds received the same nutritional, health and environment management, being subjected to up to 17 hours/light/day program.
Water and feed were provided ad libitum, and
the feed served provided the nutritional requirements of each production phase.
The characteristics evaluated were: number of
eggs produced/bird/week from the 21st to the 50th
week of age (P21, P22, P23, ...., P50) and egg production accumulated as follows: production from the 21st to the 25th (PA1), 21st to the 30th
(PA2), 21st to the 35th (PA3), 21st to the 40th
(PA4), 21st to the 45th (PA5) and 21st to the 50th
(PA6) week of age, totalizing 36 variables. To obtain the normal distribution, the variables were transformed using the formula 1 x +3, where x is the characteristic measured.
with two treatments (breeds) and 299 repetitions for PRW and 350 repetitions for PRB, using the following statistical model: Уijk = μk + i+ ε ik; where: Уikj = observed value of the k-th variable, of the i-th breed of the j-th repetition; μk = mean of the k-th variable;i = the effect of the i-th breed on the k-th variable; e ε ijk = effect of the random error. The "t" Student test was used (P <0.05) to compare the ANOVA means, with means adjusted by Least Square Means Method. The hypothesis of nullity to the treatment effects in the MANOVA, the Wilks test was used.
The analysis of the principal components (PC) was performed in order to identify which productive variables explained the greatest part of total data variability. This analysis was performed based on the correlation matrix (R) which consists in transforming a set of variables Z1, Z2, ..., Zp (estimated parameters) in a new set of variables Y1 (PC1), Y2 (PC2) ..., Yp (PCp) (Regazzi, 2002). Thus, a new set of variables p not correlated and arranged in order of decreasing variance was defined. Therefore, the coefficients of the principal components are indicators of the magnitude of the correlation between the standardized variables and key components.
To evaluate the differences between families within and between breeds, a cluster analysis was held, using as variables the average cumulative egg production per household in different periods except the period 21-35 (PA3) week of age, which did not show significant difference in previous analyzes. To measure the distance between the variables, the Euclidean dissimilarity matrix (Regazzi, 2002) was used. The clustering method used was the single chain (single linkage), which is based on the minimum distance or on the nearest neighbor rule. In this method, the first two individuals grouped are the ones who presented the shortest distance between them. The shortest distance is identified by grouping the third subject with the first two or by forming a new group of two individuals.
At each stage the distance between two groups is defined as the distance between its two nearest points. Two groups can be incorporated at each stage through the shortest chain between them (Vicini, 2005). Analyses were performed using
using the procedures PROC GLM (analysis of univariate and multivariate variance), PROC PRINCOMP (Principal components) and PROC DISTANCE, PROC CLUSTER and PROC
TREE (cluster analysis) from SAS ®, (2001).
RESULTS AND DISCUSSIONS
The univariate analysis of variance for the variables that were significantly different among breeds (P <0.05) are in tab. 1, where the differences between breeds occurred in general, at every five weeks and the PRB hens produced more eggs than PRW hens from 21st to 26th
week of age, which represents the initial phase of posture and the peak. After this period the PRW hens presented higher egg production until the 50th week of age. This analysis was used to
define the egg production accumulated periods to be analyzed.
Only the cumulative eggs production during the period of 21-35 (PA3) weeks of age, was not statistically different between the breeds. From 21st to 25th and 21st to 30th weeks of age periods
(PA1 and PA2), PRW hens had lower cumulative eggs production than PRB hens, but for the remaining periods that production was surpassed, agreeing with the weekly results (Tab. 1).
Accumulated eggs production PA1, PA2, PA4, PA5 and PA6 were significantly different between PRB and PRW breeds at uni variate analysis and were submitted to a multivariate analysis of variance (MANOVA), with significant differences between the breeds evidenced by the Wilks test (P<0.01).
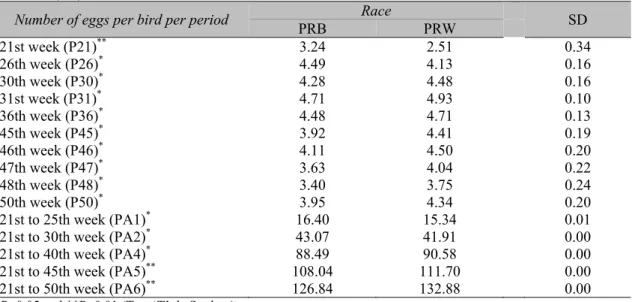
Table 1. Analysis of variance of the number of eggs produced per bird per week and accumulated for a period of poultry breeds Barred Plymouth Rock (PRB) and White Plymouth Rock (PRW) and standard deviation (SD)
Number of eggs per bird per period PRB Race PRW SD
21st week (P21)** 3.24 2.51 0.34
26th week (P26)* 4.49 4.13 0.16
30th week (P30)* 4.28 4.48 0.16
31st week (P31)* 4.71 4.93 0.10
36th week (P36)* 4.48 4.71 0.13
45th week (P45)* 3.92 4.41 0.19
46th week (P46)* 4.11 4.50 0.20
47th week (P47)* 3.63 4.04 0.22
48th week (P48)* 3.40 3.75 0.24
50th week (P50)* 3.95 4.34 0.20
21st to 25th week (PA1)* 16.40 15.34 0.01
21st to 30th week (PA2)* 43.07 41.91 0.00
21st to 40th week (PA4)* 88.49 90.58 0.00
21st to 45th week (PA5)** 108.04 111.70 0.00
21st to 50th week (PA6)** 126.84 132.88 0.00
*P<0.05 and **P<0.01 (Test ‘T’ de Student).
Table 2. Eigenvalues, total variance and cumulative principal component (PC) estimated by cumulative egg production of birds breed Barred Plymouth Rock and White Plymouth Rock
Principal components Eigenvalues Total variation (%) Acccumulated variation (%)
PC1 3.46 69.22 69.22
PC2 1.12 22.31 91.53
PC3 0.25 4.95 96.48
PC4 0.12 2.49 98.97
PC5 0.05 1.03 100.00
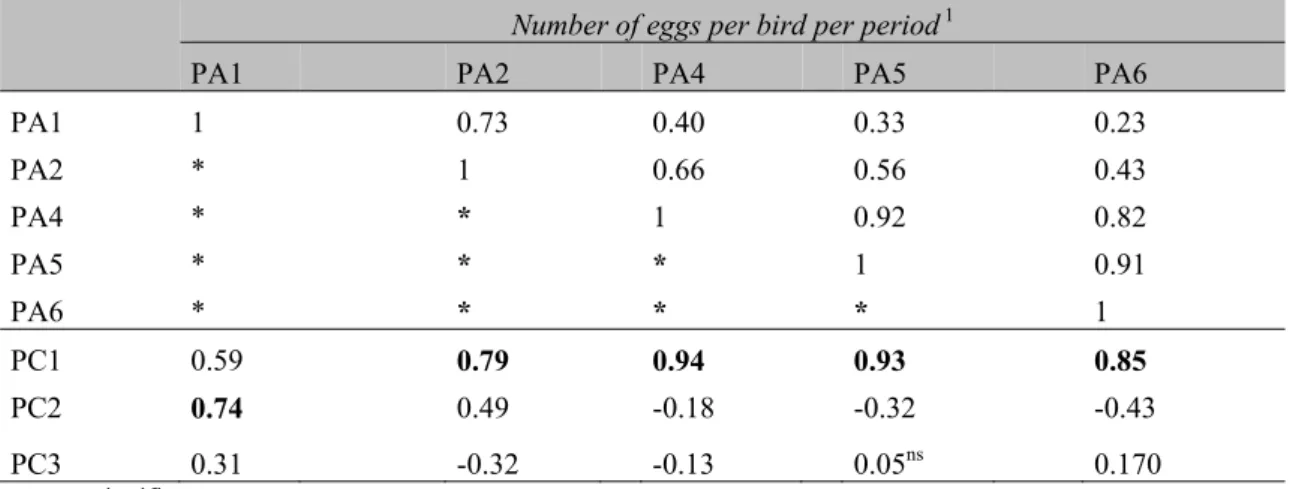
The correlations between the cumulative production of eggs and the first principal component were high, the highest correlations observed being 0.94 and 0.93 for PA4 and PA5, respectively (Tab. 3). Regazzi (2002) points out that the variable with the highest correlation coefficient with the principal component of smaller variance is less important in explaining the total variance and therefore susceptible to
discard. Egg production accumulated from 21st to
25th week of age (PA1) correlated below 0.7 with
the PC1 and had the highest correlation with the PC3 (0.31). Following the criteria suggested by Jolliffe (1973) and Regazzi (2002), variable PA1 can be discharged (Tab. 3).
Therefore, selection of laying hens is indicated after 30 weeks of age, and the best time would be at 40 weeks in which egg production is more correlated with the 1st PC (0.94) and with the
total production (PA6, correlation of 0.82), as shown in Table 3. Paiva et al. (2010) analyzed the average laying rate from 26th to 58th week of
age and found that the rate of posture is an important feature for the selection of laying hens, since it has correlation with the first principal
components. However, Abreu et al. (1999)
observed that the first component has high correlation with the total period of production (24th to 56th week of age), and the second
principal component is more correlated with the
number of eggs from 24th to 32nd week and from
Table 3. Estimates of correlations between cumulative yield (PA1, PA2, PA4, PA5 and PA6) and between cumulative yield and the major components (PC1, PC2 and PC3)
Number of eggs per bird per period 1
PA1 PA2 PA4 PA5 PA6
PA1 1 0.73 0.40 0.33 0.23
PA2 * 1 0.66 0.56 0.43
PA4 * * 1 0.92 0.82
PA5 * * * 1 0.91
PA6 * * * * 1
PC1 0.59 0.79 0.94 0.93 0.85
PC2 0.74 0.49 -0.18 -0.32 -0.43
PC3 0.31 -0.32 -0.13 0.05ns 0.170
ns = not significant.
1PA1- egg production from 21st to 25th weeks of age, PA2- egg production from 21st to 30th weeks of age, PA4 -
egg production from 21st to 40th weeks of age, PA5 - egg production from 21st to 45th week of age and PA6 - egg production from 21st to 50th week of age.
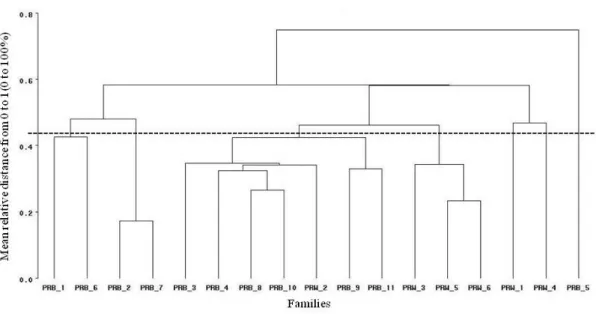
Cluster analysis was performed with the average of the cumulative egg production per family. Eleven families of the Barred Plymouth Rock breed (PRB1, PRB2, PRB3, PRB4, ..., PRB11) and six families of the White Plymouth Rock (PRW1, PRW2, ...., PRW6) were analyzed. The PRB2 PRB7, PRW5 and PRW6, PRB10 and PRB8 families were the closest, with estimates of Euclidean distance of 0.50, 0.67 and 0.76, respectively. The highest observed distances between breeds were 6.42 and 6.07 and between the families PRW4 and PRB1 and between PRW4 and PRB7, and among the families of the same breed, the greater distance observed was between PRB7 and PRB5 (5.96) and between PRW4 and PRW5 (4,31).
The clusters obtained by the method of single thread (nearest neighbors) can be seen in the dendrogram of Figure 1. According to Vicini (2005) there is still no theory that determines at what point a cut should be made in the dendrogram to define the number of groups to be formed, so it is the researcher who must verify the importance of this distinction between the groups. In this work, the cut was in the 'y' axis (average distance relative) of the dendrogram (Fig. 1), between the distances of 0.40 and 0.50
(40% and 50%), aiming to form an optimal number of groups, with a possibility of direct couplings between them. Seven distinct homogeneous groups were formed, the first two groups were formed by two families each (PRB1 and PRB6; PRB2 and PRB7), the third group consisted of seven families (PRB3, PRB4, PRB8, PRB10, PRW2, PRB9 and PRB11), in this group, the PRW2 family was inserted even being from a distinct breed since it presented a proximity in relation to accumulated egg production with the families of the PRB breed. The fourth group consisted of three families (PRW3, PRW5 and PRW6) and the last three by one family each (PRW4, PRW1 and PRB5).
Figure 1. Dendogram obtained from the Euclidean distance and single linkage clustering method, among families of races Barred Plymouth Rock and White Plymouth Rock considering egg production accumulated in different periods.
From the results of groupings observed and considering the large heterogeneity between different families (Carneiro et al., 2002), the crossings between PRB5 and PRB1, PRB4 and PRB5, PRW4 and PRW2 and between PRW4 and PRW5, may result in hybrid compounds with higher heterosis, enabling the recovery or formation of superior genotypes in subsequent generations. Taking the population into consideration, the results only prevent mating of similar animals; however it could only be affirmed that no inbreeding is occurring if there were information of the genealogy of these animals.
CONCLUSION
The first two principal components gather the total variation in egg production accumulated from 21st to 25th, 21st to 30th, 21st to t40th, 21st to
45th and 21st to 50th week of age. Most of the
phenotypic variation of the laying hens can be explained by the production of eggs accumulated from the 21st to 40th week of age, and this
variable is highly correlated with total egg production, which allows commencement of hen
selection from the 40th week of age. The six and
the eleven families from the PRW and PRB breeds form seven distinct groups, homogeneous among themselves and allows for direct
crossings between different groups in pursuit of heterosis.
REFERÊNCIAS
ABREU, V.M.N. Capacidade de combinação de características de produção de ovos de linhagens de matrizes de frango de corte, usando análise de
componentes principais. Rev. Bras. Zootec., v.28,
p.955-959, 1999.
BARBOSA, L.; LOPES, P.S.; REGAZZI A.J. et
al. Avaliação de características de qualidade da carne de suínos por meio de componentes
principais. Rev. Bras. Zootec., v.35,
p.1639-1645, 2006.
CARNEIRO, P.L.S.; FONSECA, R.; PIRES,
A.V. et al. Estudo da divergência genética entre
linhagens de matrizes de frangos de corte por
meio de análise multivariada. Arq. Bras. Med.
Vet. Zootec., v.54, p.75-83, 2002.
COHEN, J.; COHEN, P.; WEST, S.G.; AIKEN,
L.S. Correlation analysis for the behavioral
sciences. 3.ed. New Jersey: Mahwah, 2003. 691p.
CRUZ, C.D.; REGAZZI, A.J. Modelos
JOLLIFFE, I.T. Discarding variables in a
principal component analysis. II. Real data. Appl.
Stat., v.22, p.21-31, 1973.
MORRISON, D.F. Multivariate statistical
methods. New Delhi: McGraw-Hill, 1976. 415p. PAIVA, A.L.C.; TEIXEIRA, R.B.; YAMAKI, M. et al. Análise de componentes principais em características de produção de aves de postura. Rev. Bras. Zootec., v.39, p.285-288, 2010.
REGAZZI, A.J. Análise multivariada. Viçosa:
UFV, 2002. 166p.
SASUser's guide. Cary: SAS, 2001.
VICINI, L. Análise multivariada da teoria à
prática: caderno didático, Santa Maria: UFSM\CCNE, 2005. 215p.
YAMAKI, M.; MENEZES, G.R.O.; PAIVA,
A.L.C. et al. Estudo de características de
produção de matrizes de corte por meio da
análise de componentes principais. Arq. Bras.