Printed version ISSN 0001-3765 / Online version ISSN 1678-2690 http://dx.doi.org/10.1590/0001-3765201720160117
www.scielo.br/aabc | www.fb.com/aabcjournal
Estimated evolution of total pollutant gas emissions associated with vehicle
activity in the Metropolitan Region of Porto Alegre until 2030
ANGEL D. CHOVERTand MARCELO F. ALONSO
Centro de Pesquisas e Previsões Meteorológicas, Universidade Federal de Pelotas, Avenida Engenheiro Ildefonso Simões Lopes, 2751, 96060-290 Pelotas, RS, Brazil
Manuscript received on March 3, 2016; accepted for publication on May 15, 2017
ABSTRACT
In recent years, the majority of economic sectors in Brazil have gone through processes of development and transformation. These processes have led to increases in environmental pollution of all kinds; air pollution being one of the most adverse. The Brazilian transportation sector, which heavily affects the air quality, experienced a significant increase in its vehicle fleet thus provoking larger emissions of pollutant gases, mainly in regions with high population density such as the Metropolitan Region of Porto Alegre (MRPA). Within this research, considering mainly the ozone precursor species and Carbon Monoxide and using the year 2001 as a base year, scenarios are obtained for vehicular emissions of pollutant gases in the MRPA until the year 2030. In addition, scenarios related to the evolution of the study region’s vehicle fleet were estimated. The statistical tool LEAP (Long Range Energy Alternatives Planning System) was used. The scenario analysis shows that the vehicle fleet will grow exponentially until 2030, considering that the Light Flex vehicles category will mainly contribute to this increase. It is also noted that vehicle emissions of CO, NOx, and THC decrease in the region. The decrease is caused mainly by the renewal of technology in new vehicles and the implementation of emission control programs created by the government.
Key words: air pollution, bottom-up, emission scenarios, vehicle fleet.
Correspondence to: Angel Domínguez Chovert E-mail: [email protected]
INTRODUCTION
In the environmental pollution, the air pollution
has an important role, it affects considerably and in different ways the life of organisms. In polluted
environments, such as big urban areas, human
health can be severely damaged in medium and
long terms, product of the quasi permanent poor
air quality. Several studies have been showing the strict relation between the air quality, the respiratory
and cardiovascular diseases (Arbex et al. 2012, Mascarenhas et al. 2008, Santos et al. 2008).
The air quality depends primarily on the emissions of contaminating gases, classified according to the source: anthropic (caused by the man’s influence) or naturals (e.g. volcanic and biogenic). The anthropic sources associated with the technological activities can be divided in two categories: stationary and mobile. Each source
contributes in a different and specific way with the
the fulfillment of a complex analysis that involves
many factors. Furthermore, the pollutants emissions own a complex special and temporal variability associated with a high degree of uncertainties. Emissions by using inventories and emissions scenarios. The last one depends on a vast set of factors, such as, fuel prices, environmental policies, development of the industry and the progress level of technology.
Inventories provide a quantitative estimation of the pollutants released to the atmosphere by a determined source. In the other hand, scenarios estimate quantitatively how much the emissions associated to human activities will react with the different internal and external factors in which stands. Such information facilitates and assists the analysis of climatic changes, including modeling of the climate and evaluation of impacts, adaptation and mitigation, proportionating a useful tool for
the decision takers. The possibility that specifically
any one of the unique ways of emissions occurs, as it is described by the scenarios, is very remote.
These scenarios may be determined taking in consideration the various energetics and non-energetics sectors of a consolidated matrix. Nevertheless, for concrete studies, it is possible to obtain emission scenarios to only one sector, as it is the case of the transport sector that contributes meaningfully with the urban pollution. The produced ozone in the surroundings of urban areas comes from a complex interaction between the nitrogen oxides (NOx) and the volatile organic compounds (VOC’s), emitted in its majority (above 90 %) by automotive vehicles(Atkinson-Palombo et al. 2006); this demonstrates the importance and necessity to estimate the pollutants emission associated with the vehicular activity.
The elaboration of inventories and scenarios linked to transport is a hard task due to several
factors: (i) the behavior of the circulating fleet of
vehicles in each city, (ii) the pollutant emissions vary according the type, model and year of
fabrication of each vehicle, for instance, meaning specific emission factors, which are strongly dependent on (iii) driving patterns, which can
differ from a place to another, (iv) annual traveled
distance (use intensity) and (v) the autonomy of the vehicles (travelled distance per unity of fuel). The emission factors depends strongly on the vehicle’s conduction pattern, which may vary according to the local (Berkowicz et al. 2006).
Even with the high complexity that the researchers face in the confection of an emission scenario associated with the vehicular activity and the uncertainty of the results, this tool is crucial on the studies about air quality in the urban regions. It is common to use the information given by the scenarios as input data in numerical models for climatic studies. Many works in Brazil have focused attention on the study of the future impact in the air quality due to the changes in activities directly linked with the emission of contaminants (C.R. Mazzoli, unpublished data, M.F. Alonso, unpublished data, Teixeira et al. 2008). Alonso estimated emissions scenarios associated with the projection of the vehicular activity in Brazil for the period between 2003 and 2035. The author observed that the emissions of carbon monoxide (CO) and the non-methane hydrocarbons (NMHC) decreases comparing with the basis year 2010 due
to the renovation of the fleet and the implementation
atmosphere for the region, entailed with vehicles running on gasoline, alcohol, diesel, vehicular natural gas and motorcycles in 2004 (Teixeira et al. 2008). Nevertheless, for the MRPA it was not found information about the elaboration of future scenarios of vehicular emission that allows it to study the impact of these emissions on the air quality, such fact that motivated the realization of this study.
Given the situation described above and the importance of the atmospheric pollution estimation to apply pertinent policies by the governments on the control and mitigation of pollutants, the aim of this study is the elaboration of scenarios of total pollutant gas emissions associated with vehicles activity for the MRPA until 2030.
MATERIALS AND METHODS
It has been estimated scenarios of the vehicular fleet evolution, until 2030 in the MRPA, that proportionate detailed information about the vehicles quantity by type, age and utilized fuel. For this, it was necessary to characterize the existent
fleet in 2001 (year taken as basis for the creation of these evolution scenarios of the fleet) in the MRPA
and to estimate the license of new vehicles by categories and fuel, since 2002 until 2030, for the same region. It was utilized information available by several entities and organizations, among them the National Transit Department (DENATRAN), National Association of the Auto motors Vehicles Manufacturers (ANFAVEA), National Federation of the Auto motors Vehicles Distribution (FENABRAVE), Brazilian Association of Motorcycles, Motor-bicycles, Motor Scooter, Bicycles and Similar (ABRACICLO) and RBSC (Roland Berger Strategy Consultants).
Therefore, considering the scenarios of evolution of the vehicular fleet and using
information of parameters related to different types
of vehicles as (i) autonomy (distance traveled per
fuel unit), (ii) usage intensity (annual traveled distance) and (iii) emission factors (in g/km), there were obtained emission scenarios related to vehicular activity until 2030 for CO, NOx and total hydrocarbons species (THC) in the RMPA. It was applied the methodology bottom-up (http:// www.epa.gov/otaq/ap42.htm) and the statistics tool LEAP (Long range Energy Alternatives Planning System) that models the production processes and the energy consumption (Heaps 2012).
The methodology bottom-up founds the obtainment of the total emissions for a region in the sum of the total individual activities’ emissions. This approximation requires the use of detailed information of each one of the individual emission sources what means working with a big precision and a wide set of data. The other side of this methodology is the “top-down”, it is based on the total emissions’ calculation and therefore, in the accomplishment of a space distribution of the same ones, using patterns of distribution, it shows a satisfactory global precision if it is used the right parameters of the studies’ activities.
DESCRIPTION OF THE FIELD OF STUDY
The Metropolitan Region of Porto Alegre is located in the Rio Grande do Sul’s middle-east (RS), in the southernmost region of Brazil, comprising 34 counties distributed over an area of 10.097 km² corresponding to approximately 3.7 % of the RS’ territory. It is considered one of the most developed metropolitan regions in Brazil and one of the regions with the biggest population density, reaching over 4 million people, what is about 36.7 % of the state’s population. The most populated cities are Porto Alegre, Canoas, Gravataí and Novo Hamburgo. It is a highly urbanized region that characterizes itself
for having different industrial typologies, including
According to data from the Rio Grande do Sul’s Transit Department (DETRAN/RS, http://
detran.rs.gov.br/) in 2016, the vehicles fleet in Rio
Grande do Sul had a raise of 72.4 % in the last 10 years and it has a proportion of 1.8 people per vehicle nowadays.
STATISTIC TOOL LEAP
LEAP (Long range Energy Alternatives Planning System) is an integrated modeling tool that can be used to conduct a study about the energy consumption, production and the extraction of resources in all the sectors of an economy. It is also applicable to determine the greenhouse gases emissions in the energetic and non-energetic sectors. The LEAP has the capacity to operate in
two different conceptual levels, in the first level
the calculations incorporated in the LEAP take charge of measuring and working with all the non-conventional energy, the emissions and the
effective cost accounting. In the second level, the
users introduce information that can be used to specify the temporal variation to be applied in the
first level (http://www.energycommunity.org). This model surrounds the concept of scenarios analysis in a long term, which is another characteristic that supports the use of this tool in this investigation. The scenarios show how a system may evolve in time. The use of LEAP allows to create and evaluate scenarios taking in consideration the social benefits, cost and environmental impacts.
THE OBTAINMENT OF THE SCENARIOS OF VEHICLE FLEET EVOLUTION IN THE RMPA
A big set of data has been recompiled from several sources; these ones have been analyzed and inserted in the LEAP statistic tool. The selected basis year, or start year, for the creation of the scenarios was 2001, and this is because in this year precisely is
that it has the first detailed information about the
vehicles license by Brazilian municipalities.
The scenarios of vehicle fleet evolution, consists of annual information of the total quantity of vehicles by categories and by types of fuel that is utilized. The vehicular categories used in this work are: Light Vehicles (LV), Light Flex Vehicles (LFV), Light Commercials (LC), Light Flex Commercials (LFC), Trucks, Bus and Motorcycles (MT). It categories are based on the ones informed in the published documents by DENATRAN (http://www.denatran.gov.br/frota.htm).
The procedure, for the obtainment of the
Scenarios of vehicle fleet evolution, is described
as it follows:
Firstly, it was made the characterization of
the circulating fleet in the MRPA in the basis year of 2001 (Table I). It was utilized the data of fleet
for municipality that are annually informed by the DENATRAN.
The next step was the determination of the vehicles licensing by category and type of fuel in the period from 2002 to 2030 (Figure 1).
Regarding the period between 2002 and 2014, the new vehicles license by category have been extracted from the DENATRAN’s database. It is important to mention that for each one of these years, the pointed license data correspond
to the difference between the registered fleet from
December to December. In order to determine the quantity of vehicles by types of fuel in the case of the following categories: Light Vehicles, Light Flex Vehicles, Light Flex Commercials (for each one of these three categories it has been noticed a
difference among the ones which uses gasoline or
TABLE I
Vehicle fleet by category in the MRPA in 2001 (by unities). The data are originated from DENATRAN, (2015).
Light Vehicles Light Flex
Vehicles Light Commercials
778089 0 80076
Light Flex
Commercials Trucks Motorcycles Bus
ethanol) and Light Commercials (besides the ones who used gasoline or ethanol it has also been taken in consideration the unities which use diesel) it has been used the information from the 2014 Brazilian Auto mobility Industry’s Yearbook by ANFAVEA (http://www.anfavea.com.br). This document provides annual national data of licenses for these categories by type of fuel until 2014, information that were disaggregated for the MRPA. For the categories Trucks and Bus the total number of new licenses utilize diesel as fuel, in case of the motorcycles it is believed that the total number of unities run on gasoline.
For 2015, it was obtained an estimation from information available by FENABRAVE and ABRACICLO, that projected a percentage of sales reduction in Brazil. In order to separate the information from the licenses by type of fuel, it was applied the same percentage used in 2014.
In order to elaborate a projection for the period 2016-2030, it was necessary to analyze several vehicle licenses estimations, and to determine
two types of scenarios of vehicle fleet evolution forthis period, in the first one the new licenses are
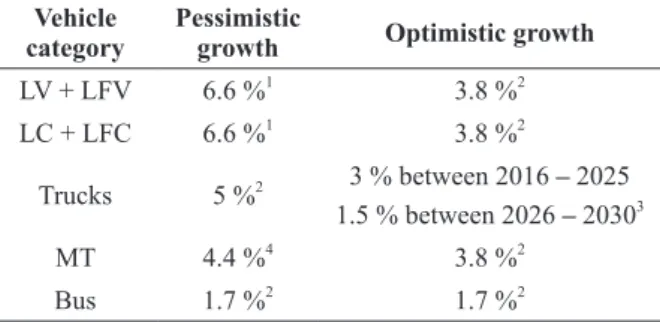
based on an pessimistic estimation (bigger number of licenses) and in the second one they project a optimistic estimation (fewer licenses). In the Table II, it is shown the utilized values for both criterions in percentage of raise in the licenses year in relation to the previous year (2016 – 2030).
To separate by type of fuel for the period between 2016 and 2030, it was applied the same percentage utilized in 2014 in the licenses of this period.
In continuity, it has been obtained the survival rate for each vehicle category and type of fuel, as from the information available by the Ministry of Environment in the First National Inventory’s report (www.mma.gov.br/estruturas/163/_ publicacao/163_publicacao27072011055200.
pdf). It has also been determined the fleet’s age,
by category, in the basis year 2001 as from the information of new licenses available by ANFAVEA
and the motorcycle’s fleet in the state of Rio Grande
do Sul (http:/ www.detran.rs.gov.br).
Lastly, all this information obtained in the previous steps was inserted in the LEAP tool that computed the evolution scenarios of the
fleet since 2002 until 2030 (making it important
to remember that from 2016 it was obtained two types of scenarios for each year, an optimistic and another pessimistic, towards the vehicles licenses). The fundamental equation that the LEAP utilizes to
calculate the total fleet by category and type of fuel
is the following one:
( )
50*
= −=
∑
j n jFj
Vn S t
Where:
Fj - Circulating fleet in the year (j), year when one
wants to determine the scenario.
Vn - New Vehicles License in the years n.
TABLE II
Raise Percentage of the new vehicles licenses by categories between the years 2016 and 2030.
Vehicle category
Pessimistic
growth Optimistic growth
LV + LFV 6.6 %1
3.8 %2
LC + LFC 6.6 %1
3.8 %2
Trucks 5 %2 3 % between 2016 – 2025
1.5 % between 2026 – 20303
MT 4.4 %4
3.8 %2
Bus 1.7 %2
1.7 %2
Data available in:
1
Roland Berger Strategy Consultants (RBSC) (http://www. rolandberger.com).
2
Environmental Ministry in the First National Inventory’s report.
3
“Energy demand (2050)”, Energy Research Company. Published in 2014 (http://www.epe.gov.br/Paginas/default. aspx).
4 “Potential diversification of the Brazilian chemical industry”,
National Development Bank. Published in 2014.
S(t) - Survival Rate of Vehicles with age t.
OBTAINING OF THE POLLUTANTS EMISSION SCENARIOS ASSOCIATED WITH THE VEHICULAR ACTIVITY IN THE MRPA
With the determination of the scenarios of vehicle fleet evolution in the MRPA, it was possible to
obtain the pollutants emission linked to the fleet.
For this, it was utilized the methodology already described previously denominated bottom-up. These vehicular emission scenarios, that were determined for each year in the same period that
the scenarios of the fleet (2002 – 2030, taking as
basis year 2001), consist of values of total annual emission of each one of the three species that are being analyzed (CO, NOx and THC). These values are specified for each one of the seven vehicle
categories that were utilized in the fleet’ scenarios.
It was also possible to derive the information towards the utilized fuel (in this study it has been worked with gasoline, ethanol and diesel), what it means is that, for example, for the total unities
that utilize diesel in a specific year it was possible
to relate the total emission values of each specie mentioned previously.
As the vehicular emission scenarios are
associated with the fleet evolution, it was possible
to determine the vehicular emission scenarios
associated with the optimistic projections and pessimistic ones for the period between 2016 and 2030.
Besides the fleet’s data, it was necessary to recompile or generate information about the emission factors associated with each category by type of fuel and by specie, the same way in use intensity. Once all the data are organized, the emission rates of each one of the three species of study were calculated utilizing the following equation:
( ) ( ) ( ) ( ) ( )
50
, * * * * ,
= −
=
∑
jn j
Ei j EF n j DFEF t UI DFUI t NV n j
Where:
Ei(j) - Total annual emission of the vehicle category
(i), that utilizes a specific type of fuel, in the year
(j). (ton/year).
EF(n,j) – Emission factor linked with the vehicles of
the category and type of fuel (i) that were licensed in the year (n) and circulate in the year (j). (g/km).
DFEF(t) – Degradation factor of the emission
factors for the vehicles in the category and type of fuel (i) with age (t).
UI – Use intensity (annual distance travelled for
vehicles in the category and type of fuel (i)). (km).
DFUI(t) – Degradation factor of the use intensity
for the vehicles in the category and type of fuel (i) with age (t).
NV(n.j) – Total number of vehicles in the category
and type of fuel (i), that were licensed in the year (n) and circulate in the year (j).
The degradation factors presented in the equation that are applied to the factor of emissions and the use intensity represent the aging of the technology as the years go by. For example, an old vehicle that circulates on the current days emits more than it used to, when it was fabricated and licensed, the same happens with the use intensity, usually a newer car runs a further distance that an older one.
In the Table III it is available the information related to the precedence of data utilized in the emission factors and use intensity, this for each one of the seven vehicles categories that were studied:
The extracted emission factors from the “Vehicular Emission Report of the state of São Paulo”, published in 2013, is based chiefly on information from the “Report of Production Emission’s Values” (RPEV) created by the National Environment Council (CONAMA) and sales data. In these reports, the fabricants or the importers inform the emission values of the rehearsal made through samples of the vehicles in production. The rate of sampling vary between 0.1 % to 0.4 %, what implies in about 10 thousand rehearsals made annually.
For the category trucks, the emission factors
are specified by type (light, medium, semi heavy
and heavy). As this study deals with the trucks category as just one, it was utilized the data of new truck licenses by type and year, informed by the ANFAVEA for the percentage calculation that represented each type of truck in the annual
TABLE III
Information of the data provenance utilized of emission factors and use intensity.
Category Fuel Emission factors (EF) Use intensity(UI)
LV Gasoline 1 – s
2 *
Alcohol 1 – s
LFV Gasoline 1 – s
Alcohol 1 – s
LC Gasoline 1 – s
Alcohol 1 – s
Diesel (1990 – 2008) – 2 – s
(From 2008) – 1 – s
2 – s
LFC Gasoline (Until 2006) – 1 **
(From 2006) – 1 – s 2 *
Alcohol (Until 2006) – 1 **
(From 2006) – 1 – s
Trucks Diesel 1 – s 2 – s
Bus Diesel 1 – s 2 – s
MT Gasoline 1 – s 2 – s
(1) Data available in the “Vehicular Emission Report of the State of São Paulo” published in 2013 (http://veicular.cetesb.sp.gov.br/ wp-content/uploads/sites/35/2013/12/relatorio-emissoes-veiculares-2013.pdf).
(2) Data available by the Environmental Ministry in the First National Inventory’s report.
(s) Specific data for the category and type of fuel.
licenses. For the use intensity data of the trucks, it was proceeded by the same way, as the inventory of the Environmental Ministry also proportionate information of this variable for each type of truck.
In the motorcycles category, the emission
factors are specified by cylinder capacity, on this
work it was utilized the pondered information of new licenses for cylinder capacity based on the information available by ABRACICLO (90 % of new licenses for motorcycles with cylinder capacity <150cc and 10 % for motorcycles with cylinder capacity between 150 and 500cc) (http://www. abraciclo.com.br). It was applied the percentage to the emission factors obtaining a unique value for year and specie.
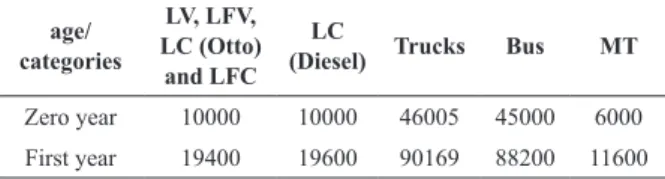
For the period between 2016 and 2030, when
it is not possible to find any emission data yet, it
was assumed values of the last year informed. The Table IV shows the use intensity data, utilized for each vehicle category. Note that for the year zero (manufacturing year) the value is lower, because this is pondered taking into account that not all of the brand new vehicles do entry in service early every year, e.g., those which are licensed in December will have less service time in the year
and this decreases the use intensity final value.
RESULTS AND DISCUSSION
SCENARIOS OF VEHICULAR FLEET EVOLUTION
It was obtained scenarios of quantity of vehicles for each one of the seven categories of studies in the period between 2002 and 2030, having as basis year 2001. It was created the pessimistic scenario (with the biggest quantity of licensing in the period) and the optimistic one (with the least quantity of license in the period). In the Figure 2 it shows the pessimistic and optimistic scenarios graphics with
the raise of the vehicular fleet divided in the seven
categories studied.
In both types of scenarios, a reduction of the
vehicles fleet correspondent to the Light Vehicles
category and a raise, the most important one, in the Light Flex Vehicles, by the change of the technology that began in 2003, has been observed. Regarding the category referring to the Light Commercials, the scenario reproduces a raise of the
fleet, mainly utilizing diesel as its fuel with a lower price in the marketplace – and that proportionate a
bigger potency. The category referring to the Light
Flex Commercials also presents a significant raise.
The Table V shows the scenarios’ results
for the total fleet by category in the MRPA, this
for the years 2015 and 2030, being this last one associated as much to the pessimistic scenario as in the optimistic scenario. In 2030, comparing to 2015, the results show a raise of 70.98 % in the
total fleet for the pessimistic scenario and 44.25
% for the optimistic scenario. The category LFV presented greater raise. Towards the heavy vehicles that run on diesel, it had little variation in the total
fleet, even the results show a reduction in the bus fleet. That decrease is because projected licenses are not enough to offset the vehicle that are out of
circulation.
In comparison with the pessimistic scenario of
the total fleet for 2030 in the MRPA, the optimistic
one is 15.6 % smaller in terms of licensed unities.
POLLUTANTS EMISSION SCENARIOS ASSOCIATED WITH THE VEHICULAR ACTIVITY
Once the scenarios of vehicular fleet evolution in
the MRPA are determined, it was possible to create the emission scenarios of associated pollutants, this for the three species under study (CO, NOx and THC).
TABLE IV
Values of use intensity for all the categories under study,
corresponding to the fabrication year (zero year) and to the first year in circulation (first year).
age/ categories
LV, LFV,
LC (Otto)
and LFC LC
(Diesel) Trucks Bus MT
Zero year 10000 10000 46005 45000 6000
In the Figure 3, graphics with the vehicular emission scenarios of CO for the MRPA are shown. They are associated with the pessimistic estimation,
specified by vehicles categories and by type of fuel
applied. It is possible to be observed that after a substantial raise until 2014 it reveals a gradual reduction that only reverts in 2029, one year later the last estimated inventory.
The reduction of CO emission from the light vehicles is mainly due to the scrapping of the old unities associated with the incorporation of new technologies that favored a smaller emission factor of the new unities. The CO emissions linked with the categories LFV and LFC increased year by year since the entry of the Flex technology in the
marketplace in 2003, making clear that the raise
of the circulating fleet, in this scenario in specific,
dominates the reduction of the emission factors
because of the introduction of new technologies. In the rest of the categories (LC, Trucks, Bus and MT)
the CO emissions reduce in 2030 comparing with 2015 (Table VI).
When it is made an analysis by type of fuel run on (Figure 3b), it is clear that the greater values of
CO emission correspond to those vehicles that run on gasoline.
Comparing the CO emissions scenarios, associated with the pessimistic estimations and the
optimistic ones of the fleet raise respectively, it is Figure 2 - Scenarios of vehicular fleet evolution in the MRPA (period between 2002 and 2030). (a) Pessimistic scenario of the fleet
(bigger quantity of license in the period). (b) Optimistic scenario of the fleet (smaller quantity of licenses in the period).
TABLE V
Total fleet by category for the MRPA according to the scenarios for 2015 and 2030.
Vehicle category Fleet – 2015 (thousand units)
Fleet - 2030 (thousand units)
pessimistic
Fleet - 2030 (thousand units)
optimistic
Light Vehicles 553 179.7 167.3
Light Flex Vehicles 607.5 1816.6 1507.5
Light Commercials 101.5 178.9 144.9
Light Flex Commercials 85.6 282.6 224.8
Trucks 42.5 50.3 44.4
Bus 12.9 12.5 12.5
Motorcycles 197.7 225.8 215.7
observed a difference of 6.55 % of the emission in
2030 between the scenarios (Table VI).
The tendency of NOx emissions, as it can be observed in the Figure 4, is all about reduction. Despite the fast raises in the emissions of this specie linked with the Flex categories, the significant reduction in the categories Trucks and Bus, having
it given chiefly by the new introduced technologies, and light vehicles by less circulating fleet, make the
whole tendency become a reduction. It is important to make it clear that in all the years the unities of the Trucks category, which run on diesel, were responsible for the highest percentage of emissions.
It is observed that the emissions for 2030, associated with the pessimistic estimation of the
fleet, are 9.02 % bigger than the emissions associated with the optimistic estimation of the fleet. In both
scenarios, the values for the emissions obtained in 2030 of the specie NOx are clearly smaller than the emissions in 2015. The total emission in 2030,
linked with the pessimistic estimation of the fleet,
is 50.93 % smaller than the estimation for 2015 (Table VII).
Regarding the THC (Figure 5), the tendency shown is to reduce from 2013 on. It happens something similar with the same occurred with
TABLE VI
Total values of the CO emission, linked with the vehicular activity in the MRPA, according to the pessimistic and
optimistic scenarios of the fleet for the years between 2015 and 2030.
Vehicle category Emission – 2015 (1000 ton/year) year). Optimistic fleet growth.Emission - 2030 (1000 ton/ year). Pessimistic fleet growthEmission - 2030 (1000 ton/
Light Vehicles 112.6 13.3 13.6
Light Flex Vehicles 22.7 101.2 107.9
Light Commercials 12.7 2.7 2.9
Light Flex Commercials 2.8 12.8 14.2
Trucks 2.4 0.9 1.0
Bus 1.5 0.5 0.5
Motorcycles 5.3 1.4 1.4
TOTAL 160.1 132.7 141.4
Figure 3 - Emission scenarios of CO in the MRPA (associated with the pessimistic estimation of the fleet) for the period between
the CO, the linked emissions with the LV category vehicles decreased considerably since 2013 and linked emissions to the vehicles of category LFV increase. The THC emissions of the vehicles of LFC category also increase as time goes by. It is, the vehicles that run on gasoline and the ones that most contribute on the THC emissions according to all the obtained scenarios.
In the Table VIII, it is possible to observe the
little difference that exists among the values for
the emissions of both scenarios in 2030. However, comparing with the emissions from the scenario for 2015, the THC in 2030, according to the scenario
associated with the pessimistic activity of the fleet,
are 33.33 % smaller.
CONCLUSIONS
The analysis of the scenarios of vehicle fleet evolution, for the Metropolitan Region of Porto Alegre until 2030, show the exponential raise of
the total fleet in the region, being the Light Flex
Vehicles the one which most contributes with the
increment. This increment of the fleet, according to
the obtained scenarios, will not cause an addition of the polluting gases emission (CO, NOx and THC), because the technology renovation in the new
Figure 4 - Emission scenarios of NOx in the MRPA (associated with the pessimistic estimation of the fleet) for the period between 2002 and 2030. (a) Scenarios by vehicles categories. (b) Scenarios by type of fuel.
TABLE VII
Total values of emission of the specie NOx, linked with the vehicular activity in the MRPA, according to the pessimistic
and optimistic scenarios of the fleet for the years 2015 and 2030.
Vehicle category Emission – 2015 (1000 ton/year) year). Optimistic fleet growth.Emission - 2030 (1000 ton/ Emission - 2030 (1000 ton/year). Pessimistic fleet growth
Light Vehicles 7.0 0.4 0.4
Light Flex Vehicles 1.3 3.6 4.1
Light Commercials 1.6 0.6 0.7
Light Flex Commercials 0.2 0.8 0.9
Trucks 13.5 6.0 6.7
Bus 8.1 2.8 2.8
Motorcycles 0.2 0.1 0.1
vehicles along with the emissions program control of emissions implemented by the government would perform satisfactorily in the vehicular emission control. It is important to emphasize that the
scenarios are based on the effective implementation
of control and vehicular inspection in the MRPA. As far the pessimistic scenario as the optimistic one of the fleet’s evolution present estimations tending to decrease the emissions until 2030, being NOx what tries the biggest reduction out. Nevertheless, it is important to mention that this tendency may change if the sustainable development program in the transport sector is not
applied effectively. It turns evident in the annual evolution graphics that the fleet raise associated
with a stagnation in the vehicular control
technology and the public politics of the emissions
reduction, may revert the tendency of decreasing as
from 2030.
ACKNOWLEDGMENTS
The first author acknowledges the Brazilian Agency
Coordenação de Aperfeiçoamento de Pessoal
de Nível Superior (CAPES) for the master’s
scholarship.
TABLE VIII
Total emission values of THC, associated with the vehicular activity in the MRPA according to the pessimistic and
optimistic scenarios of the fleet for the years 2015 and 2030.
Vehicle category Emission – 2015 (1000 ton/year) year). Optimistic fleet growth.Emission - 2030 (1000 ton/ year). Pessimistic fleet growthEmission - 2030 (1000 ton/
Light Vehicles 11.3 1.6 1.7
Light Flex Vehicles 2.1 7.0 7.5
Light Commercials 0.8 0.2 0.2
Light Flex Commercials 0.3 0.9 1.0
Trucks 0.7 0.2 0.2
Bus 0.4 0.1 0.1
Motorcycles 0.8 0.3 0.3
TOTAL 16.5 10.3 11.0
Figure 5 - Scenarios of THC emission in the MRPA (associated with the pessimistic estimation of the fleet) for the period between
REFERENCES
ARBEX MA, SANTOS UP, MARTINS LC, SALDIVAR PH, PEREIRA LA AND BRAGA AL. 2012. A poluição do ar e o sistema respiratório. J Bras Pneumol 38(5): 643-655. ATKINSON-PALOMBO C, MILLER JA, BALLING JR AND
ROBERT C. 2006. Quantifying the ozone weekend effect at various locations in Phoenix, Arizona. Atmos Environ 40: 7644-7658.
BERKOWICZ R, WINTHER M AND KETZEL M. 2006. Traffic pollution modeling and emission data. Environ Model Softw 21: 454-460.
HEAPS CG. 2012. Long-range Energy Alternatives Planning (LEAP) system. [Software version 2014.0.1.9] Stockholm Environment Institute. Somerville, MA, USA.
MASCARENHAS MDM, VIEIRA LC, LANZIERI TM, LEAL AP, DUARTE AF AND HATCH DL. 2008. Poluição atmosférica devida a queima de biomassa florestal e atendimentos de emergência por doença respiratória em Rio Branco, Brasil-Setembro, 2005. J Bras Pneumol 34(1): 42-46.
SANTOS UP, TERRA M, LIN C, PEREIRA LA, VIEIRA TC, SALDIVA PHN AND BRAGA ALF. 2008. Cardiac Arrhythmia Emergency Room Visits and Environmental Air Pollution in São Paulo, Brazil. J Epidemiol Community Health 62: 267-272.