Vol.50, n. 3 : pp.489-502 May 2007
ISSN 1516-8913 Printed in Brazil BRAZILIAN ARCHIVES OF
BIOLOGY AND TECHNOLOGY
A N I N T E R N A T I O N A L J O U R N A L
Assessing of Biotic Integrity of the Fish Community in a
Heavily Impacted Segment of a Tropical River in Brazil
Benjamin Carvalho Teixeira Pinto and Francisco Gerson Araújo*
Laboratório de Ecologia de Peixes; Universidade Federal Rural do Rio de Janeiro; Antiga Rodovia Rio-SP Km 47; [email protected]; [email protected]; 23.851-970; Seropédica - RJ - Brasil
ABSTRACT
A index of biotic integrity (IBI) was applied to assess the ecological health at seven sites of ca. 338 km extension of the Paraíba do Sul river, in bracketing a large urban-industrial complex. The aim was to evaluate the index response to changes in environmental quality during two seasons (winter/dry versus. summer/wet). Eight metrics were selected to IBI in three categories: 1) species richness and habitat composition; 2) indicator species; and 3) trophic structure. The IBI, based on the least impacted regional condition, showed the highest value at the most upstream site (Queluz=km 0) - Acceptable, then decreasing downstream and reaching the lowest record at Volta Redonda (km 125) - Impacted; afterwards there was an increasing quality toward the most downstream sites until reaching better scores at Além Paraíba (km 338) - Moderate Impacted/ Acceptable. During the winter/dry seasons a clearer spatial trend was detected when compared with oscillations in summer/wet. The IBI proved to be a suitable tool to evaluate environmental quality in this tropical and very altered large river, since it was sensitive to non-source point pollution changes, which occurred all over the studied area.
Key words: Fish community, IBI, environmental quality, habitats, tropical rivers, biomonitoring
* Author for correspondence
INTRODUCTION
Biotic integrity has been defined as the ability of a system to generate and to maintain the adaptive biotic components through natural evolutionary process. In a lotic system, biotic integrity depends on river flow, energy input, water quality, biotic interaction and habitat structure (Karr et al., 1986, Hughes and Gammon, 1987, Karr, 1991). In this context, the Index of Biotic Integrity - IBI - has been increasingly used to assess the effects of environmental degradation; firstly for streams (Karr, 1981; Karr et al., 1986) and more recently for large rivers (Ganasan and Hughes, 1998; Hughes and Oberdorff, 1998; Waite and Carpenter, 2000; Hughes, 2000; Karr et al., 2000).
The use of IBI in streams is facilitated due to lower habitat complexity and lower water volume, when compared with large rivers (Strahler, 1957; Lotrich, 1973; Vannote et al., 1980; Matthews, 1986). In the medium and large rivers, some difficulties in standardizing fish sampling and to interpret patterns due the higher structural complexity were reported by Oberdorff and Hughes (1992), Hugueny et al. (1996) and Ganasan and Hughes (1998).
results in the Khan and Kshipra rivers in India, with the lowest IBI near to Indore and Dewas cities.
The Paraíba do Sul river drains a major industrialized area in the country and suffers different impacts along its extension, with the heaviest alteration occurring in the medium-lower stretch, due to a major industrial siderurgy plant (Pfeiffer et al., 1986). In this extent, there is generalized pollution from organic and industrial effluents brought into the river by the unplanned Municipalities sewage systems (Carvalho and Torres, 2002), which decrease water quality and impoverished habitats. Sewage, toxic chemicals, and excessive phosphorus cause the main water quality problems, while altered flow regimes, loss of habitats, passage obstructions, and riparian degradation constitute the physical problems. Despite these drawbacks, the water is used to supply the human population in the main area of Rio de Janeiro City and for hydroelectric purposes, with an abstraction been located at approximately 30 km downstream the major industrial plant. The IBI has been reported as an efficient monitoring tool for diffuse pollution, integrating through fish community metrics, the overall state of health of a lotic system in contrast to the traditional physico-chemical parameters, which gives a punctual and instantaneous information on the water quality of a given site (Karr et al 1986; Verdonschot, 2000). While IBI reflects the recent history of a system alteration, dictated by the trend in the various biotic and abiotic components, the physico-chemical parameters pinpoint a precise level of specific pollutants (Karr et al., 1986; Rosenberg and Resh 1993; Verdonschot, 2000). Because of different approaches on assessing a system environmental health, these two methods are complementary and have been used in order to obtain a more holistic assessment on the environmental quality (Hughes and Gammon 1987; Waite and Carpenter, 2000; Meador and Goldstein, 2003).
Seasonal change is a major feature in lotic systems, mounding environmental and biotic characteristics, especially in fish community, as several characteristics shift. To understand such changes they must be included in IBI protocols as an important aspect of environmental monitoring. Seasonal shift in temperature, rainfall, and river flow have a direct effect on fish life cycle (Grossman et al., 1998; Allan, 2004). In Southeast Brazil, rainfall season coincides with increasing
temperatures, which occur in the summer, triggering reproductive migrations of some fish species in a season when microhabitats are enhanced and integrated due to the increased flow and water volume. Species access more habitat and food resources, mainly from alloctonous origin. This work aimed to apply IBI in this heavily alterated segment of the lower medium section of the Paraíba do Sul river to test its suitability to assess environmental condition and to seek for eventual shifts according to the seasons. Were specifically addressed: 1. Did the increased distance from the main non-point source pollution inputs corresponded to better the environmental condition (IBI) indicating a river recover capacity? 2. Did the seasonal variation affect IBI results?
MATERIALS AND METHODS
The Paraíba do Sul river is 1080 km long, with a 57,000 km2 watershed. Its middle reaches flow
400 to 600 m above sea level and drains ancient, predominantly sedimentary, soil covered by tropical forest. This ecoregion is characterized by both un- and semi-consolidated sand, gravel, silt and clay, with basalt outcroppings, low mountains, low nutrient soils, fragmented semi-deciduous seasonal rain forest, and poor croplands (Carvalho and Torres, 2002; Projeto RADAMBRASIL, 1983). The climate is mesothermic with high relative humidity, hot and wet summers and dry winters. Annual rainfall ranges from 1000-3000 mm, with the annual averages generally surpassing 2000 mm (DNAEE, 1983). There is a well characterized precipitation regime where highest rainfall occurs between November and January. These heavy rains occasionally cause large floods of the Paraíba do Sul River. June through August is the driest season of the year (Carvalho and Torres, 2002). Temperature ranges from minimum of 20 - 22 ºC in June during August and maximum of 32 - 34 ºC in December through February, with an annual average of 26 and 28°C. River flow in the studied reach averages 318 m3s-1, ranging from
109 m3s-1 in the dry season to 950 m3s-1 in the wet
season (Hydroscience, 1977). The studied river segment was 338 km long, covering a drainage area of approximately 33,663 km2 within a single
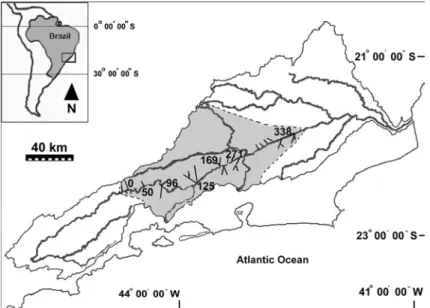
The study reach was chosen because it drained one of the most important industrial regions in Brazil, and included the most polluted section of the river (Pfeiffer et al., 1986), with several textile, chemical and food industries, and a large industrial steel plant at Volta Redonda Municipality. Agriculture and sand mining also were common in the area. Diffuse pesticide and sediment pollution
from agriculture was combined with point source organics and metals from untreated municipal and industrial effluents. Seven sampling sites were chosen near the main municipalities: Queluz, Resende, Barra Mansa, Volta Redonda, Barra do Piraí, Três Rios, and Além Paraíba, and each included a tributary to the mainstream.
Figure 1 - Study area, the Paraíba do Sul watershed (in bold), indicating the seven sampling sites (Km 0, km 50 … km 338).
The seven sites (Fig. 1) were each sampled in two seasons: high flow (summer/wet) and low flow (winter/dry), between March 2001 and April 2002. These two seasons were tested because the hydrologic season explained a great amount of variance in the habitat availability, influencing fish community and the efficacy of fishing techniques in large rivers. Distance between adjacent sites varied between 29 and 102 km. Sites were chosen on the basis of accessibility, similarity in habitat types, and to maximize the diversity of habitat types (pools, riffles, tributaries) at each site. Each site was sampled over a 24-h period, covering an area of approximately 56,000 m2, with
reaches 560-800 m long and 70-100 m wide. Several fishing methods were used in a standardized manner to collect the maximum number of species and individuals in different sizes and microhabitats. Fishing equipment included gill nets, cast nets, seines and sieves. A total of 18 gill nets (25 x 2.5 m, with 2.5-7.5 cm mesh size opposite) were set in the afternoon and removed in the following morning, for a total of
16 h fished per net. Cast nets (3 m diameter and 2-3 cm mesh) were used by two skilled persons for 2 h in water 2-3 m deep. A seine (10 x 3 m with 5 mm mesh) was employed by two persons in shallow areas for 2 h. A sieve (80 cm in diameter with 1 mm mesh) was used in the macrophyte beds by one person for 1 h. Frequently, few individuals were collected at a site visit with any single gear to be adequate alone for evaluating metric and IBI scores. Following Whittier et al. (1997), Ganasan and Hughes (1998) and Bozzetti and Schulz (2004), the fishes caught by the different fishing equipment taken at each site visit into a single value were pooled, thus defining the unit effort. Specimens were deposited at the Laboratory of Fish Ecology, Universidade Federal Rural do Rio de Janeiro.
the raw data was Log10 (x+1) transformed to address the normality and homocedasticity requirements of the parametric analyses. Multivariate clustering was conducted on the species abundance to assess spatial and temporal patterns (Baroche and Saporta, 1982).
To understand the effects of the river degradation on fish community, each candidate was tested metric to IBI to verify if changes in metrics corresponded to IBI changes and if such changes were related to the degradation in the environment. The metrics were chosen in the categories: species richness - habitat composition - indicators species - trophic structure.
Fifteen candidates metrics were tested: 1) number of native species; 2) number of caraciform species (water column); 3) number of siluriform species (benthic); 4) number of individuals excluding omnivorous; 5) total biomass; 6) % introduced individuals; 7) % cyprinodontiform individuals (tolerant species); 8) Number of sensitive species; 9) % carnivorous individuals; 10) % omnivorous individuals; 11) % invertivorous individuals; 12) % phytophagous individuals; 13) % insectivorous individuals; 14) % hybrids and 15) Dominance - number of species to amount to 90% of the total number of individuals in a sample. Eight out of those 15 metric were chosen, some adapted of the original IBI (Karr, 1981) and some adapted for the particular characteristics of the studied area. All the selected metrics, with exception of the number of characiform species, showed significant correlation with IBI and were present in the majority of the sampled sites. The eliminated metrics did not show significant correlation with IBI, or were not common in all the sampled sites, or showed narrow range of variation, or were redundant or their information was not quantitative.
Species richness and habitat composition The number of native species represents biological
diversity, which typically declines with
disturbance. Number of characiform species which tend to decline with increased turbidity or reduced cover. Number of siluriform species which are reduced by sedimentation and insufficient dissolved oxygen (Table 1).
Indicator species
Three metrics were chosen in this category: number of sensitive species, % cyprinodontiform individuals and number of dominant species. The
number of species amounting 90% of the total number of individuals in a sample was used as the dominance metric.
Trophic structure
Two metrics were chosen: % omnivorous and % carnivorous individuals. The dominance of omnivorous occurs as specific components of the food base become less reliable; the opportunistic foraging habits of omnivorous make them more successful than specialized foragers (Karr et al., 1986). Native carnivorous are more sensible to environmental alteration. According to Karr (1981) there is an inverse correlation between the proportion of omnivorous individuals and other specialized habits, with increased number of the former and decreased number of specialized such as invertivorous, phytophagous, insetivorous, with increasing environmental degradation (Karr, 1981). The presence of native carnivorous is an indication of a health lotic environment (Karr, 1981; 1999) since those fish depend on a complex trophic structure. In a decreased water quality system, the native carnivorous species tend to decrease or even disappear.
Calculations of the IBI metrics
impacted) were determined based on the sum of the scores.
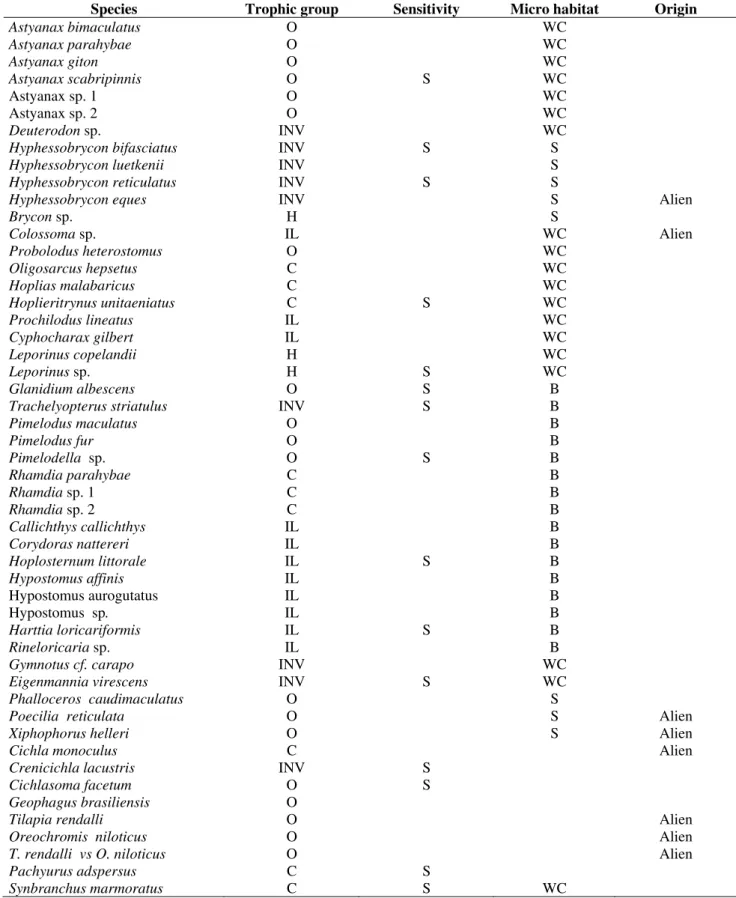
Table 1 - Species listed according to Lauder and Liem (1983). Trophic group: omnivorous (O), invertivorous (INV),
herbivorous (H), iliophagous (IL), carnivorous (C). Sensitivity: Sensitive species (S). Microhabitat: water column (WC), surface (S), benthic (B).
Species Trophic group Sensitivity Micro habitat Origin
Astyanax bimaculatus O WC
Astyanax parahybae O WC
Astyanax giton O WC
Astyanax scabripinnis O S WC
Astyanaxsp. 1 O WC
Astyanaxsp. 2 O WC
Deuterodon sp. INV WC
Hyphessobrycon bifasciatus INV S S Hyphessobrycon luetkenii INV S Hyphessobrycon reticulatus INV S S
Hyphessobrycon eques INV S Alien
Brycon sp. H S
Colossoma sp. IL WC Alien
Probolodus heterostomus O WC
Oligosarcus hepsetus C WC
Hoplias malabaricus C WC
Hoplieritrynus unitaeniatus C S WC
Prochilodus lineatus IL WC
Cyphocharax gilbert IL WC
Leporinus copelandii H WC
Leporinus sp. H S WC
Glanidium albescens O S B
Trachelyopterus striatulus INV S B
Pimelodus maculatus O B
Pimelodus fur O B
Pimelodella sp. O S B
Rhamdia parahybae C B
Rhamdia sp. 1 C B
Rhamdia sp. 2 C B
Callichthys callichthys IL B
Corydoras nattereri IL B
Hoplosternum littorale IL S B
Hypostomus affinis IL B
Hypostomus aurogutatus IL B
Hypostomus sp. IL B
Harttia loricariformis IL S B
Rineloricaria sp. IL B
Gymnotus cf. carapo INV WC
Eigenmannia virescens INV S WC Phalloceros caudimaculatus O S
Poecilia reticulata O S Alien
Xiphophorus helleri O S Alien
Cichla monoculus C Alien
Crenicichla lacustris INV S Cichlasoma facetum O S Geophagus brasiliensis O
Tilapia rendalli O Alien
Oreochromis niloticus O Alien
T. rendalli vs O. niloticus O Alien
Pachyurus adspersus C S
RESULTS
Fish assemblages
A total of 13,064 fishes were collected, amounting to 279,172 grams, 51 species and 15 families (Table 1). Characiform (41.18%) and Siluriform (31.37%) predominated, with Characidae being the most diverse family with 29.41% of the total number of species, followed by Cichlidae (13.73%). A total of 12.76% species were non-native, and were introduced in the system. Two species were from Cichlidae family (genus
Oreochromis and Tilapia) and four species from
other South American basins (C. monoculus, H.
eques, X. helleri e Colossoma sp.) (Table 1). The
most abundant species were P. reticulata, with 61.41% of the total number of fishes, T. rendalli (5.96%) and G. brasiliensis (4.59%). The major
biomass contribution was from H. affinis
(14.39%), followed by G. brasiliensis (13.43%)
and H. aurogutatus (12.22%). Twelve out of the
51 recorded species comprised 90% of the total individuals captured and 16 accounted for 90% of the total biomass (Table 2).
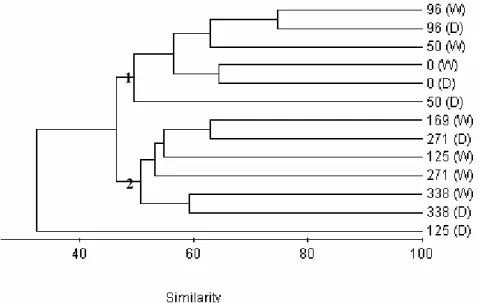
No significant spatial difference was detected for species abundance, richness and biomass by ANOVA, in both wet and dry seasons; only the number of species showed highly significant differences between the two seasons, being higher in wet season when compared with dry. The cluster analysis (Fig. 2) showed three groups of sites; one group (Group 1) was comprised by the sites upstream the industrial plant of Volta Redonda and the other (Group 2) by the sites downstream Volta Redonda; a was comprised by one site only (km 125 at dry season). The most abundant species in group 1 were: P. reticulata, G. brasiliensis and T. rendalli; in group 2: T. rendalli, P. caudimaculatus and G. brasiliensis; and in site km 125 (dry): P. reticulata, Rineloricaria sp. and Tilapia hybrid. The site km 125 in the dry season showed the highest number of individuals (7,841), being higher than group 2 (2,819) and group 1 (2,404).
ANOVA showed that the biomass was similar among groups 1 (122,140g) and 2 (120,464g). The site km 125 in dry season showed the lowest biomass. Species richness was higher in group 1 with 45 species, followed by group 2 with 43, according to ANOVA. The site km 125 in dry season showed the lowest number of species (19). The Tukey test indicated that group 1 showed significantly higher abundance than group 2 for P.
maculatus and P. heterostomus, while A. giton, P.
caudimaculatus, Deuterodon sp., T. striatulus and P. fur showed significantly higher abundance for the group 2.
The sites upstream the major industrial plant of Volta Redonda in group 1 and the sites downstream the Volta Redonda industrial plant (km 169 to 338), including Volta Redonda in wet season (km 125 W) in group 2; The Volta Redonda site in the dry season (km 125 D) was isolated in a left-upper part of the diagram. No seasonal difference was found between the groups for the number of individuals, biomass, or any individual species.
IBI and metric variation
Since no overall significant spatial difference was found for the fish species among the sites, no adaptation was applied to IBI metrics and scores. The best and worst attributes with the continuous IBI are shown in Table 3.
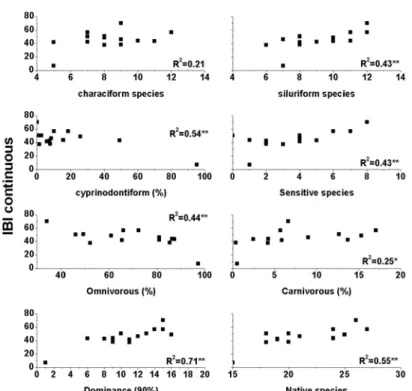
Six out of the eight selected metrics showed highly significant correlation with IBI scores (n=14; R2>0.38): number of native species, number of
siluriform species, % cyprinodontiform
individuals, % omnivorous individuals, number of sensitive species and dominance. Percentage of carnivorous individuals showed significant correlation with IBI (R2=0.25) and the number of
characiform species showed no significant correlation (R2=0.21) (Fig. 3); exceptionally this
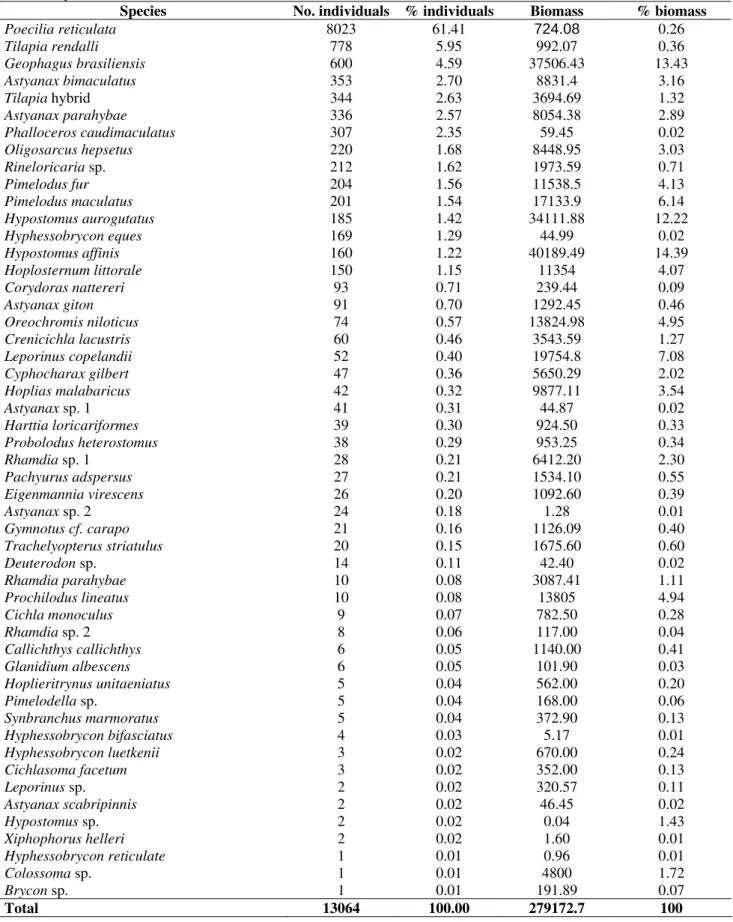
Table 2 - Relative abundance (and percentage) in number and biomass of fish species in the Paraíba do Sul river,
2001/2002.pecies No. individuals % individuals
Species No. individuals % individuals Biomass % biomass
Poecilia reticulata 8023 61.41 724.08 0.26 Tilapia rendalli 778 5.95 992.07 0.36 Geophagus brasiliensis 600 4.59 37506.43 13.43 Astyanax bimaculatus 353 2.70 8831.4 3.16 Tilapia hybrid 344 2.63 3694.69 1.32 Astyanax parahybae 336 2.57 8054.38 2.89 Phalloceros caudimaculatus 307 2.35 59.45 0.02 Oligosarcus hepsetus 220 1.68 8448.95 3.03 Rineloricaria sp. 212 1.62 1973.59 0.71
Pimelodus fur 204 1.56 11538.5 4.13
Pimelodus maculatus 201 1.54 17133.9 6.14 Hypostomus aurogutatus 185 1.42 34111.88 12.22 Hyphessobrycon eques 169 1.29 44.99 0.02 Hypostomus affinis 160 1.22 40189.49 14.39 Hoplosternum littorale 150 1.15 11354 4.07 Corydoras nattereri 93 0.71 239.44 0.09
Astyanax giton 91 0.70 1292.45 0.46
Oreochromis niloticus 74 0.57 13824.98 4.95 Crenicichla lacustris 60 0.46 3543.59 1.27 Leporinus copelandii 52 0.40 19754.8 7.08 Cyphocharax gilbert 47 0.36 5650.29 2.02 Hoplias malabaricus 42 0.32 9877.11 3.54
Astyanax sp. 1 41 0.31 44.87 0.02
Harttia loricariformes 39 0.30 924.50 0.33 Probolodus heterostomus 38 0.29 953.25 0.34 Rhamdia sp. 1 28 0.21 6412.20 2.30 Pachyurus adspersus 27 0.21 1534.10 0.55 Eigenmannia virescens 26 0.20 1092.60 0.39
Astyanax sp. 2 24 0.18 1.28 0.01
Gymnotus cf. carapo 21 0.16 1126.09 0.40 Trachelyopterus striatulus 20 0.15 1675.60 0.60
Deuterodon sp. 14 0.11 42.40 0.02
Rhamdia parahybae 10 0.08 3087.41 1.11 Prochilodus lineatus 10 0.08 13805 4.94
Cichla monoculus 9 0.07 782.50 0.28
Rhamdia sp. 2 8 0.06 117.00 0.04
Callichthys callichthys 6 0.05 1140.00 0.41 Glanidium albescens 6 0.05 101.90 0.03 Hoplieritrynus unitaeniatus 5 0.04 562.00 0.20
Pimelodella sp. 5 0.04 168.00 0.06
Synbranchus marmoratus 5 0.04 372.90 0.13 Hyphessobrycon bifasciatus 4 0.03 5.17 0.01 Hyphessobrycon luetkenii 3 0.02 670.00 0.24 Cichlasoma facetum 3 0.02 352.00 0.13
Leporinus sp. 2 0.02 320.57 0.11
Astyanax scabripinnis 2 0.02 46.45 0.02
Hypostomus sp. 2 0.02 0.04 1.43
Xiphophorus helleri 2 0.02 1.60 0.01 Hyphessobrycon reticulate 1 0.01 0.96 0.01
Colossoma sp. 1 0.01 4800 1.72
Brycon sp. 1 0.01 191.89 0.07
Figure 2 - Clustering on fish assemblages: Group 1: sites upstream the major industrial plant of
Volta Redonda (km 0 to 125); Group 2: sites downstream Volta Redonda (km 125 to 338); and site km 125 in dry season (isolated branch). D=dry/W=wet.
Table 3 - Criteria for scoring the continuos index of biological integrity (IBI).
Metrics Best Worst
Number of native species 27 15
Number of characiform species 12 5
Number of siluriform species 12 6
Number of sensitive species 8 0
% Cyprinodontiform individuals 0 95
Number of dominant species 16 1
% Omnivorous individuals 34 97
% Carnivorous individuals 20 0
The following candidates metrics were not selected to IBI: number of individuals, number of non-native species, number of hybrids, percent of
invertivorous individuals, percent of
phytophagous, percent of insetivorous individuals and total biomass). All these metrics did not accomplish the assumption as cited above (significant relationship with IBI) or were not common in all the sampled sites, or showed narrow range of variation, or were redundant with other more significant metrics. The IBI for the dry season showed higher oscillations when compared with the wet season (Fig. 4), with the latter showing overall higher values.
The continuous IBI scores ranged from a minimum of zero (0) to a maximum of eighty (80). IBI higher than 60 were considered acceptable, 40-60 moderately impacted, and lower than 40 impacted.
In the wet season a higher quality (Acceptable) was showed for the km 0 and moderately impacted at the remaining sites, but oscillations between sites did not allow to draw any spatial trend. In the dry season, the environmental quality indicated by IBI was moderately impacted at the two most upstream sites (km 0 and 50) and at the two most downstream sites (km 271 and 338), and impacted at the remaining sites, with the lowest value at km 125.
1
Figure 3 - Diagram of dispersion between IBI and the 8 selected metrics.
Figure 4 - Scores for the continuous Index of Biotic Integrity for the lower-medium reaches of the
Paraíba do Sul river. Full line (dry season), dashed line (wet season). Queluz - km 0; Resende - km 50; Barra Mansa - km 96; Volta Redonda - km 125; Barra do Piraí - km 169; Três Rios - km 271; Além Paraíba - km 338.
DISCUSSION
The fish assemblage comprised by 51 species was similar to other previous works in the area which
reaches of the Paraíba do Sul river. This number was well below the 122 species proposed by Britski (1994) for large rivers of East Brazilian coast, such as the case of Paraíba do Sul, but such estimation includes the streams and small tributaries. Teixeira et al. (2005) recorded 81 fish species for the whole main channel of the Paraíba do Sul river and its main tributaries. Furthermore, the 338 km segment of the river studied in this work was approximately one third of the whole Paraíba do Sul extension, and no tributaries were included.
The highest fish abundance in the km 125 for the dry season was due to the high contribution of P. reticulata, a non-native and opportunist species common in alterated environments. High abundance of opportunist species in alterated environments have been widely reported in the current literature (Ganasan and Hughes, 1998; Soto-Galera et al., 1998). Ganasan and Hughes (1998) found that the highest abundant species in sites of the Khan river near to Indore City, a major degraded area, were comprised by three tolerant species: Lebistes reticulatus, Channa punctatus
and Heteropneustus fossilis. High occurrences of
this species were associated to perturbations indicated by chemical variables and poor habitat structure. Differences in species composition along the studied reach could be due to poor water quality since the physical river structure did not change much along the studied reach, which was situated within a single ecoregion (Omernik, 1987).
The eight selected metrics proved to be satisfactory for the development of IBI (Table 3). The number of species was restricted to native species in order to avoid the provable negative effect of eight non-native species. Hughes and Oberdorff (1998) reported that the use of native species was important, mainly where non-native species were relatively common. The number of native species was used by Lyons et al. (1995) who pointed that native species decreased with degradation, while non-native species were more prone to increase in homogeny habitats and degradable environments. The number of characiform species (water column species) and the number of siluriform species (benthic species) were chosen as indicators of the habitat composition. Al though the number of characiform species did not show significant correlation with IBI, it was retained since these water column species were sensible to suspended solids, very
common in Paraíba do Sul watershed. The poor soil cover causes erosion processes and degradation of riparian vegetation. Water column species are active diurnal swimmers with a varied feeding habitat, being sensible to high concentration of suspended matter and habitat degradations. The siluriforms species are those more closely associated to the bottom, which becomes more silty and homogenous with increased sedimentation. Bozzetti and Schulz (2004) used benthic species, emphasizing that dominance by air-breathing species is considered a strong indicator of oxygen depletion. Benthic species are sensible to turbidity, low oxygen concentrations and toxic substances deposited in sediment, since they use this compartment to feed and spawn. Margin erosion also provokes impairment to benthic species through the substrate homonization.
Opportunist species occupy the few available niches and tolerate low water quality where sensible species could not copy. Such species increase in number with chemical and physical degradation, and are the least to leave with degradation and the first to re-appear with recovering. The dominance metric was considered as the number of species to amount to 90% of the total number of individuals in a standardized sample. Roth et al. (2000) used that metric in streams in Maryland as the numerical contribution of the most abundant species in the sample. The dominance of a few number of species indicate low equitability instability and few pathways to energy flow in the system.
Trophic structure is another important category in assessing the biotic integrity using the feeding habits. Omnivorous are found in high abundance at the polluted sites, since these fish species use a wide range of food, both plants and animals, and detritus or organic matter. On the other hand, carnivorous is a very specialized group and indicate a diverse trophic web to support this top pyramid species (Karr, 1981). Such species could also accumulate higher concentrations of toxic substances through bio-magnification process via food web. These species are quickly affected by the physico-chemical alteration in water quality. Fishes of wide trophic plasticity can modify food habit in alterated systems and this is an important factor in tropical areas, where several species are omnivorous or tend to detritivorous. Carnivorous may change habit to omnivorous, making difficult to define trophic structure in such alterated environment. In this way only two metrics were selected on trophic structure (% carnivorous and % omnivorous). The % carnivorous individuals’ metric was used by Karr (1981) and Karr et al. (1986) as top carnivorous, and was used in several works such as Oberdorff and Hughes (1992), Hugueny et al. (1996), Hocutt et al. (1994) and Ganasan and Hughes (1998). The presence of carnivorous is an indication of good state of river health (Karr, 1981; 1999), since they depend on a well structured trophic web. The % of omnivorous’s individuals was proposed by Karr (1981) to assess the degree of food availability in alterated systems, since theses species used a wide variety of food both animal and plant origin. This metric has been used by several workers in IBI adaptations. Hocutt et al. (1994) replaced the omnivorous by saprophytic opportunists, while Harris (1995) used only the microphages
omnivorous. The total number of individuals was discharged because it did not differed significantly among the 14 samples, or presented correlation with IBI. Despite no spatial difference in the total number of individuals between sites, some particular species showed inter-sites differences in abundance. P. reticulata, T. rendalli, G.
brasiliensis and P. caudimaculatus showed the
highest numerical abundance in the most altered site (km 125). The high contribution of such species was incorporated in IBI metric as % omnivorous’s individuals.
Introduced species and hybrids did not present significant correlation with IBI (R2<0.24) being
rare in the samples and occurring only in km 125. A decreasing environmental quality from km 0 (Queluz) to the lowest score at km 125 and an increasing trend toward the most downstream sites suggested the river recovery. Low IBI scores in very impacted sites due to organic and industrial pollution was reported by Hughes and Gammon (1987) for the Willamette river, Oregon, with lowest values associated to sites near to metropolitan areas of Portland and Newberg. Ganasan and Hughes (1998), studying the Khan and Kshipra rivers in Índia found similar results with the lowest IBI near to Indore and Dewas cities. Araújo et al. (2003) applying IBI in a narrow reach of the Paraíba do Sul river (c.a. 80 km), discriminated three rivers zones: zone I, upstream the industrial plant of Volta Redonda; zone II nearby the siderurgy plant, and zone III, downstream the plant. In this study the lowest values occurred at zone II. In the present study, this trend of lowest IBI values near to cities was confirmed, which received a high load of organic and industrial pollutants, such as km 50 and km 125 (location the cities of Resende and Volta Redonda, respectively). Furthermore, the middle-lower reaches of the Paraíba do Sul show in the most upstream and most downstream sites higher
habitat diversity and relatively lesser
anthropogenic influence, in contrast to most urbanize area near to Resende and Volta Redonda cities.
IBI was comparatively lower, due to most exposed areas, decreasing habitat condition and increasing effects of organic and industrial pollutants due to lower water flow. It was likely that the effluent in dry season had a more marked influence in the fish assemblages, decreasing IBI values. The highest environmental quality indicated by IBI occurred at km 0 and km 338, where there was more habitat diversity, types of substrates, best riparian cover and lesser land use by urban areas. Overall, shifts in environmental quality corresponded to changes in IBI values strongly associated with human activities.
Additionally, the sampling program could also have influenced the results, with better performance of the fish equipments during the dry season, thus resulting in a more clearly spatial IBI variation along the studied stretch of the river. During the wet season, the higher water volume and flow, and the riparian cover made some fishing equipment more difficult to operate, and some species could be missed to capture. The extremely high number of P. reticulata (more than 7,455 individuals) recorded in km 125 site during the dry season contributed to isolate this sample in just one branch of the cluster analysis. It was decided to keep it in the database because it reflected a seasonal situation in a very polluted site, where this species tended to occur in high densities. It, therefore, was concluded that the IBI should be used preferably during the dry season rather than in the wet season. In temperate streams and river, the autumn is the more appropriated season, since there is lesser influence of the reproductive process in the fish assemblages and the flow is at the lowest levels.
The findings of this work showed the IBI as a robust, quick and cheap tool to assess environmental quality in alterated tropical rivers. The different fish equipments contributed to collect a wider range of the fish community in more diverse habitats, making IBI more reliable, an option for large rivers, where the effect of electrofishing could be limited (Hugueny et al., 1996; Ganasan and Hughes, 1998). The present refinement of IBI for the initial proposition of Araújo (1998) and further development by Araújo et al. (2003) was achieved for the whole medium-lower reaches of the river. Other aspects of the relationship between IBI and aspects of landscape would be important to validate IBI. Pinto et al. (2006) evaluated the relationship between fish assemblage structure by using IBI with landscape
use and riparian condition. They found that landscape use and riparian condition were correlated and IBI was positively correlated with pasture, tributary area, and riparian condition, but negatively correlated with urban area. Further adaptation of this index would be required for the remaining extent of this large river (upper and lower reaches) since those areas are located in different ecoregions, a concept that need to be discussed in more details for the Brazilian systems.
RESUMO
O Índice de Integridade Biótica (IBI) foi aplicado em sete locais do rio Paraíba do Sul, cobrindo uma extensão de 338 km, e incorporando um trecho de grande densidade industrial. O objetivo foi avaliar a resposta do índice às mudanças na qualidade ambiental durante dois períodos (inverno/seco versus verão/úmido). O IBI foi determinado através de oito métricas compreendidas em três categorias da comunidade de peixes: 1) riqueza de espécies e composição de habitats; 2) espécies indicadoras; e 3) estrutura trófica. Utilizou-se a condição menos impactada da região como abordagem para a comparação dos locais, com os mais altos valores ocorrendo nos locais mais a montante (Queluz=km 0) - Aceitável, diminuindo mais abaixo e atingindo os piores valores em Volta Redonda (km 125) - Impactado; uma subseqüente melhoria ocorreu nos locais mais a jusante, atingindo melhores valores em Além
Paraíba (km 338) - Moderadamente
Impactado/Aceitável. Durante o período
inverno/seco foi detectado uma clara tendência espacial quando comparado com as oscilações registradas no verão/úmido. O IBI provou ser uma ferramenta adequada para avaliar a qualidade ambiental nos grandes rios tropicais que se encontram em elevado estágio de alteração, já que se mostrou sensível às variações na poluição difusa que ocorre ao longo de toda área estudada.
ACKNOWLEDGEMENTS
Gracia. We thank Dr. Robert Hughes for technical consultancy. CAPES (Brazilian Agency for Personal Training and Education) provided financial support, and the many graduate and undergraduate students who helped the in field work.
REFERENCES
Allan, J. D. (2004), Landscapes and Riverscapes: The influence of Land Use on Stream Ecosystems. The Annual Review of Ecology, and Systematics, 35,
257-284.
Angermeier, P. L. and Karr, J. R. (1986), Applying an index of biotic integrity based on stream-fish communities: considerations in sampling and interpretation. North American Journal of Fisheries Management, 6, 418 - 429.
Araújo, F. G. (1998), Adaptação do índice de integridade biótica usando a comunidade de peixes para o rio Paraíba do Sul. Revista Brasileira Biologia,
58, 547-558.
Araújo, F. G. (1996), Composição e estrutura da comunidade de peixes do médio e baixo rio Paraíba do Sul, RJ. Revista Brasileira de Biologia, 56,
111-126.
Araújo, F. G.; Fichberg, I.; Pinto B. C. T. and Peixoto, M. G. (2001), Variações espaciais na assembléia de peixes no Rio Paraíba do Sul (Barra Mansa, Barra do Piraí), Rio de Janeiro, Brasil. Revista Brasileira de Zoologia, 18, 483-492.
Araujo, F. G.; Fichberg, I.; Pinto, B. C. T. and Peixoto M. G. (2003), A preliminary index of biotic integrity for monitoring condition of the Rio Paraíba do Sul, Southeast Brazil. Environmental Management, 32,
516-526.
Baroche, J. M. and Saporta, G. (1982), Análise de dados. Zahar. Rio de Janeiro.
Bozzetti M. and Schulz U. H. (2004), An index of biotic integrity based on fish assemblages for subtropical streams in southern Brazil. Hydrobiologia, 529, 133-144.
Britski H. A. (1994), A Fauna de Peixes Brasileiros de Água Doce e o Represamento de Rios. In: COMASE/ELETROBRÁS, Seminário sobre fauna aquática e o setor elétrico brasileiro. Caderno 1- Fundamentos, Rio de Janeiro: Eletrobrás. p. 23-30. Carvalho, C. E. V. and Torres, J. P. M. (2002), The
ecohydrology of the Paraíba do Sul river, Southeast Brazil. In McClain, M. E. (ed), The cohydrology of South American Rivers and Wetlands. The IAHS Series of Special Publications, Venice, Italy: 179-191.
DNAEE (Departamento Nacional de Águas e Energia Elétrica). (1983), Boletim Fluviométrico F-5.02, Bacia do rio Paraíba do Sul, Brasília, Distrito Federal.
Ganasan, V. and Hughes, R. M. (1998), Application of an index of biological integrity (IBI) to fish assemblages of the rivers Klan and Kshipra (Madhya Pradesh), India, Freshwater Biology, 40, 367-383.
Grossman, G. D.; Ratajczak, R. E.; Crawford, M. and Freeman, M. C. (1998), Assemblage organization in stream fishes: effects of environmental variation and interspecific interactions. Ecology, 68, 395-420.
Harris, J. H. (1995), The use of fish in ecological assessment. Australian Journal of Ecology, 20,
65-80.
Hocutt, C. H.; Johnson, P.N.; Hay, C. and Van Zyl, B. J. (1994), Biological basis of water quality assessment: the Kavango River, Namibia, Regue Hidrobiologique Tropicale,27, 361-384.
Hughes, R. M. and Gammon, J. R. (1987), Longitudinal changes in fish assemblages and water quality in the Willamette River, Oregon, Transactions of the American Fisheries Society, 116, 196-209.
Hughes, R. M. and Oberdorff, T. (1998), Applications of IBI Concepts and Metrics to Waters Outside the United States and Canada. In: SIMON, T. P. (ed.). Assessing the Sustainability and Biological Integrity of Water Resources Using Fish Communities, CRC Press, Boca Raton: Florida. pp. 79-93
Hughes, R. M.; Paulsen, S. G. and Stoddard, I. (2000), EMAP- Surface Waters: a national, multiassemblage, probability survey of ecological integrity in the U.S.A. Hydrobiologia, 422/423, 429-443.
Hugueny, B.; Camara, S.; Samoura, B. and Magassouba, M. (1996), Applying an index of biotic integrity based on fish assemblages in a West African river. Hydrobiologia, 331, 71-78.
Hydroscience Inc. (1977), The Paraíba do Sul River Water Quality Study. Technical Report 6, BRA-73/003. Toms River, New Jersey.
Karr, J. R. (1981), Assessment of biotic integrity using fish communities. Fisheries, 6, 21-27.
Karr, J. R. (1991), Biological integrity: a long neglected aspect of water resource management. Ecological Appications, 1, 66-84.
Karr, J. R.; Fausch, K. D.; Angermeier, P. L.; Yant, P. R. and Schlosser, I. J. (1986), Assessing biological integrity in running waters: a method and its rationale. Illinois Natural History Survey Special Publication, 5, 1-28.
Karr, J. R. (1999), Defining and measuring river health. Freshwater Biology, 41, 221-234.
Karr, J. R.; Allan, D.; Benke, A. C. (2000), River conservation in the United States and Canada: Science, Policy, and Practice. In: P. J. Boon, B. R. Davis and G. E. Petts, (eds.). Perspectives on River Conservation: Science, Policy, and Practice. John Wiley. Chichester: Global. 35 pp.
Lauder, G. V.; Liem, K. F. (1983), The evolution and interrelatioships of the Actinopterygian fishes. Bulletin of the Museum of Comparative Zoology. 150,
Lotrich, V. A. (1973), Growth, production, and community composition of fishes inhabiting a first-, second-, and third-order stream of eastern Kentucky. Ecological Monographs, 43, 377-397.
Lyons, J.; Navarro-Perez, S.; Cochran, P. A.; Santana C. E. and Guzman-Arroyo, M. (1995), Index of biotic integrity based on fish assemblages for the conservatin of streams and rivers in west-central Mexico. Conservation Biology, 9, 569-584.
Matthews, W. J. (1986), Fish faunal ‘breaks’ and stream order in the eastern and central United States. Environmental Biology of Fishes, 17, 81-92.
Meador, M. R. and Goldstein, R. M. (2003), Assessing water quality at large geographic scales: relations among land use, water physicochemistry, riparian condition, and fish community structure. Environmental Management, 31, 504-517.
Oberdorff, T. and Hughes, R. M. (1992), Modification of an Index of Biotic Integrity based on fish assemblages to characterize rivers of the Seine Basin, France. Hydrobiologia, 228, 117-130.
Omernik, J.J. (1987), Ecoregions of the conterminous United States, Annals of the Association of American Geographers, 77, 118 - 125.
Pfeiffer, W. C.; Fiszman, M.; Malm, O. and Azcue, J. M. (1986), Monitoring Heavy Metals pollution by the critical pathway analysis in the Paraiba do Sul river. The Science of Total Environment, 58, 73-79.
Pinto, B. C. T.; Araújo, F. G. and Hughes, R. M. (2006), Effects of landscape and riparian condition on a fish index of biotic integrity in a large southeastern Brazil river. Hydrobiologia, 556, 69-83.
Projeto RADAMBRASIL (1983) Folhas SF.23/24 Rio de Janeiro/Vitória; Geologia, Geomorfologia, Pedologia, Vegetação e Uso Potencial da Terra. RADAMBRASIL, Rio de Janeiro.
Roth, N. E.; Southerland, M. T.; Chaillou, J. C.; Kazyak, P. F. and Stranko, S. A. (2000), Refinement and Validation of a Fish Index of Biotic Integrity for Maryland Streams. Chesapeake Bay and Watershed Programs Monitoring and Non-Tidal Assessment CBWP-MANTA-EA-00. Maryland.
Rosenberg, D. M. And Resh V. H. (eds) (1993), Freshwater Biomonitoring and Benthic Macroinvertebrates. Chapman and Hall, New York, NY.
Soto-Galera, E.; Díaz-Pardo, E.; López-López, E. and Lyons, J. (1998), Fish as indicators of environmental quality in the Río Lerma Basin, México. Aquatic Ecosystem Health and Management, 1, 267-276.
Strahler, A. N. (1957), Quantitative analysis of watershed geomorphology. Transactions of the American Geophysical Union, 38, 913-920.
Teixeira, T. P.; Pinto, B. C. T.; Terra, B. F.; Estiliano, E. O.; Gracia, D. and Araújo, F. G. (2005), Diversidade das assembléias de peixes nas quatro unidades geográficas do rio Paraíba do Sul. Iheringia, Ser. Zool., 95, 347-357.
Vannote, R. L.; Minshall, G. W.; Cummins, K. W.; Sedell, J. R. and Cushing, C. E. (1980), The river continuum concept. Canadian Journal of Fisheries and Aquatic Sciences, 37, 130-137.
Verdonschot, P. F. M. (2000), Integrated ecological assessment methods as a basin for sustainable catchment management. Hydrobiologia, 422/423, 389-412.
Waite, I. R. and Carpenter, K. D. (2000), Associations among Fish Assemblage Structure and Environmental Variables in Willamette Basin Streams, Oregon. Transactions of the American Fisheries Society, 129,
754-770.
Whittier, T. R.; Halliwell, D. B. and Paulsen, S. G. (1997), Cyprinid distributions in northeast U.S.A. lakes: evidence of regional-scale minnow biodiversity losses. Canadian Journal of Fisheries and Aquatic Sciences, 54, 1593-1607.