Soil macrofauna in a Cerrado/Caatinga ecotone under different crops in Southwestern Piauí State, Brazil.
Ciência Rural, v.47, n.10, 2017.
1
Soil macrofauna in a Cerrado/Caatinga ecotone under different
crops in Southwestern Piauí State, Brazil
Caracterização da macrofauna edáfica em ecótono Cerrado/Caatinga
sob diferentes cultivos no Sudoeste piauiense Djavan Pinheiro Santos1 Thiago Rodrigo Schossler2 Isis Lima dos Santos3 Nathália Batista Melo4 Glenio Guimarães Santos4
ISSNe 1678-4596 Ciência Rural, Santa Maria, v.47: 10, e20160937, 2017
Received 10.14.16 Approved 06.28.17 Returned by the author 08.25.17 CR-2016-0937.R2
http://dx.doi.org/10.1590/0103-8478cr20160937
INTRODUCTION
Southwestern Piauí State, considered the last agricultural frontier in Brazil, has been included in the agroeconomic scenario of the country due to the growing demand for food production and
to the state’s agricultural potential. However, the replacement of native vegetation by grain-production systems in the Cerrado of Piauí promotes changes in the structure of the soil macroinvertebrate community relative to the natural Cerrado condition (SANTOS et al., 2016).
1Programa de Pós-graduação em Agronomia: Solo e Água (PPGA), Escola de Agronomia, Universidade Federal de Goiás (UFG), Campus
Samambaia, Rod. Goiânia-Nova Veneza, Km 0, 74690-900, Goiânia, GO, Brasil. E-mail: djavansantos@hotmail.com.br. Corresponding author.
2Programa de Pós-graduação em Agronomia (Ciência do Solo), Universidade Federal Rural de Pernambuco (UFRPE), Recife, PE, Brasil. 3Faculdade de Agronomia e Medicina Veterinária, Universidade de Brasília (UnB), Brasília, DF, Brasil.
4Escola de Agronomia, Universidade Federal de Goiás (UFG), Goiânia, GO, Brasil.
ABSTRACT: The aim of this study was to characterize the soil macrofauna under different crop systems and compare them to the macrofauna under the native vegetation of a Cerrado/Caatinga ecotone in southwestern Piauí State, Brazil. The areas studied included areas under sweetsop cultivation (Annona squamosa L.), andropogon grass with three years of use, andropogon grass with six years of use, pivot-irrigated corn, Napier grass, and native vegetation. In each area, soil layers of 0-0.1, 0.1-0.2, and 0.2-0.3m, including the surface litter, were evaluated following the Tropical Soil Biology and Fertility Program (TSBF) recommendations. The soil macrofauna from the different land-use
systems were identified to the family level, and the mean density of each taxon was calculated for each soil-management type and layer. The
structure of the soil macrofauna was negatively altered under the different crops in comparison to the native Cerrado/Caatinga vegetation, with macrofaunal occurrence varying in the different soil layers. A correlation existed between the functional groups and the soil grain-size distribution and moisture. Napier grass cultivation favored greater soil macrofaunal abundance, with a predominance of families belonging to the orders Isoptera and Hymenoptera. Number of soil macrofaunal families under pivot-irrigated corn was more like the number observed with the native vegetation, and corn also had greater family diversity compared to the other crops studied. Therefore, pivot-irrigated corn can reduce the impact of anthropogenic land use on the diversity of soil macrofauna.
Key words: bioindicators, Napier grass, irrigated crop, soil invertebrates, soil quality.
RESUMO: Objetivou-se caracterizar a macrofauna edáfica sob diferentes cultivos comparando-os a vegetação nativa de ecótono Cerrado/
Caatinga no Sudoeste do Piauí. As áreas estudadas foram: área sob cultivo de ata (Annona squamosa L.); capim andropogon com três anos de
cultivo; capim andropogon com seis anos de cultivo; milho irrigado sob pivô; capim napier e vegetação nativa. Em cada área foram avaliadas as camadas de 0-0,1, 0,1-0,2 e 0,2-0,3m, inclusive a serapilheira de superfície, segundo recomendações do Tropical Soil Biology and Fertility Program (TSBF). A macrofauna edáfica nos diferentes sistemas de uso do solo foi identificada até o nível de famílias e a densidade média de cada táxon foi calculada para cada tipo de manejo do solo e camada. A estrutura da macrofauna edáfica foi alterada negativamente nos diferentes cultivos quando comparadas com a vegetação nativa de cerrado/caatinga, variando quanto a sua ocorrência nas diversas camadas de solo. Houve correlação entre os grupos funcionais com a distribuição granulométrica e umidade do solo. O cultivo de capim napier favoreceu maior abundância da macrofauna edáfica, porém com predominância das famílias pertencente às ordens Isoptera e Hymenoptera. O milho irrigado sob pivô apresenta número de famílias da macrofauna edáfica mais semelhante à vegetação nativa e maior diversidade de famílias em relação aos demais cultivos estudados, reduzindo o impacto do uso antrópico sobre a biodiversidade da macrofauna edáfica. Palavras-chave: bioindicadores, capim napier, cultivo irrigado, invertebrados do solo, qualidade do solo.
Soil macrofauna has been used as a bioindicator of soil quality, as it plays important roles in the proper soil functioning, regardless of the cultivation system. These organisms are soil invertebrates with body size greater than 2mm
(SWIFT et al., 1979), and they can be influenced by
the quantity and quality of the plant material input into the soil (CARRILLO et al., 2011).
In Piauí, few studies have been conducted on the soil macrofauna relative to land use and management. Some studies note that different land-use and management systems negatively affect these organisms; these systems include areas of agroforestry (LIMA et al., 2010), areas of pasture with epigean fauna in the litter (NUNES et al., 2012; LUZ et al., 2013), sugarcane (ABREU et al., 2014), and grain-production systems in the Cerrado (SANTOS et al., 2016).
However, one of the main obstacles to sustainable agricultural development in the region is the lack of research related to soil-quality bioindicators, especially the degree of sensitivity of different soil macrofaunal taxa to the intensity of land use. Therefore, studies that evaluate agricultural production alternatives to soybean monoculture in the region and their effects on soil bioindicators are important because they may identify conservation soil-management alternatives. Thus, the aim of this study was to characterize the soil macrofauna present under different crops and compare them to the macrofauna under a native Cerrado/Caatinga vegetation ecotone in Southwestern Piauí.
MATERIALS AND METHODS
The study was conducted in the experimental area of the Professora Cinobelina Elvas Campus of the Universidade Federal do Piauí, in the
municipality of Bom Jesus, Piauí (PI) (09°04′48′′ S, 49°19′35′′ W, 290m altitude). The climate of the region is classified as warm and semi-humid, type Aw, according to the Köppen classification, with a
mean annual temperature of 30ºC and precipitation of 1,024mm (INMET, 2015).
The soil of the experimental area is
classified as Latossolo Amarelo Distrófico típico with
a loamy clayey texture according to the EMBRAPA (2013) criteria, exhibiting the following soil particle size distribution: 402.5g kg-1 clay, 87.5g kg-1 silt, and
510.0g kg-1 sand, with smooth undulating relief and
native tropical deciduous Cerrado/Caatinga ecotone vegetation. Soil moisture and depths during data collection in the investigated areas varied between
7.2 and 17.4%. The chemical soil analysis was performed according to the recommendations of the Manual of Soil Analysis Methods (EMBRAPA, 2011), and the results for the soil under the different crops are shown in table 1.
Soil samples were collected from December 2011 to January 2012, following the recommendations of the Tropical Soil Biology and Fertility Program (TSBF) described by ANDERSON & INGRAM (1993). Soil monoliths were collected in trenches (0.25m x 0.25m) in the 0-0.1, 0.1-0.2, and 0.2-0.3m layers. Surface litter was also collected using a metal quadrat, which was randomly placed in
each area, with five samplings per area (replications).
Soil monoliths were collected from areas of cultivation of sweetsop (Annona squamosa L.) (SOP), andropogon grass (Andropogon gayanus
K.) with three years of use (AG3), andropogon grass with six years of use (AG6), pivot-irrigated corn (Zea mays J.) (PIC), Napier grass (Pennisetum
purpureum S.) (NAP), and native Cerrado/Caatinga
ecotone vegetation (NV). The histories of the areas are described in table 2.
After being manual sorted, a procedure performed in the open, the collected invertebrates were stored in containers with 70% ethanol. Subsequently,
the invertebrates were counted and identified to the family level. The identification of the taxa was based
on the research of RUPPERT & BARNES (1996) and BORROR et al. (1989), following didactic material available at <http://www.termitologia.unb.br/>
for the identification of Isoptera and <http://www. insetologia.com.br/> for the identification of the
other orders. Next, the absolute abundance of each group was expressed as relative density (number of individuals per square meter), calculated from the mean of the replications per area.
Vertical distribution for each area was
calculated from the means of the five replicates per
area in each layer. The density data were subjected to the Shapiro-Wilk test, and even after square root of (x + 1) transformation, the distribution remained non-normal. As an alternative, the Kruskal-Wallis test was used, followed by the two-sided Dunn’s test, for which the assumption is that the data set does not follow a normal distribution. The means of the ordinations and the differentiation among the different crops are shown in table 3. The standard error of the mean is presented as a measure of data dispersion.
To evaluate the family diversity of each area, the Shannon (H) and Simpson (Is) indexes were used. Shannon index was calculated using the
Ciência Rural, v.47, n.10, 2017.
3
ni/N, ni = the density of each group, and N = the total number of groups. Simpson index was calculated
using the equation (Is = 1-L), where L = Σni (n-1)/
N(N-1), ni = the number of individuals in group “i”, and N = the sum of the densities of all groups.
For the application of principal components
analysis (PCA), the Bartlett sphericity test was first
performed (P<0.05) to test the relations among the variables. Then, the relations between the soil macrofauna functional groups and the centroids of the
confidence ellipses for each area were tested using the
statistical program XLSTAT® 2016 (ADDINSOFT,
2016), a plug-in of Microsoft Excel 2010.
RESULTS AND DISCUSSION
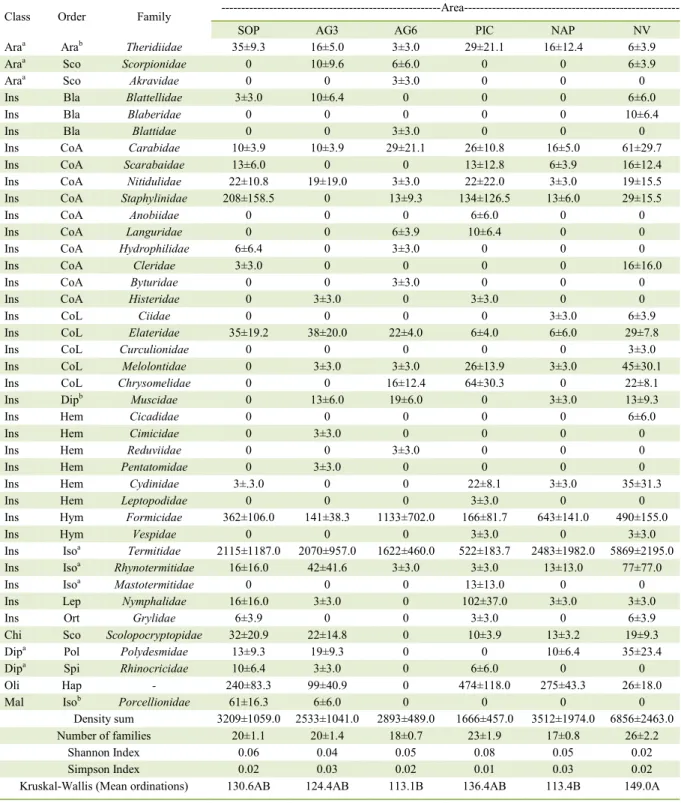
Total relative density of the sampled and
quantified soil macrofauna in the six areas was 20,669
ind. m-2, distributed among six classes, 16 orders, and
40 families (Table 3). The most abundant groups, in descending order of relative density were Isoptera (71.85%), Hymenoptera (14.24%), Haplotaxida Table 1 - Soil chemical analysis of areas under cultivation for sweetsop (SOP), andropogon grass with three years of use (AG3), andropogon
grass with six years of use (AG6), pivot-irrigated corn (PIC), Napier grass (NAP), and native Cerrado/Caatinga ecotone vegetation (NV) in Southwestern Piauí State, Brazil.
Area ---Soil chemical attributes
a
---pH P Zn K Ca Mg CEC Al3+ H+Al3+ m V OM
CaCl2 ---mg dm-3--- ---cmolc dm-3---
---%---SOP 4.8 4.6 1.4 0.3 1.6 0.6 4.9 0.0 2.5 1.3 47.6 1.8
AG3 4.2 4.9 0.7 0.1 0.8 0.3 4.4 0.4 3.1 30.3 28.9 1.8
AG6 5.6 2.9 0.5 0.1 2.3 0.3 4.5 0.0 1.8 1.9 58.8 1.2
PIC 4.7 62.8 3.1 0.1 1.8 0.4 4.2 0.2 2.0 14.2 50.2 1.4
NAP 4.8 5.2 1.8 0.1 2.4 0.5 5.1 0.1 2.2 2.6 56.7 1.6
NV 4.1 3.2 0.5 0.1 0.2 0.1 3.9 0.5 3.4 51.6 13.7 1.0
a
Mean values of the chemical attributes for the 0 to 0.3m soil depth layer in each sampled area. pH: hydrogen potential; P: phosphorus; Zn: zinc; K: potassium; Ca: calcium: Mg: magnesium; CEC: cation exchange capacity; Al3+: aluminum; H + Al3+: hydrogen + aluminum; m:
aluminum saturation; V: base saturation; and OM: soil organic matter.
Table 2 - History of areas under cultivation for sweetsop (SOP), andropogon grass with three years of use (AG3), andropogon grass with six years of use (AG6), pivot-irrigated corn (PIC), and Napier grass (NAP) in Southwestern Piauí State, Brazil.
Area Description
SOP Started in 2006 and managed under conventional tillage for the cultivation of sweetsop (Annona squamosa L.). Area with five years of use under cultivation.
AG3 Started in 2008 and managed under conventional tillage for the cultivation of andropogon grass (Andropogon gayanus K.), grazed with goats. Area with three years of use under pasture.
AG6 Started in 2005 and managed under conventional tillage for the cultivation of andropogon grass (Andropogon gayanus K.), grazed with goats. Area with six years of use under pasture.
PIC Started in 2007 and managed under conventional tillage for the cultivation of pivot-irrigated cowpea (Vigna unguiculata L.). In the 2008/2009 agricultural year, conventional tillage and pivot-irrigated corn. In the 2009/2010 agricultural year, conventional tillage and pivot-irrigated cowpea. In the 2010/2011 agricultural year, conventional tillage and pivot-irrigated corn. Area with four
years of intensive cultivation.
NAP Started in 2005 and managed under conventional tillage for irrigated corn (Zea mays L.) cultivation. In the 2006/2007 agricultural year, conventional tillage and irrigated tomato cultivation. In 2007-2009, cultivation of Napier grass (Pennisetum purpureum S.)
Ciência Rural, v.47, n.10, 2017.
Table 3 - Relative density (individuals per m2)c, family richness, diversity indexes, and Kruskal-Wallis test for soil macrofauna under
different crops in areas of Cerrado/Caatinga ecotone, Southwestern Piauí State, Brazil.
Class Order Family ---Area---
SOP AG3 AG6 PIC NAP NV
Araa Arab Theridiidae 35±9.3 16±5.0 3±3.0 29±21.1 16±12.4 6±3.9
Araa Sco Scorpionidae 0 10±9.6 6±6.0 0 0 6±3.9
Araa Sco Akravidae 0 0 3±3.0 0 0 0
Ins Bla Blattellidae 3±3.0 10±6.4 0 0 0 6±6.0
Ins Bla Blaberidae 0 0 0 0 0 10±6.4
Ins Bla Blattidae 0 0 3±3.0 0 0 0
Ins CoA Carabidae 10±3.9 10±3.9 29±21.1 26±10.8 16±5.0 61±29.7
Ins CoA Scarabaidae 13±6.0 0 0 13±12.8 6±3.9 16±12.4
Ins CoA Nitidulidae 22±10.8 19±19.0 3±3.0 22±22.0 3±3.0 19±15.5
Ins CoA Staphylinidae 208±158.5 0 13±9.3 134±126.5 13±6.0 29±15.5
Ins CoA Anobiidae 0 0 0 6±6.0 0 0
Ins CoA Languridae 0 0 6±3.9 10±6.4 0 0
Ins CoA Hydrophilidae 6±6.4 0 3±3.0 0 0 0
Ins CoA Cleridae 3±3.0 0 0 0 0 16±16.0
Ins CoA Byturidae 0 0 3±3.0 0 0 0
Ins CoA Histeridae 0 3±3.0 0 3±3.0 0 0
Ins CoL Ciidae 0 0 0 0 3±3.0 6±3.9
Ins CoL Elateridae 35±19.2 38±20.0 22±4.0 6±4.0 6±6.0 29±7.8
Ins CoL Curculionidae 0 0 0 0 0 3±3.0
Ins CoL Melolontidae 0 3±3.0 3±3.0 26±13.9 3±3.0 45±30.1
Ins CoL Chrysomelidae 0 0 16±12.4 64±30.3 0 22±8.1
Ins Dipb Muscidae 0 13±6.0 19±6.0 0 3±3.0 13±9.3
Ins Hem Cicadidae 0 0 0 0 0 6±6.0
Ins Hem Cimicidae 0 3±3.0 0 0 0 0
Ins Hem Reduviidae 0 0 3±3.0 0 0 0
Ins Hem Pentatomidae 0 3±3.0 0 0 0 0
Ins Hem Cydinidae 3±.3.0 0 0 22±8.1 3±3.0 35±31.3
Ins Hem Leptopodidae 0 0 0 3±3.0 0 0
Ins Hym Formicidae 362±106.0 141±38.3 1133±702.0 166±81.7 643±141.0 490±155.0
Ins Hym Vespidae 0 0 0 3±3.0 0 3±3.0
Ins Isoa Termitidae 2115±1187.0 2070±957.0 1622±460.0 522±183.7 2483±1982.0 5869±2195.0
Ins Isoa Rhynotermitidae 16±16.0 42±41.6 3±3.0 3±3.0 13±13.0 77±77.0
Ins Isoa Mastotermitidae 0 0 0 13±13.0 0 0
Ins Lep Nymphalidae 16±16.0 3±3.0 0 102±37.0 3±3.0 3±3.0
Ins Ort Grylidae 6±3.9 0 0 3±3.0 0 6±3.9
Chi Sco Scolopocryptopidae 32±20.9 22±14.8 0 10±3.9 13±3.2 19±9.3
Dipa Pol Polydesmidae 13±9.3 19±9.3 0 0 10±6.4 35±23.4
Dipa Spi Rhinocricidae 10±6.4 3±3.0 0 6±6.0 0 0
Oli Hap - 240±83.3 99±40.9 0 474±118.0 275±43.3 26±18.0
Mal Isob Porcellionidae 61±16.3 6±6.0 0 0 0 0
Density sum 3209±1059.0 2533±1041.0 2893±489.0 1666±457.0 3512±1974.0 6856±2463.0 Number of families 20±1.1 20±1.4 18±0.7 23±1.9 17±0.8 26±2.2
Shannon Index 0.06 0.04 0.05 0.08 0.05 0.02
Simpson Index 0.02 0.03 0.02 0.01 0.03 0.02
Kruskal-Wallis (Mean ordinations) 130.6AB 124.4AB 113.1B 136.4AB 113.4B 149.0A
Araa: Arachnida; Ins: Insecta; Chi: Chilopoda; Dipa: Diplopoda; Oli: Oligochaeta; Mal: Malacostra; Arab: Araneae; Sco: Scorpiones; Bla:
Blattodea; CoA: Coleoptera adult; CoL: Coleoptera larva; Dipb: Diptera; Hem: Hemiptera; Hym: Hymenoptera; Isoa: Isoptera; Lep:
Lepidoptera; Ort: Orthoptera; Sco: Scolopendromorpha; Pol: Polydesmidae; Spi: Spirobolida; Hap: Haplotaxida; and Isob: Isopoda.
Cultivation of sweetsop (SOP), andropogon grass with three years of use (AG3), andropogon grass with six years of use (AG6), pivot-irrigated corn (PIC), Napier grass (NAP), and native Cerrado/Caatinga ecotone vegetation (NV). cCalculated for each area from the mean of
Ciência Rural, v.47, n.10, 2017.
5
(5.39%), Coleoptera adults and larvae (5.20%), and other taxa (3.32%). The total relative density reorted in this study was higher than found in other studies, for example, PORTILHO et al. (2011) and SANTOS et al. (2016) in the Cerrado biome and LUZ et al. (2013) and ABREU et al. (2014) in the Caatinga biome.
The relative density under the different crops was lower than under NV, and in most areas, the orders Isoptera and Hymenoptera predominated, except in the area under PIC, where Isoptera and Haplotaxida (earthworms) predominated. Based on
the classification into functional groups proposed
by BROWN et al. (2015), the dominant functional groups were the geophages/bioturbators, considered ecosystem engineers. The higher relative density under NV is due to the predominance of termites, belonging to the family Termitidae (Isoptera), of approximately 85.60% relative to the occurrence of other families in this area. Thus, because all cultivated areas were under conventional soil cultivation, plowing and soil exposure are the main factors reducing the relative density of termites.
Among all orders, Isoptera (termites)
represented 71.84% of the soil macrofauna quantified
in the six evaluated areas. This result is similar to those obtained by SANTOS et al. (2016) in the Cerrado and by LIMA et al. (2010) in the Caatinga of Piauí. The organisms of this taxon create biogenic structures in the soil where they live, providing resources to other soil organisms (LAVELLE, 1996). Among the Isoptera, the family Termitidae, very common in tropical environments, was the one that predominated in all the cultivated areas and in NV. The highest abundance of this family in the cultivated areas was observed in NAP, which showed an abundance closest to that under NV.
The order Coleoptera (adults and larvae) exhibited the highest family diversity under PIC and NV (10 families each). According to CORREIA & OLIVEIRA (2005), some members of these families may act as agricultural pests. For example, Diloboderus abderus (larva) of the family Melolonthidae attacks mainly roots. Another important coleopteran family is
Curculionidae, represented by the cotton boll weevil
(Anthonomus grandis). However, most families are
beneficial to the soil, as they build galleries that favor water infiltration and organic matter incorporation
into the soil.
In the area under PIC, relative to all other coleopteran families, Staphylinidae predominated, with higher relative density in the adult form,
and Chrysomelidae, in larval form, representing
43.23% and 20.65%, respectively. The occurrence
of Staphylinidae may be related to soils containing
high concentrations of potassium, phosphorus, and organic matter (DUNXIÃO et al., 1999) and, because staphylinids function as predators in the environment, to soils undergoing pest control. In turn, the family Chrysomelidae may respond to soil stress (PAOLETTI et al., 1991), participating directly in plant and animal decomposition.
In areas where coleopterans occurred, the family Cleridae, in adult form, and Ciidae,
Curculionidae, and Melolonthidae, in larval forms,
presented lower relative densities in all cultivation systems when compared to NV, possibly because they are more sensitive to anthropogenic disturbances and the intensive land use in these environments.
The family Formicidae (Hymenoptera), abundant in areas of Cerrado and Caatinga, exhibited higher relative density in AG6 compared to the other areas, including NV. The continuous use of goats in this soil for six consecutive years may have caused soil degradation, as the dominance of Formicidae in this area is likely indicative of anthropogenic damage. Similar to the Isoptera, these organisms are important for soil functioning, as the decomposition of plant and animal matter may be related to the presence of these taxa, which participate in the equilibrium of agricultural ecosystems (BRUYN, 1999).
Despite the dominance of those groups considered ecosystem engineers in the study areas, oligochaetes were absent in AG6 and showed low abundance in the other evaluated areas. These individuals respond negatively, with a reduction in their abundance in several environments because low soil-moisture levels, high temperatures, and anthropogenic land use limit their population (BARETTA et al., 2007).
Evaluation of the vertical distribution of soil organisms (Figures 1A, 1B, 1C, 1D, 1E, 1F) revealed a variation in the colonization of these organisms in the different soil layers. The areas under cultivation of SOP, PIC, and NV exhibited a higher proportion of organisms in the 0-0.1m depth layer.
Higher proportions of soil fauna in the superficial
layers may be associated with greater food diversity of soil organic matter (CARRILLO et al., 2011) and prey for predatory organisms in addition to the greater availability of oxygen in this soil layer.
Under NAP (Figure 1E), the 0.2-0.3m layer had the highest colonization of organisms compared to the other layers evaluated. This result may be related to the better distribution of the fasciculate
root system along the soil profile as well as to the
Figure 1 - Relative density of soil macrofauna under cultivation for sweetsop (SOP) (A), andropogon grass with three years of use (AG3) (B), andropogon grass with six years of use (AG6) (C), pivot-irrigated corn (PIC) (D), Napier grass (NAP) (E), and native Cerrado/Caatinga ecotone vegetation (NV) (F).
conditions for the colonization of these individuals (LAVELLE, 1996).
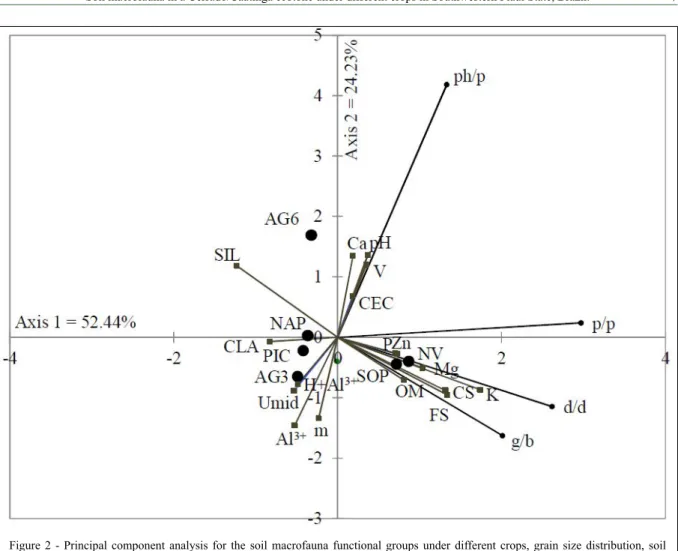
The relations among the soil macrofauna functional groups in the cultivation areas, soil particle size distribution, and soil chemical attributes were analyzed using PCA. The PCA revealed that 52.44% of the data variability was explained by axis 1 and 24.23% by axis 2, accounting for 76.67% of the variability in the data (Figure 2). Axis 1 was
mainly influenced by the predator/parasite (0.92
factor loading), detritivore/decomposer (0.81), and geophage/bioturbator (0.62) functional groups, with positive eigenvectors.
Ciência Rural, v.47, n.10, 2017.
7
Figure 2 - Principal component analysis for the soil macrofauna functional groups under different crops, grain size distribution, soil moisture, and fertility as explanatory variables. Cultivation of sweetsop (SOP), andropogon grass with three years of use (AG3), andropogon grass with six years of use (AG6), pivot-irrigated corn (PIC), Napier grass (NAP), and native Cerrado/Caatinga
ecotone vegetation (NV). CLA: clay; SIL: silt; FN: fine sand; CS: coarse sand. g/b: geophage/bioturbator; d/d: detritivore/
decomposer; ph/p: phytophagous/pest; p/p: predator/parasite. pH (hydrogen potential), P (phosphorus), K (potassium), Ca (calcium), Mg (magnesium), CEC (cation exchange capacity), Al3+ (aluminum), H+Al3+ (hydrogen + aluminum), m (aluminum
saturation), V (base saturation), OM (organic matter), and Zn (zinc).
The plotting of the soil grain-size distribution, soil moisture, and soil chemical attributes in the ordination diagram as explanatory variables to test their relation with the functional groups indicated an association between the detritivore/decomposer
and the geophage/bioturbator groups with the fine
sand and coarse sand fractions. At the same time, these functional groups correlated negatively with the silt fraction. Moreover, the phytophage/pest functional group correlated negatively with soil moisture and may not be directly dependent on this variable for survival because, according to BROWN et al. (2015), these groups survive mainly on living plant parts.
When testing the possible correlations between the soil macrofauna functional groups and the soil chemical attributes, the results of the PCA
revealed that these attributes were not sufficient
to explain the variations in the soil macrofaunal functional groups; although, some trends toward groupings between potassium and the detritivore/ decomposer and potassium and predator/parasite functional groups were observed. However, the quality of the samples for these variables was
classified as mediocre to unacceptable, respectively
(KAISER, 1974).
conditions due to the food abundance resulting from the cowpea/corn succession associated with better soil moisture levels. Finally, the Shannon and Simpson diversity indexes demonstrated that PIC was the cultivated area with the highest soil macrofaunal family
diversity identified in this study. Therefore, the PIC in
this study was the crop that exhibited greater diversity in the number of families, a result similar to that of NV.
CONCLUSION
The structure of the soil macrofaunal community is negatively altered by the different crops in comparison to the natural Cerrado/Caatinga ecotone condition.
The cultivation of Napier grass favors greater soil macrofaunal abundance, with a predominance of families belonging to the orders Isoptera and Hymenoptera.
The number of soil macrofaunal families under pivot-irrigated corn was the number most similar to that of native vegetation, and this crop also had greater family diversity compared to the other crops studied. Therefore, cultivation of pivot-irrigated corn reduces the impact of anthropogenic land use on the biodiversity of the soil macrofauna.
ACKNOWLEDGEMENTS
To Coordenação de Aperfeiçoamento de Pessoal de Nível Superior (CAPES)/Fundação de Amparo à Pesquisa do Estado do Piauí (FAPEPI), for granting a felloship for the master’s degree and to Universidade Federal do Piauí, for the support and encouragement of research.
REFERENCES
ABREU, R.R.L. et al. Fauna edáfica sob diferentes níveis de palhada em cultivo de cana-de-açúcar. Pesquisa Agropecuária Tropical, v.44, p.409-416, 2014. Available from: <http://www. scielo.br/pdf/pat/v44n4/v44n4a02.pdf>. Accessed: Sept. 10, 2016. doi: 10.1590/S1983-40632014000400002.
ADDINSOFT. Xlstat version 2016.4. Software e guia do usuário. New York: 2016. 104 p.
ANDERSON, J.M.; INGRAM, J.S.I. Tropical soil biology and fertility: a handbook of methods. 2.ed. Wallingford: CAB International, 1993. 171p.
BARETTA, D. et al. Earthworm populations sampled using collection methods in Atlantic Forests with Araucaria angustifolia. Scientia Agricola, v.64, p.384-392, 2007. Available from: <http:// dx.doi.org/10.1590/S0103-90162007000400009>. Accessed: Feb. 04, 2017. doi: 10.1590/S0103-90162007000400009.
BORROR, D.J. et al. An introduction to the study of insects. New York: Saunders College Publishing, 1989. 875p.
BROWN, G.G. et al. Biodiversidade da fauna do solo e sua contribuição para os serviços ambientais. In: PARRON, L.M. et al. Serviços ambientais em sistemas agrícolas e florestais do bioma Mata Atlântica. Brasília: Embrapa, 2015. Cap.15, p.121-154.
BRUYN, L.A.L. Ants as bioindicators of soil function in rural environments. Agriculture, Ecosystems & Environment, v.74, p.425-441, 1999. Available from: <http://www.sciencedirect.com/ science/article/pii/S016788099900047X>. Accessed: Sept. 10, 2016. doi: 10.1016/S0167-8809(99)00047-X.
CARRILLO, Y. et al. Soil fauna alter the effects of litter composition on nitrogen mineral soil. Soil Biology and Biochemistry, v.43, p.1440-1449, 2011. Available from: <http://www.sciencedirect. com/science/article/pii/S0038071711001246>. Accessed: Sept. 10, 2016. doi: 10.1016/j.soilbio.2011.03.011.
CORREIA, M.E.F.; OLIVEIRA, L.C.M. de. Importância da fauna de solo para a ciclagem de nutrientes. In: AQUINO, A.M. de; ASSIS, R.L. de (Eds.). Processos biológicos no sistema solo‑planta: ferramentas para uma agricultura sustentável. Brasília: Embrapa Informação Tecnológica; Seropédica: Embrapa Agrobiologia, 2005. p.77‑99.
DUNXIÃO, H. et al. Relationship between soil arthropods and soil properties in a Suburb of Qianjiang City, Hubei, China. Critical Rewiews in Plant Sciences, v.18, p.467-473, 1999.
EMBRAPA (EMPRESA BRASILEIRA DE PESQUISA AGROPECUÁRIA). Manual de métodos de análise de solo. 2.ed. Rio de Janeiro: Embrapa Solos, 2011. 230p.
EMBRAPA (EMPRESA BRASILEIRA DE PESQUISA AGROPECUÁRIA). Sistema brasileiro de classificação de solos. 3.ed. Brasília: Informação Tecnológica, 2013. 353p.
INMET (INSTITUTO NACIONAL DE METEOROLOGIA). Available from: <http://www.inmet.gov.br>. Accessed: May 10, 2015.
KAISER, H.F. An index of factorial simplicity. Psychometrika, v.39, p.31-36, 1974. Available from: <http://dx.doi.org/10.1007/ BF02291575>. Accessed: Feb. 04, 2017. doi: 10.1007/ BF02291575.
LAVELLE, P. Diversity of soil fauna and ecocystem function. Biology International, v. 33, p.3-16, 1996. Available from: <http://citeseerx.ist.psu.edu/viewdoc/download?doi=10.1.1.491.2 284&rep=rep1&type=pdf>. Accessed: Sept. 10, 2016.
LIMA, S.S. et al. Relationship between edaphic macrofauna and soil chemical attributes in different agroecosystems. Pesquisa Agropecuária Brasileira, v.45, p.322-331, 2010. Available from: <http://www.scielo.br/pdf/pab/v45n3/v45n3a13.pdf>. Accessed: Sept. 10, 2016.
LUZ, R.A. et al. Diversity of the Arthropod edaphic fauna in preserved and managed with pasture areas in Teresina-Piauí-Brazil. Brazilian Journal of Biology, v.73, p.483-489, 2013. Available from: <http://www.scielo.br/pdf/bjb/v73n3/1519-6984-bjb-73-03-483.pdf>. Accessed: Sept. 10, 2016. doi: 10.1590/ S1519-69842013000300004.
Ciência Rural, v.47, n.10, 2017.
9
from: <http://www.ccarevista.ufc.br/seer/index.php/ccarevista/ article/view/1309>. Accessed: Sept. 10, 2016. doi: 10.1590/ S1806-66902012000100004.
PAOLETTI, M.G. et al. Invertebrates as bioindicators of soil use. Agriculture, Ecosystems and Environment, v.34, p.341-362, 1991. Available from: <http://www.sciencedirect.com/science/ article/pii/016788099190120M>. Accessed: Sept. 10, 2016. doi: 10.1016/0167-8809(91)90120-M.
PORTILHO, I.I.R. et al. Invertebrate fauna and physical and chemical attributes of soil under integrated crop-livestock systems. Pesquisa Agropecuária Brasileira, v.46, p.1310-1320, 2011. Available from:
<http://www.scielo.br/scielo.php?script=sci_arttext&pid=S0100-204X2011001000027>. Accessed: Sept. 10, 2016. doi: 10.1590/ S0100-204X2011001000027.
RUPPERT, E.E.; BARNES, R.D. Zoologia dos invertebrados. São Paulo: Roca, 1996. 1074p.
SANTOS, D.P. et al. Characterization of soil macrofauna in grain production systems in the Southeastern State of Piauí, Brazil. Pesquisa Agropecuária Brasileira, v.51, p.1466-1475, 2016. Available from: <https://seer.sct.embrapa.br/index.php/pab/issue/current>. Accessed: Oct. 11, 2016. doi: 10.1590/S0100-204X2016000900045.
SWIFT, M.J. et al. Decomposition in terrestrial ecosystems. Studies