LIMA, R. F. et al.
574
MORPHOLOGICAL RESPONSE OF THE RUMINAL AND OMASAL
MUCOSAE TO THE VARIATION IN DIET ENERGY
Resposta morfológica das mucosas do rúmen e omaso à variação da energia na dieta
Ronaldo Francisco Lima1, João Chrysostomo Resende Júnior2, Suely Fátima Costa2,
João Luiz Pratti Daniel3, Tiago Silva Teófilo2, Milton Ghedini Cardoso2
ABSTRACT
The absorption capacity of the rumen responds positively to direct and indirect stimulation by VFA; there is also evidence that the wall of the omasum also responds to these stimuli. To further investigate these reports, we compared the tissue morphologies of
rumen and omasum biopsy samples. Four cows surgically fitted with ruminal cannulas were sequentially fed two diets. These diets included corn silage (S) and a combination of corn silage and commercial concentrate (CS). The animals were fed S for the first 18 days of the experiment, followed by CS for the next 18 days. They were then fasted for 72 h (F), and then had at least 18 days of
re-feeding. Biopsy samples were taken from the blade of the omasum and the ventral sac of the rumen at different time points during
each diet: samples were taken from S-diet animals at day 18; CS, at days 4 and 18; F, at the end of the 72 h; and re-fed animals, at days 4, 12, and 18. The mitotic index of the basal layers of the ruminal and omasal epithelia and the VFA concentration in the rumen were higher after 4 days of CS diet. There was a positive correlation between the mitotic indices of the rumen and omasum. The width of the ruminal papillae varied with different diets, and was highest on day 18 of the CS diet. Our results indicate that
stimulation of cell division due to increased dietary energy simultaneously affected both compartments of the stomach.
Index terms: Acidosis; morphology; physiology; transition diet.
RESUMO
A capacidade de absorção do rúmen responde, positivamente, a estímulos diretos e indiretos dos AGV e existem evidências
de que a parede do omaso também responde a esses estímulos. Sendo assim, comparamos a morfologia do rúmen e omaso obtidos por biopsia. Quatro vacas, implantadas com uma cânula ruminal, foram alimentadas, sequencialmente, com duas dietas. Uma dieta consistia de silagem de milho (S), sendo a outra composta de silagem de milho e concentrado comercial (CS). Os animais foram alimentados com S por 18 dias de experimento, seguido por CS para os próximos 18 dias. Eles foram, em seguida, mantidos em jejum durante 72 h (F) e, em seguida, foram realimentados por 18 dias. Biópsias da lâmina do omaso e do saco ventral do rúmen foram obtidas em diferentes momentos para cada dieta: S, no dia 18; CS, nos dias 4 e 18; F, no final das 72 h e realimentação, nos dias 4, 12 e 18. O índice mitótico (IM) da camada basal do epitélio ruminal e omaso e a concentração de AGV no rúmen foram superiores após 4 dias de CS. Houve uma correlação positiva entre os índices de mitose do rúmen e omaso. A largura das papilas ruminais variou com diferentes dietas, e foi maior no dia 18 do regime alimentar CS. Os nossos resultados indicam que a estimulação da divisão das células, em razão do aumento da energia da dieta tiveram efeitos simultâneos em ambos os compartimentos do estômago.
Termos para indexação: Acidose; fisiologia; morfologia; dieta de transição.
1Universidade Federal do Amazonas/UFAM – Colegiado de Zootecnia – Manaus – AM – Brasil – ronaldofranciscolima@yahoo.com.br 2Universidade Federal de Lavras/UFLA – Departamento de Medicina Veterinária/DMV – Lavras – MG – Brasil
3Universidade Estadual de Maringá/UEM – Departamento de Zootecnia/DZO – Maringá – PR – Brasil Received in april 10, 2015 and approved in september 14, 2015
INTRODUCTION
After calving, dairy cows typically receive high-calorie lactation diets. These diets are rich in carbohydrates that quickly ferment in the reticulorumen, resulting in increased production of volatile fatty acids (VFA). VFA produced in the reticulorumen are absorbed through the rumen wall and, after passage to the omasum, are incorporated in the fluid phase. However, if the VFA are not metabolized in the reticulorumen epithelium at the same rate that they are produced, they accumulate in the ruminal environment and cause rumen acidosis (Plaizier et al., 2009).
the amount passed to the abomasum and incorporated into the fluid phase. Excess VFA absorbed in the abomasum is correlated to decreased motility that is a precursor to digestive disturbances such as abomasum displacement (Bolton et al., 1976).
The purpose of this study was to compare the morphological responses of the mucosae of the rumen and omasum to a change in diet. The effect of diet was measured by assessing the rumen absorptive surface, mitotic index (MI) of the ruminal and the omasal epithelia, and the thickness of the keratinized and non-keratinized layers of the ruminal and omasal epithelia.
MATERIAL AND METHODS
All procedures were approved by the Bioethical Committee for Animal Utilization at the Federal University of Lavras, Brazil.
Silicone cannulas four inches in diameter were surgically attached to the dorsal rumen sacs of four non-pregnant, non-lactating cows of unspecified breeds and unknown ages (mean body weight [BW], 385 kg); these animals were sequentially fed two diets. These diets consisted of These only corn silage (S) and corn silage plus commercial concentrate (50% dry matter) (CS). The animals were kept in a tie-stall barn on sand bedding with
ad libitum access to food and water. They were fed with a total mixed ration once daily at 0700 h. The experiment was conducted over 57 days; in this time, seven sequential ingestion periods, defined as treatments, were carried out in order to compare the morphological behaviors of the rumen and omasum in response to different diets at different time points. The treatments were as follows: 18 days S diet (18S), four days CS diet (4CS), 18 days CS diet (18CS), three days of fasting (F), four days re-feeding with CS (4RCS), 12 days re-feeding with CS (12RCS), and 18 days re-feeding with CS (18RCS). These treatment time points were chosen in accordance with experiments by Goodlad (1981) and Resende Júnior et al. (2006b), who observed higher MI in the ruminal epithelium four days after the start of concentrate feeding and an increase in absorptive surface 12 days after introduction of a concentrate diet, respectively.
Food was weighed before and after feeding to measure consumption. Samples were collected and frozen at -20 °C until further analysis. After all samples had been collected, samples were thawed, grouped by week of collection, dried in a ventilated oven at 60 °C for 72 h, ground in a mill with a 1.0-mm sieve, and dried again in a ventilated oven at 105 °C. Dry matter intake (DMI)
was estimated using the average feed consumption over the final three days of each ingestion period.
Crude protein (CP) content was determined by steam digestion with a Microkjeldhall device (Association Of Official Analytical Chemists - Aoac, 1997); ash content was determined by incineration at 550 °C over 8 h in a muffle; NDF was determined as described by Van Soest, Robertson and Lewis (1991); and ether extract was determined as described by AOAC (1997).
Samples of ruminal fluid were collected by suction from the ventral sac 6 h after feeding on the last day of each treatment using a rigid PVC tube (3/4 inch) with several holes in the distal third, coupled to a hose and a plastic bottle. Ruminal fluid was separated into 10-mL aliquots and preserved in 200 µL sulfuric acid solution (50% v/v). The samples were frozen at -20 °C until further VFA analysis. VFA concentrations were determined by gas-liquid chromatography (CP-3800 Gas Chomatograph Varian, Varian Chomatography Systems, California, USA). After thawing, the ruminal fluid samples were centrifuged at 8,855 g for 15 min and the supernatant was collected.
Next, 150 µL caproic acid was added to 250 µL of the supernatant as an internal standard (N Capproic Acid, Sigma-Aldrich Chemie GmbH, Steinheim, Germany), and 100 µL of distilled water was added.. A solution mixture of acetic, propionic, butyric, and valeric acid was used as an external standard. The samples were analyzed in a composite phase capillary column (length, 25 m; internal diameter, 0.25 mm) and a 2-mm thick film (CP-Wax 58 - FFAP- CB, Varian Analytical Instruments, California USA). A temperature ramp was used in the column oven: the temperature was first increased to 65 °C within 30 s, increased at a rate of 20 °C per minute for the next 3 min to reach 125 °C, and finally increased 50 °C per minute to reach 170 °C. The total analysis time was 4.9 min.
On the last day of each treatment, the reticulorumen was evacuated approximately 10 h after feeding, and biopsies measuring approximately 1 cm2 were collected
for 22 h and stored in 70% alcohol until routine histological processing.
The evaluated variables included the number of papillae per cm2 of epithelial wall, mean papillae area, mean papillae height, mean papillae width, and total absorptive area of the rumen wall.
Four reviewers counted the number of papillae on each tissue fragment, and the average calculated for each animal. The area and height of the rumen papillae were measured as described by Resende Júnior et al. (2006b) and modified by Daniel, Resende Júnior and Cruz (2006). Briefly, twelve papillae were cut at their base with surgical scissors, placed in a petri dish, and, together with the tissue fragment without papillae, their images scanned (HP Deskjet F380 All-in-One). A 1-cm scale was placed beside the petri dish and scanned with the fragment for subsequent calibration of the image analysis software. The heights and areas of the scanned images were estimated using the UTHSCSA Image Tool analysis program (http:// ddsdx.uthscsa.edu/dig/itdesc.html).Os fragmentos fixados em Boiun foram desidratados em série crescente de álcool etílico a 70º, 80º, 90º GL e absoluto, ficando o fragmento imerso por 30 minutos em cada solução.
The height, width, and area of the rumen papillae and the MI of the ruminal and omasal epithelialbasal layers were estimated in 5-µm-thick sections stained with hematoxylin and eosin. To measure the thickness of the rumen and omasum epithelium keratinized layers (TKL) and non-keratinized layers (TNKL), fragments were stained with Masson’s trichrome.
Using a light microscope, at 400× magnification, the nuclei of 2,000 cells each from the ruminal epithelium basal layer and of the omasum lamina were counted for MI determination. All nuclei showing mitotic figures were counted, and the MI was calculated as the percentage of the total nuclei counted. Three evaluators each counted the nuclei; their mean value was the MI.
TKL and TNKL were determined using images from four microscopic fields per slide captured by a camera attached to a light microscope at 400× magnification. One image of a slide with a scale was used for posterior calibration of the image analysis software (UTHSCSA Image Tool). The total area of the epithelium and the area of keratinized epithelium were measured. The length of the epithelium in each photographed field was also measured. The total thickness of the epithelium and TKL were obtained by dividing the area by the respective length of the field. The TNKL was calculated as the difference between these measurements. The mean value of the four fields was used for data analysis, as described by Daniel, Resende Júnior and Cruz (2006).
The total thickness, the thickness of the TKL/ TNKL of the ruminal and omasal epithelia, and the MI of the epithelium basal layer of the rumen and omasum were analyzed as repeated measures using the MIXED tool in the SAS statistical program using the following model: Yijk = μ + αi + βj + αβij + γk + βγjk + εijk, where µ: overall mean; αi: random effect of the cow (i = 1 to
4); βj: fixed effect of the compartment (j = rumen or
omasum); αβij: effect of the interaction between cow and compartment (error term used to test the effect of compartment); γk: fixed effect of the treatment (k = 1 to
7); βγjk: effect of the interaction between the compartment
and treatment; εijk: residual error (error term used to test the effect of treatment and the effect of the interaction between the compartment and treatment). The DMI, VFA concentration, area, height and width of the rumen papillae, the number of rumen papillae per cm2, and the entire absorptive surface of the rumen were analyzed with the generalized linear model (GLM) tool in SAS using the following model: Yij = μ + αi + βj + εij, where, µ: overall mean; αi: effect of the cow considered as block
(i = 1 to 4); βj: effect of the treatment (j = 1 to 7); εij: residual error, assumed independently and identically distributed with a normal distribution, with a mean of zero and variance σ2. The means of these variables were
compared by Tukey post-hoc analysis. The MI of the
rumen and omasum were compared by linear regression using the REG tool, and the hypothesis that the slope is equal to 1 was tested using the TEST tool within SAS.
RESULTS AND DISCUSSION
high-energy diets (Dirksen et al., 1984; Melo et al., 2013), the response of the omasal epithelium to high-energy diets has not been evaluated.
concentration of nutrients per unit of DMI in the diet concentrates. The fasting period appears to have been detrimental to the restoration of DMI levels; during the 18 days of re-feeding, DMI did not reach the same level as 18 days after introduction of the high-energy diet before fasting. This finding is similar to reports in postpartum dairy cows of a peripartum drop in DMI (Hayirli et al., 2002).
Vazquez-Añon et al. (1994) observed decreased DMI two days before delivery and a 60% reduction in DMI three days earlier in nine dry pregnant female cows. DMI increases gradually postpartum, peaking between 10 and 14 weeks of lactation (National Research Council-Nrc, 2001).
The VFA concentration was higher on day 4CS, most likely because the diet change resulted in increased carbohydrate intake and fermentation in ruminal epithelia not yet adapted to the new rate of VFA production (Table 2). Eighteen days after introduction of the high-energy diet, the lower concentration of VFA in rumen fluid likely indicated that the rumen had adapted to the new conditions (Melo et al., 2013; Resende Júnior et al., 2006b), probably due to higher fractional absorption rate. The absence of a fermentable substrate during the fasting period explains decreased fluid VFA concentrations during this time.
Table 1: Nutritional composition of diets consumed by
cows during ingestion periods.
Composition Diet
S CS
DM, % as fed 39.3 47.1
NDF, % of DM 47.0 36.8
Ash, % of DM 3.8 4.0
Fat, % of DM 3.9 2.7
CP, % of DM 9.2 11.1
NFC1, % of DM 36.1 45.4
TDN2, % of DM 48.3 59.2
1NFC, Non-fibrous carbohydrates estimated by the equation:
100 – (%CP+%NDF+%Fat+%Ash) 2TDN, total digestible
nutrients, estimated according to NRC (2001).
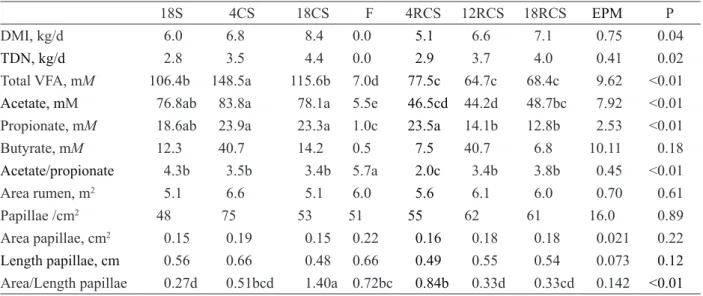
Table 2: Dry matter intake (DMI), rumen of volatile fatty acid (VFA) concentrations, and rumen morphology of cows
at different time points.
18S 4CS 18CS F 4RCS 12RCS 18RCS EPM P
DMI, kg/d 6.0 6.8 8.4 0.0 5.1 6.6 7.1 0.75 0.04
TDN, kg/d 2.8 3.5 4.4 0.0 2.9 3.7 4.0 0.41 0.02
Total VFA, mM 106.4b 148.5a 115.6b 7.0d 77.5c 64.7c 68.4c 9.62 <0.01
Acetate,mM 76.8ab 83.8a 78.1a 5.5e 46.5cd 44.2d 48.7bc 7.92 <0.01
Propionate, mM 18.6ab 23.9a 23.3a 1.0c 23.5a 14.1b 12.8b 2.53 <0.01
Butyrate, mM 12.3 40.7 14.2 0.5 7.5 40.7 6.8 10.11 0.18
Acetate/propionate 4.3b 3.5b 3.4b 5.7a 2.0c 3.4b 3.8b 0.45 <0.01
Area rumen, m2 5.1 6.6 5.1 6.0 5.6 6.1 6.0 0.70 0.61
Papillae /cm2 48 75 53 51 55 62 61 16.0 0.89
Area papillae, cm2 0.15 0.19 0.15 0.22 0.16 0.18 0.18 0.021 0.22
Length papillae, cm 0.56 0.66 0.48 0.66 0.49 0.55 0.54 0.073 0.12
Area/Length papillae 0.27d 0.51bcd 1.40a 0.72bc 0.84b 0.33d 0.33cd 0.142 <0.01
18S = 18 days eating corn silage; 4CS = 4 days eating 50% corn silage, 50% concentrate; 18CS = 18 days eating 50% corn silage, 50% concentrate; F = 3 days of fasting; 4RCS = 4 days feeding with 50% corn silage, 50% concentrate; 12RCS = 12 days re-feeding with 50% corn silage, 50% concentrate; 18RCS = 18 days re-re-feeding with 50% corn silage, 50% concentrate. Means with the same letter do not differ significantly, Tukey test (α = 0.05%).
With re-feeding, fluid VFA concentrations were lower than in the first high-energy diet period, while DMI and TDN were similar. It is possible that 72 h of fasting was not sufficient for the rumen lose its absorptive capacity. Therefore, during the re-feeding period, the ruminal epithelium was still able to tolerate the increased rate of VFA production. This lends support to the hypothesis that although there is drop in the DMI peripartum, the transition diet introduced before delivery is sufficient to promote adaption of the rumen epithelium to provide better absorptive capacity postpartum.
Teófilo et al. (2009) studied dairy cows in the transition period and found increased absorptive surface in the rumen of postpartum cows fed a high-NFC diet for three weeks prior to delivery. Anderson, Sehasted and Invartsen (1999) and Reynolds et al. (2004) discouraged use of transition diets based on the understanding that peripartum fasting would result in the rumen epithelium returning to the absorptive capacity it had before introduction of the transition diet, an understanding that appears to be incorrect.
Propionate concentration increased after the diet switch from S to CS. Silage-based diets have higher NDF content (Table 1). However, NDF are slowly degradable carbohydrates, resulting in a higher rumen pH that favors
cellulolytic bacteria and a metabolic pathway more focused on the production of acetate. Introduction of a high-energy diet containing rapidly fermentable carbohydrates results in increased ruminal VFA concentration that decrease that ruminal pH, which favors the proliferation of amylolytic bacteria, and a metabolic pathway more geared towards production of propionate (Gregorio et al., 1982). This dynamic is shown with the change of production focus from acetate to propionate (Table 2), which is directly proportional to pH and is a standard indicator of fermentation and balance in the rumen. Although we did not measure the ruminal pH, VFA concentration is known to be the major determinant of pH (Pereira; Armentano, 2000). Therefore, changes in VFA concentration in this study can be considered inversely proportional to ruminal pH changes and thus the acetate: propionate production ratio.
There was no difference between the ingestion periods in the total estimated area of the rumen. This estimate considers the area and the number of buds on tissue fragments obtained by biopsy, and there were no statistical differences between experimental periods. The values of macroscopic measurements of the extent of absorptive surface were not consistent with the microscopic estimation of MI (Figure 2), as they
Figure 1: Average daily dry matter intake (DMI, black bars) and NDT (white bars), during the different ingestion
differed between ingestion periods and were similar to the epithelial proliferation log function of direct and indirect stimulation (Sakata; Tamate, 1976) of VFA adsorption on the developing epithelium. Resende Junior et al. (2006b) also detected differences in the MI of rumen papillae of cows subjected to two concentrated feed meal frequencies. However, they detected no differences in the area and papillae length. The only variable for which the authors reported a difference was the area/length relationship, which reflects the width of the papillae. Similarly, in this experiment, we found differences between the ingestion periods in the area-length relationship of papillae in the rumen. As reported by Resende Júnior, et al. (2006b), the inaccuracies in the macroscopic measurement technique may decrease accurate detection of behavior differences in the extension of the rumen’s absorptive surface. However, other authors have reported accurate measurements of the extent of the absorptive surface using the same technique described in the current experiment (Melo et al., 2013).
The average width of the papillae of the rumen of cows, measured as the area/length ratio, increased with increasing dietary energy level. The average papillae width was highest after 18 days of feeding with CS, indicating stimulation to increase the absorptive area of these buds, similar to that reported by Resende Júnior et al. (2006b). They observed increased papillae width on
the 12th day of feeding a high-energy diet. After fasting, the buds decreased in width, but not to the S-diet width. During re-feeding, the width of the papillae recovered, but unlike the MI, the increase was not continuous, as was expected, which may be due to measurement inaccuracies, as discussed above.
The thickness of the keratin layer was higher in the ruminal epithelium than in the omasal epithelium (Table 3). However, there was no difference between the two compartments in the total thickness of the epithelium and non-keratinized layers. It is expected that the omasal epithelium has a thinner keratin layer, since its relative digestive surface is much larger than in the rumen (Daniel; Resende Júnior; Cruz, 2006), resulting in increased abrasiveness of the omasum’s absorptive surface and on the mucosa of the blades, resulting in higher keratin peeling and a thinner keratin layer.
The known dehydration of the contents of the omasum in relation to the contents of the rumen (Becker; Marshall; Dixarnold, 1963) may also favor the abrasiveness and the narrow space of the interlaminar recesses as well as omasum blade movement. The similarity between the non-keratinized epithelium layers may indicate that the cell proliferation response can be triggered by stimuli common to both the rumen and the omasum.
Figure 2: Correlation of rumen and omasum MI in non-pregnant, non-lactating cows. Omasum MI =
Table 3: Mitotic index, keratin thickness, total epithelium, and epithelium without keratin in the rumen and omasum.
Compartment
SEM1 P-value
Rumen Omasum
Mitotic index (%) 0.55 0.51 0.014 0.02
Thickness of the keratin layer (µm) 76.43 56.23 4.330 < 0.01
Thickness of the epithelium (µm) 352.94 342.71 17.431 0.674
Thickness of the non-keratin layers (µm) 276.51 286.48 16.812 0.67
1Standard error of the mean.
The MI of the basal layer of the epithelium of the rumen was higher than the basal layer of the epithelium of the omasum (Table 3). Daniel and Resende Júnior (2012) studied the stomachs of slaughterhouse animals and reported a higher average IM in the omasum than in the rumen. However, the authors did not know and had no control of the diet and the period during which the animals consumed the diet. Therefore, the animals may have been ingesting diets with different energy levels during different times, which could lead to inconsistent values, since the average values were obtained from animals with different eating patterns.
There was a positive correlation between MI of the omasum and rumen (Figure 2). This finding suggests that the factors that stimulate cell proliferation in the omasum are the same as those that stimulate cell proliferation in the rumen. This relationship has also been reported in slaughterhouse animals (Daniel; Resende Júnior, 2012).
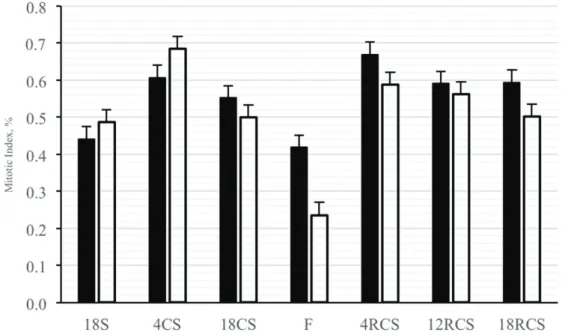
The behavior of MI in both compartments during the ingestion periods was as expected, with values relative to the energy level of the diet (Figure 3). The MI in both
the rumen and omasum increased after four days of feeding the high-energy diet, both before and after fasting. Goodlad (1981) observed an increase in the basal cell layer of the ruminal epithelium, from 0.58% with a forage-only diet, to 1.20% after the fourth day of a high-energy diet. After this peak MI, we observed a decrease after 18 days of feeding the high-energy diet, similar to a report by Goodlad (1981), who found that, after 62 days of concentrated diet, the IM returned to levels similar to those measured when the animals were fed only forage.
CONCLUSIONS
The similarity in TNKL and the positive correlation between MI of the epithelial basal layers of the rumen and omasum indicate that stimulation of cell proliferation triggered by dietary energy content operate simultaneously in both compartments. Compared to the rumen, however, the omasum appears to respond more quickly to both dietary energy proliferative stimulation and fasting.
REFERENCES
ANDERSON, J. B.; SEHASTED, J.; INVARTSEN, K. L. Effect of dry cow feeding strategy on rumen pH, concentration of volatile fatty acids and rumen epithelium development. Acta Veterinaria Scandinavica. 49(1):149-155, 1999.
ASSOCIATION OF OFFICIAL ANALYTICAL CHEMISTS-AOAC. Official Methods of Analysis. 16th ed. Gaithersburg: AOAC Intl., 1997. 1995p.
BECKER, R. B.; MARSHALL, S. P.; DIXARNOLD, P. T. Anatomy, development and functions of the bovine omasum. Journal of Dairy Science.46(8):835-839, 1963.
BOLTON, J. R. et al. Normal abomaso electromyography and emptying in sheep and the effects of intraabomasal volatile fatty acid infusion. American Journal of Veterinary Research. 37(12):387-1392, 1976.
DANEL, J. L. P.; RESENDE JÚNIOR, J. C. Absortion and metabolismo of volatle fatty acids by rumen and omasum. Ciência e Agrotecnologia. 36(1):93-99, 2012.
DANIEL, J. L. P.; RESENDE JÚNIOR, J. C.; CRUZ, F. J.Participação do rumenoretículo e omaso na superfície absortiva total do proventrículo de bovinos. Brazilian Journal of Veterinary and Animal Science.
43(5):688-694, 2006.
DIRKSEN, G. U. et al. Morphologie der pansenschleimhaut und fettsaureresorption beim rind: bedeutende faktoren fur gesundheit und leistung. Zentralblatt fur Veterinar Medizin. 31(1):414-430, 1984.
GOODLAD, R. A. Some effects of diet on the mitotic index and the cell cycle of the ruminal epithelium of sheep. Quartely Jounal of Experimental Physiology. 66(4):487-499, 1981.
Figure 3: Mitotic index of the rumen (black bars) and of omasum (white bars) of non-pregnant, non-lactating cows.
GREGORIO, R. M. et al. Carbohydrate fermentation in the large intestine of lambs. Journal of Animal Science. 54(4):855-862, 1982.
HAYIRLI, A. et al. Animal and dietary factors affecting feed intake during the prefresh transition period in Holsteins.
Journal of Dairy Science. 85(12):3430-3443, 2002.
MELO, L. Q. et al. Rumen morphometric the effect of digesta pH and volume on volatile fatty acid absorption.
Journal of Animal Science. 91(4):1775-1783, 2013.
NATIONAL RESEARCH COUNCIL-NRC. Nutrients requirements of dairy cattle. Washington: National
Academy of Science, 2001. 408p.
PEREIRA, M. N.; ARMENTANO, L. E. Partial replacement of forage with nonforage fiber sources in lactating cow diets. II. digestion and rumen function.
Journal of Dairy Science. 83(12):2876-2887, 2000.
PLAIZIER, J.C. et al. Subacute ruminal acidosis in dairy cows: The physiological causes, incidence and consequences. The Veterinary Journal. 176(1):21-31,
2009.
RABELO, E. et al. Effect of transition diets varying in dietary energy density on lactation performance and ruminal parameters of dairy cows. Journal of Dairy Science. 86(3):916-925, 2003.
RESENDE JÚNIOR, J. C. et al. Comparacion of techniques to determine the clearance of ruminalvolatile fatty acids. Journal of Dairy Science. 89(1):3096-3100,
2006a.
RESENDE JÚNIOR, J. C. et al. Effect of the feeding pattern on rumen wall morphology of cows and sheep.
Brazilian Journal of Veterinary Research and Animal Science. 43(1):526-536, 2006b.
REYNOLDS, C. K. et al. Viceral tissue mass and rumen volume in dairy cows during the transition from lete gestation to early lactation. Journal of Dairy Science. 87(1):961-971, 2004.
SAKATA, T.; TAMATE, H. Effect of intraruminal injection of n-sodium butyrate on the mitotic indices in sheep ruminal epithelium. Tohoku Journal of Agricultural Research. 27(1):133-135, 1976.
TEÓFILO, T. S. et al. Efeitos da dieta de transição com diferentes padrões energéticos na superfície absortiva ruminal de vacas leiteiras periparturientes. Ciência Animal Brasileira.10(1):842-846, 2009.
VAN SOEST, P. J.; ROBERTSON, J. B.; LEWIS, B. A. Methods for dietary fiber, neutral detergent fiber, and nonstarch polysaccharides in relation to animal nutrition. Journal Dairy Science. 74(10):3583-3597,
1991.
VAZQUEZ-AÑON, M. et al. Peripartum liver triglyceride and plasma metabolites in dairy cows.
Journal of Dairy Science. 77(1):1521-1528, 1994.