CPD
7, 1235–1259, 2011Weakened atmospheric energy transport feedback in
cold glacial climates
I. Cvijanovic et al.
Title Page
Abstract Introduction
Conclusions References
Tables Figures
◭ ◮
◭ ◮
Back Close
Full Screen / Esc
Printer-friendly Version
Interactive Discussion
Discussion
P
a
per
|
Dis
cussion
P
a
per
|
Discussion
P
a
per
|
Discussio
n
P
a
per
Clim. Past Discuss., 7, 1235–1259, 2011 www.clim-past-discuss.net/7/1235/2011/ doi:10.5194/cpd-7-1235-2011
© Author(s) 2011. CC Attribution 3.0 License.
Climate of the Past Discussions
This discussion paper is/has been under review for the journal Climate of the Past (CP). Please refer to the corresponding final paper in CP if available.
Weakened atmospheric energy transport
feedback in cold glacial climates
I. Cvijanovic, P. L. Langen, and E. Kaas
Centre for Ice and Climate, Niels Bohr Institute, University of Copenhagen, Juliane Maries Vej 30, 2100 Copenhagen, Denmark
Received: 10 March 2011 – Accepted: 2 April 2011 – Published: 13 April 2011 Correspondence to: I. Cvijanovic ([email protected])
CPD
7, 1235–1259, 2011Weakened atmospheric energy transport feedback in
cold glacial climates
I. Cvijanovic et al.
Title Page
Abstract Introduction
Conclusions References
Tables Figures
◭ ◮
◭ ◮
Back Close
Full Screen / Esc
Printer-friendly Version
Interactive Discussion
Discussion
P
a
per
|
Dis
cussion
P
a
per
|
Discussion
P
a
per
|
Discussio
n
P
a
per
|
Abstract
The response of atmospheric energy transport during Northern Hemisphere cooling and warming from present day (PD) and Last Glacial Maximum (LGM) conditions is in-vestigated using sea surface temperature anomalies derived from a freshwater hosing experiment. The present day climate shows enhanced sensitivity of the atmospheric
5
energy transport compared to that of the LGM suggesting an ability of the PD atmo-sphere to reorganize more easily and thereby dampen temperature anomalies that may arise from changes in the oceanic transport. The increased PD sensitivity relative to that of the LGM is due mainly to a stronger dry static energy transport response which, in turn, is driven chiefly by larger changes in the transient eddy heat flux. In
10
comparison, changes in latent heat transport play a minor role in the overall transport sensitivity.
1 Introduction
Proxy climate data from around the world show enhanced variability during glacial peri-ods (e.g. D/O events) compared to the interglacials (e.g., Greenland ice cores (NGRIP
15
Members, 2004), Antarctic ice cores (EPICA Members, 2006), Cariaco Basin sedi-ment cores (Peterson et al., 2000), Asian cave stalagmites (Wang et al., 2001) and Arabian Sea sediment cores (Banakar et al., 2010). Changes in the oceanic circulation and halocline stability (due to, e.g., ice discharge or meltwater events) are considered a potential driver of these abrupt events as inferred from the ocean sediment data
20
and modeling studies (Keigwin et al., 1994; Broecker et al., 1994; Dahl et al., 2005). Although the role of the atmosphere is considered secondary in this regard, various atmospheric and surface feedbacks can enhance or weaken the initial anomaly in the oceanic state. The focus of this study is on a presumably negative feedback, namely the atmospheric heat transport and its response to high northern latitude temperature
25
CPD
7, 1235–1259, 2011Weakened atmospheric energy transport feedback in
cold glacial climates
I. Cvijanovic et al.
Title Page
Abstract Introduction
Conclusions References
Tables Figures
◭ ◮
◭ ◮
Back Close
Full Screen / Esc
Printer-friendly Version
Interactive Discussion
Discussion
P
a
per
|
Dis
cussion
P
a
per
|
Discussion
P
a
per
|
Discussio
n
P
a
per
Numerous modeling studies have addressed communication between high and low latitudes, showing that changes in ice cover, Atlantic Meridional Overturning Circula-tion (AMOC) or generally antisymmetric interhemispheric heating in the high latitudes can induce a displacement of the ITCZ (Zhang and Delworth, 2005; Chiang and Bitz, 2005; Broccoli et al., 2006; Chiang et al., 2008). In spite of a dominance of atmospheric
5
over oceanic transport in the extratropics (Trenberth and Caron 2001; Wunsch, 2005), possible changes in the sea ice extent due to oceanic transport variations, and their further influence on the atmospheric circulation leave the ocean a relevant trigger for abrupt climate shifts.
The sensitivity of the atmospheric energy transport to global mean temperature
10
and meridional temperature gradients was previously studied by Caballero and Lan-gen (2005) in a series of aquaplanet simulations. They found atmospheric heat trans-port independent of global mean temperature in cases when the global mean tempera-ture was high and meridional temperatempera-ture gradient low. These climate states were also the ones in which sensitivity to temperature gradient was largest. Cheng et al. (2007)
15
focused on the atmospheric and oceanic heat transport responses due to AMOC slow-down under LGM and PD conditions. They found the oceanic heat transport largely compensated by the atmospheric heat transport with midlatitude transient eddy trans-port playing an imtrans-portant role for the overall atmospheric response in both climates. Hwang and Frierson (2010) investigated the atmospheric poleward energy transport
20
under global warming and found the change in atmospheric moisture content and la-tent heat transport to be the main cause for the total atmospheric transport changes while the dry static energy transport plays a smaller, compensating role.
This study investigates the sensitivity of the atmospheric energy transport to merid-ional temperature gradients under glacial and interglacial climates. In contrast to the
25
CPD
7, 1235–1259, 2011Weakened atmospheric energy transport feedback in
cold glacial climates
I. Cvijanovic et al.
Title Page
Abstract Introduction
Conclusions References
Tables Figures
◭ ◮
◭ ◮
Back Close
Full Screen / Esc
Printer-friendly Version
Interactive Discussion
Discussion
P
a
per
|
Dis
cussion
P
a
per
|
Discussion
P
a
per
|
Discussio
n
P
a
per
|
transport variations). A weakened atmospheric transport sensitivity, i.e., a less negative atmospheric feedback, would imply a climate state with the atmosphere less capable of damping high latitude temperature anomalies arising from changes in the oceanic transport. In this case, the climate is thus likely to be influenced more strongly by ex-cursions in the oceanic circulation (by spending longer time in cold or warm phases).
5
In an atmospheric general circulation model (AGCM), high latitude SST anomalies are applied mainly in the North Atlantic mimicking the effect of changing AMOC strength.
The sensitivity of the atmospheric response to different sea ice extents and SSTs is
then tested with the anomalies applied in two background climates (PD and LGM).
2 Experimental configuration
10
The atmospheric transport sensitivity is tested using the National Center for Atmo-spheric Research’s CCM3 (Kiehl et al., 1998), employing T42 horizontal resolution with 18 levels in the vertical. This AGCM was run in prescribed SST mode with both PD SSTs (Shea et al., 1992) and LGM SSTs (CLIMAP, 1994) in order to obtain the two control simulations. LGM topography and land mask is taken from the ICE-5G
recon-15
struction of Peltier (2004). Experiments have been run for 30 yr and averages over the last 20 yr are used in the analysis. The main parameters describing the experiments are given in Table 1.
SST anomalies are derived from a freshwater hosing experiment in the intermediate complexity model ECBilt-CLIO (Goosse and Fichefet, 1999; Opsteegh et al., 1998). In
20
an experiment similar to that of Renssen et al. (2002), a freshwater forcing of 1.5 Sv was applied to the ECBilt-CLIO for 20 yr in the North Atlantic and SST anomalies are calculated from the difference between the resulting on-state after recovery and the
off-state of the AMOC (details are given by Wang, 2009). These annually varying SST
anomaly fields are multiplied by a series of different strength factors and added to the
25
CPD
7, 1235–1259, 2011Weakened atmospheric energy transport feedback in
cold glacial climates
I. Cvijanovic et al.
Title Page
Abstract Introduction
Conclusions References
Tables Figures
◭ ◮
◭ ◮
Back Close
Full Screen / Esc
Printer-friendly Version
Interactive Discussion
Discussion
P
a
per
|
Dis
cussion
P
a
per
|
Discussion
P
a
per
|
Discussio
n
P
a
per
of perturbations starting from each. Experiments are named after the strength factor used to multiply the anomaly: prefixprefers to positive anomalies (NH warming) and
mto negative anomalies (NH cooling), with strengths ranging from−2 to 2.
In the simulations, a sea surface temperature of −1.8◦C (freezing point) is used as the criterion to distinguish between the open ocean points and sea ice points of 2 m
5
thickness. Therefore, when preparing the perturbation input fields, surface temper-ature (TS) fields from the control experiments were employed at the ocean points to allow for temperatures below−1.8◦C in the presence of sea ice. During summer, how-ever, sea iceTS may attain values between−1.8◦C and 0◦C, which would imply that a sea ice point is mistaken for an ocean point. To avoid this, we subtracted 1.8 K from
10
the sea ice points with temperatures above the freezing point of sea water. The SST anomaly fields were then added to these controlTS fields and Fig. 1b and c demon-strates the resulting sea ice lines. Note that summer is shown here as it is the season with the highest sea ice decline due to the anomalies imposed.
Although we do impose perturbations that tend to realistically represent the effects
15
of changes in the oceanic heat transport, the important point is not the exact SST and sea ice line geometries which will depend on model and background climate, but the alteration of the large scale Northern Hemisphere meridional temperature gradient (NHTG) obtained in this way. Here we define NHTG as the difference of the average
surface temperatures over the areas 0◦–30◦N and 30◦–90◦N. Using the NHTG as a
20
metric enables a comparison between the two climates that significantly differ from
each other in their surface conditions (different SST fields, sea ice geometries,
topog-raphy etc.). The SST anomalies applied in the PD and LGM simulations are identical, but the resulting NHTG anomalies are not, because the large LGM sea ice extent with low surface temperatures requires much larger anomalies for open ocean points to
25
tem-CPD
7, 1235–1259, 2011Weakened atmospheric energy transport feedback in
cold glacial climates
I. Cvijanovic et al.
Title Page
Abstract Introduction
Conclusions References
Tables Figures
◭ ◮
◭ ◮
Back Close
Full Screen / Esc
Printer-friendly Version
Interactive Discussion
Discussion
P
a
per
|
Dis
cussion
P
a
per
|
Discussion
P
a
per
|
Discussio
n
P
a
per
|
perature or lower tropospheric temperature was used instead of surface temperature in the definition of NHTG.
3 Results
3.1 Atmospheric transport sensitivities
Total northward atmospheric and latent energy transports are calculated from the
at-5
mospheric energy and fresh water budgets, respectively. Such implied transport calcu-lations assume a steady state with constant (long term) energy and moisture content in the column, which is the case for the multi-year averages used in these calculations. Northward dry static energy transport (DSE) is obtained as the residual between the total atmospheric and latent heat transports. We do not account for the very small
10
kinetic energy transport (it remains a part of the DSE transport). These calculations have been verified by direct calculation using vertical integrals of meridional advection of temperature, water vapor and geopotential (vT, vq and vΦ).
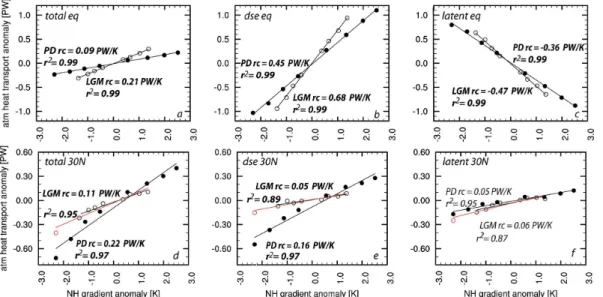
Total transport anomalies at the equator and 30◦N are plotted as a function of NHTG anomalies in Fig. 2. Imposed NH warming/cooling (negative/positive NHTG anomalies)
15
causes a decreased/increased total atmospheric transport. Panels a, b and c show total, dry static energy (DSE) and latent cross-equatorial heat transport for PD (solid circles) and LGM (open circles) warming and cooling simulations. Panels d, e and f show the same for the transports across 30◦N.
Linear regression coefficients rc (and the correspondingr2 values) of transport
ver-20
sus NHTG anomalies provide a measure of the sensitivity of the atmospheric transport. Statistical significance of the results was confirmed by Monte Carlo sampling, giving frequency distributions of rc differences between the two climates based on yearly
samples. The LGM simulations indicate an enhanced total transport sensitivity at the equator and decreased sensitivity at 30◦N relative to PD (Fig. 2a and d). The PD
simu-25
CPD
7, 1235–1259, 2011Weakened atmospheric energy transport feedback in
cold glacial climates
I. Cvijanovic et al.
Title Page
Abstract Introduction
Conclusions References
Tables Figures
◭ ◮
◭ ◮
Back Close
Full Screen / Esc
Printer-friendly Version
Interactive Discussion
Discussion
P
a
per
|
Dis
cussion
P
a
per
|
Discussion
P
a
per
|
Discussio
n
P
a
per
Separation of the total transport into DSE (Fig. 2b) and latent (Fig. 2c) components reveals the canceling effect that the two have at the equator with DSE giving the sign of
the total response in both climates (slopes for DSE are 0.45 PW K−1 and 0.68 PW K−1 compared to−0.36 PW K−1and−0.47 PW K−1for latent transport, for the PD and LGM cases, respectively). Both components show stronger cross equatorial response in the
5
LGM climate compared to the PD.
At 30◦N the PD total response is double that of the LGM with the DSE component being the main cause of the difference (Fig. 2d and e). Compared to the LGM, the PD
DSE response is almost three times larger (slopes are 0.16 PW K−1and 0.05 PW K−1 for PD and LGM). Latent energy transport (Fig. 2f) shows lower sensitivity compared
10
to DSE (Fig. 2e) in PD simulations. In contrast to this, in LGM simulations DSE and latent transport sensitivities are approximately the same.
An additional experiment, in which three times the initial anomaly was added to the LGM background climate (LM p3), was performed in order to obtain a NHTG anomaly with a value similar to that in the maximum NH PD warming case (PD p2). This
addi-15
tional experiment also allows for a comparison between the two climates under similar sea ice extents. This is illustrated in Fig. 2 (in red open circles). The overall slope of the midlatitude LGM response is still much smaller than the PD even when including such an extreme perturbation.
We also tested whether the above findings are valid for the monthly transport
anoma-20
lies due to the seasonal changes in NHTG (not shown). In comparison with our orig-inal experiments with high- to mid-latitude perturbations, the NHTG has much larger variations throughout the course of the year with amplitude close to 30 K. The weak-ened LGM mid-latitude transport sensitivity to NHTG perturbations remains valid for the monthly values: the response is higher in the PD than in the LGM simulation and
25
CPD
7, 1235–1259, 2011Weakened atmospheric energy transport feedback in
cold glacial climates
I. Cvijanovic et al.
Title Page
Abstract Introduction
Conclusions References
Tables Figures
◭ ◮
◭ ◮
Back Close
Full Screen / Esc
Printer-friendly Version
Interactive Discussion
Discussion
P
a
per
|
Dis
cussion
P
a
per
|
Discussion
P
a
per
|
Discussio
n
P
a
per
|
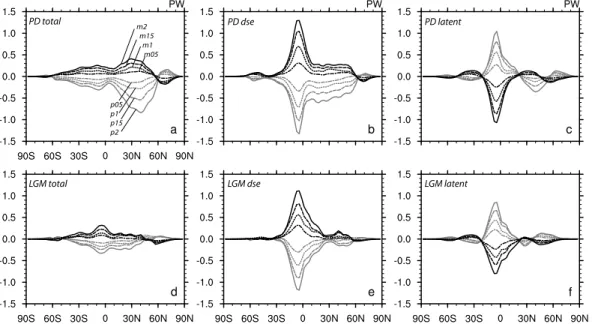
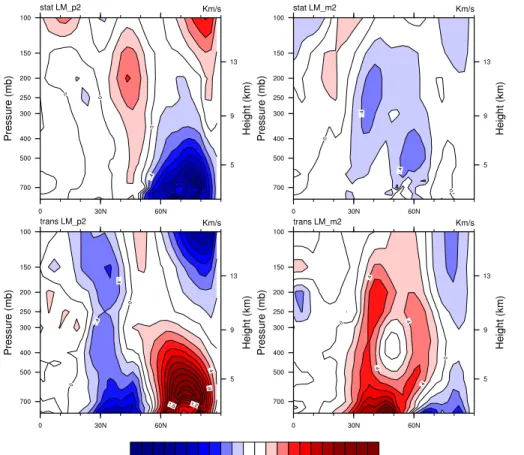
3.2 Meridional structure
To further investigate the atmospheric transport response to the imposed perturba-tions, we consider the meridional structure of the anomalies (Fig. 3). PD total transport anomalies (Fig. 3a) peak around 35◦N with larger amplitude than the LGM anomalies (Fig. 3d) whose peak is located close to the equator. Separating the total transport
5
into its two components, we find that the larger anomalies are seen in DSE, both in PD and LGM climates. An interesting feature is the tail in PD DSE transport anomaly (Fig. 3b) that reaches up to 60◦N. Here DSE and latent transport anomalies have the same sign and this is thus the main cause of the extratropical peak in the PD net trans-port anomaly (Fig. 3a). These features are not present in the LGM and the peak in
10
total atmospheric LGM transport (Fig. 3d) comes from a weaker cancellation between equatorial DSE and latent transport changes.
3.2.1 Mid-latitude response
Decomposition of the DSE anomalies into its sensible and potential components (not shown) reveals the canceling effect that the two have, with the sensible heat transport
15
anomaly yielding the sign of the mid-latitude PD DSE response. In contrast, in the LGM simulations both components have much smaller anomalies with the sensible heat transport determining the overall DSE anomaly in lower mid-latitudes and potential energy transport in the higher mid-latitudes. Given that the atmospheric heat transport in mid-latitudes is mainly provided by the eddies, the different responses of the sensible
20
heat transport in the two climates can be explained by considering the stationary and transient eddy heat flux components. Figures 4 and 5 show stationaryhv∗T∗i(upper
panels) and transienthv′T′
i
(lower panels) meridional eddy heat flux anomalies for PD and LGM simulations, respectively (square brackets denote zonal means and overbars time means, primes/stars denote deviations from the time/zonal mean). We find the
25
CPD
7, 1235–1259, 2011Weakened atmospheric energy transport feedback in
cold glacial climates
I. Cvijanovic et al.
Title Page
Abstract Introduction
Conclusions References
Tables Figures
◭ ◮
◭ ◮
Back Close
Full Screen / Esc
Printer-friendly Version
Interactive Discussion
Discussion
P
a
per
|
Dis
cussion
P
a
per
|
Discussion
P
a
per
|
Discussio
n
P
a
per
PD control and weaker transient eddy heat fluxes (not shown). A similar result was found by Murakami et al. (2008) who saw increased mid-latitude DSE transport during LGM due to increased stationary wave activity. Increased stationary wave activity in LGM has been shown to be caused by the LGM orography (Cook and Held, 1988). Despite the increased stationary eddy heat flux in the glacial control, it is the transient
5
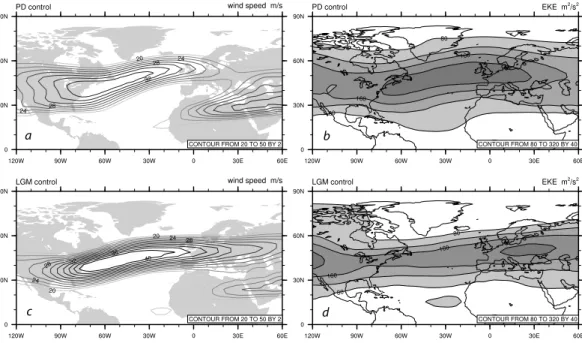
eddy heat flux anomalies that determine the overall eddy heat flux response to the added surface perturbations in both climates (Figs. 4 and 5). With NH cooling/warming, the transient eddy heat flux increases/decreases with the equator to pole temperature gradient, but in the LGM simulations this response is weaker than in PD and displaced towards lower mid-latitudes. Figure 6, showing the vertically integrated transient and
10
stationary eddy heat transport anomalies, confirms this picture of significantly larger transient transport anomalies (left plot) compared to the stationary transport anomalies (right plot) and the enhanced PD response (black lines) compared to the LGM (grey lines).
In conclusion, the cause of the decreased mid-latitude DSE transport sensitivity in
15
cold glacial climates is the decreased sensible heat transport sensitivity, which, in turn, is a consequence of the weakened transient eddy heat flux response. In our LGM simulations we see an enhanced and narrower polar jet (Fig. 7c) and decreased eddy kinetic energy (Fig. 7d) in the North Atlantic compared to the PD simulations (Fig. 7a and b). Other studies (Li and Battisti, 2008; Donohoe and Battisti, 2009) have noted
20
reduced storminess under glacial conditions despite the stronger Atlantic jet which is in line with our findings. The dominance of mid-latitude DSE response in AMOC slow-down experiments was also found by Cheng et al. (2007) who had as well attributed it to increased transient eddy activity. It is important to note the difference to the global
warming experiments of Hwang and Frierson (2010), where latent heat flux dominates
25
CPD
7, 1235–1259, 2011Weakened atmospheric energy transport feedback in
cold glacial climates
I. Cvijanovic et al.
Title Page
Abstract Introduction
Conclusions References
Tables Figures
◭ ◮
◭ ◮
Back Close
Full Screen / Esc
Printer-friendly Version
Interactive Discussion
Discussion
P
a
per
|
Dis
cussion
P
a
per
|
Discussion
P
a
per
|
Discussio
n
P
a
per
|
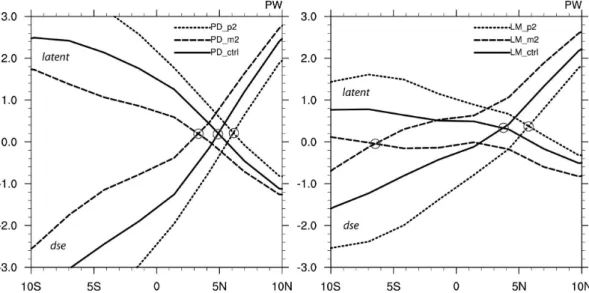
3.2.2 Low-latitude effects
Changes in cross-equatorial energy transports are related to changes in Hadley cell dynamics and shifts in the ITCZ. A more northward/southward ITCZ location results in more energy transported to the Southern/Northern Hemisphere. DSE transport in-creases towards the cooled hemisphere and latent towards the warmed one. The
5
location of the crossover between the annual latent and DSE transports was found by Trenberth and Stepaniak (2003) to coincide with the time mean location of the ITCZ, and we will exploit that here and use it as a proxy. This is illustrated in Fig. 8 for the PD and LGM simulations as the intersection of lines with the same dash pattern. In PD simulations the crossover is located in the Northern Hemisphere for all of the
perturba-10
tions. The position is at 5◦N in the control, and depending on the perturbation strength it gets displaced northward or southward, while staying in the NH. In contrast, the LGM time mean ITCZ location is closer to the equator and more sensitive to the imposed perturbations such that it shifts all the way to 6◦S in the cooling simulation and to 6◦N in the warming simulation. The fact that the crossover between the two transports
co-15
locates with the present day ITCZ does not necessarily carry over to LGM conditions, but consideration of the crossovers reveals that there is something essentially different
in the energy transport partitioning under glacial and interglacial conditions.
The ability of the Hadley cell to transport energy more or less efficiently can be
deter-mined from the total gross moist static stability by using, for example, the ratio between
20
the total energy and mass transports, as done by Kang et al. (2009). In our experi-ments, the Hadley cells are shifted between the two climates, so we simply use the ra-tio of the northward energy heat transport at the latitude of the maximum mass stream function and the stream function maximum itself. In this manner we obtain a measure of the northern Hadley cell efficiency in transporting energy to the mid-latitudes, which
25
CPD
7, 1235–1259, 2011Weakened atmospheric energy transport feedback in
cold glacial climates
I. Cvijanovic et al.
Title Page
Abstract Introduction
Conclusions References
Tables Figures
◭ ◮
◭ ◮
Back Close
Full Screen / Esc
Printer-friendly Version
Interactive Discussion
Discussion
P
a
per
|
Dis
cussion
P
a
per
|
Discussion
P
a
per
|
Discussio
n
P
a
per
has on the DSE transport and yields a larger LGM total northward transport in the low latitudes compared to the present day. We speculate that this larger efficiency permits
the LGM energy transport to respond more readily to the circulation changes imposed by the meridional temperature gradients. Further details behind the different Hadley
cell responses in the two climates are beyond the scope of the study.
5
4 Discussion and conclusion
Our study demonstrates enhanced atmospheric heat transport sensitivity under warm (interglacial) compared to cold (glacial) conditions. This is shown to be a feature of both annual mean transports (in the experiments with added SST perturbations) and of monthly transports (in the control runs, due to seasonal variations of NHTG). The
10
weakened glacial transport sensitivity is linked to a reduced transient eddy heat flux response. In comparison to the PD climate, the glacial climate is found to have stronger overall stationary eddy heat fluxes, weaker transient eddy heat fluxes, a stronger and narrower polar jet and decreased eddy kinetic energy in the North Atlantic. With SST anomalies added in both climates, the transient eddy heat flux responses dominate
15
over those of the stationary eddy heat fluxes, an effect which is larger in PD than in
LGM simulations.
Consequently, the PD climate appears more capable of damping high latitude anomalies due to the strong mid-latitude response while much less change is seen in the tropics. In contrast, the LGM simulations display the major response in the
20
tropics where the cancellation between DSE and latent heat transports is weaker and energy is transported more efficiently from the tropics. From Fig. 2 it is possible to
estimate the sensitivity of transport convergence into the area 0◦–30◦N for the PD and LGM experiments. When the NHTG increases by 1 K (as a result of the added surface perturbations), the PD equator sees an increased import of energy from the
25
CPD
7, 1235–1259, 2011Weakened atmospheric energy transport feedback in
cold glacial climates
I. Cvijanovic et al.
Title Page
Abstract Introduction
Conclusions References
Tables Figures
◭ ◮
◭ ◮
Back Close
Full Screen / Esc
Printer-friendly Version
Interactive Discussion
Discussion
P
a
per
|
Dis
cussion
P
a
per
|
Discussion
P
a
per
|
Discussio
n
P
a
per
|
experiments, the resulting import of energy from the Southern Hemisphere is consid-erably larger (0.21 PW) and the poleward transport at 30◦N is considerably smaller (0.11 PW) and the area 0◦–30◦N encounters a netgainof 0.10 PW. The two effects of the prime LGM response being in the tropics and the prime PD response being in the mid-latitudes thus combine to yield opposite tendencies on the 0◦–30◦N energy budget
5
with a gain in LGM and a loss in PD. The net contribution to the 30◦–90◦N budgets from the energy transport are just equal to the 30◦N sensitivities, i.e., 0.22 PW for PD and 0.11 PW for LGM. From these quantities we can calculate the energy transport contri-bution to the tendency on NHTG as the net for the low latitude area less that of the high latitude area. For the PD experiments we find−0.13 PW−0.22 PW=−0.35 PW,
10
and for the LGM we find 0.10 PW−0.11 PW=−0.01 PW. The contribution of the
merid-ional energy transport to the negative tendency on the NHTG is thus much larger for the PD than for the LGM. In the PD, there is thus a much larger negative feedback on the imposed temperature gradients as a consequence of the enhanced atmospheric transport response.
15
Although the atmospheric circulation changes are not considered to be the primary cause of decreased interglacial variability, these results give an important indication of a varying ability of the atmosphere to feed back negatively on imposed oceanic changes in different climates. Surface boundary conditions as seen by the atmosphere,
i.e., topography, sea ice and SST, are quite different in PD and LGM, and we therefore
20
see a general response that is different during LGM. In order to qualitatively constrain
the importance of the sea ice geometry, an additional experiment with three times the initial anomaly added to the LGM background climate was performed. This simulation had much less summer sea ice and a NHTG anomaly similar to that of the PD p2 case. The overall slope of the LGM response was not affected significantly by the inclusion of
25
CPD
7, 1235–1259, 2011Weakened atmospheric energy transport feedback in
cold glacial climates
I. Cvijanovic et al.
Title Page
Abstract Introduction
Conclusions References
Tables Figures
◭ ◮
◭ ◮
Back Close
Full Screen / Esc
Printer-friendly Version
Interactive Discussion
Discussion
P
a
per
|
Dis
cussion
P
a
per
|
Discussion
P
a
per
|
Discussio
n
P
a
per
however, not necessarily the only reason given that according to, for instance, Cook and Held (1988), it is the LGM orography that causes a change in the stationary ed-dies and thus forces a different partitioning of the transient and stationary components
between the two climates.
In conclusion, the sensitivity of the transport to NHTG changes (that depends on
5
the background surface conditions described above) shows less negative transport feedback during LGM as compared to PD. Further work is required to evaluate the described responses when the interactions with the ocean surface are allowed.
Acknowledgements. This work was supported in part by a grant of HPC resources from the
Arctic Region Supercomputing Center (ARSC) at the University of Alaska Fairbanks as part
10
of the Department of Defense High Performance Computing Modernization Program. The authors acknowledge the support of the Danish National Research Foundation and thank Peter D. Ditlevsen and John C. H. Chiang for useful discussions as well as Peter Wang for supplying the temperature anomalies associated with the ECBilt-CLIO freshwater experiments.
References
15
Banakar, V. K., Mahesh, B. S., Burr, G., and Chodankar, A. R.: Climatology of the Eastern Ara-bian Sea during the last glacial cycle reconstructed from paired measurement of foraminiferal d18O and Mg/Ca, Quat. Res., 73(3), 535–540, doi:10.1016/j.yqres.2010.02.002, 2010. Broccoli, A. J., Dahl, K. A., and Stouffer, R. J.: Response of the ITCZ to Northern Hemisphere
cooling, Geophys. Res. Lett., 33, L01702, doi:10.1029/2005GL024546, 2006.
20
Broecker, W. S.: Massive iceberg discharges as triggers for global climate change, Nature, 372, 421–424, 1994.
Caballero, R. and Langen, P. L.: The dynamic range of poleward energy trans-port in an atmospheric general circulation model, Geophys. Res. Lett., 32, L02705, doi:10.1029/2004GL021581, 2005.
25
CPD
7, 1235–1259, 2011Weakened atmospheric energy transport feedback in
cold glacial climates
I. Cvijanovic et al.
Title Page
Abstract Introduction
Conclusions References
Tables Figures
◭ ◮
◭ ◮
Back Close
Full Screen / Esc
Printer-friendly Version
Interactive Discussion
Discussion
P
a
per
|
Dis
cussion
P
a
per
|
Discussion
P
a
per
|
Discussio
n
P
a
per
|
Chiang, J. C. H. and Bitz, C. M.: Influence of high latitude ice cover on the marine Intertropical Convergence Zone, Clim. Dynam., 25, 477–496, 2005.
Chiang, J. C. H, Cheng, W., and Bitz, C. M.: Fast teleconnections to the tropical At-lantic sector from AtAt-lantic thermohaline adjustment, Geophys. Res. Lett., 35, L07704, doi:10.1029/2008GL033292, 2008.
5
CLIMAP: CLIMAP 18K Database, IGBP PAGES/World Data Center for Paleoclimatology Data Contribution Series 94-001, Technical report NOAA/NGDC Paleoclimatology Program, Boul-der CO, USA, 1994.
Cook, K. H. and Held, I. M.: Stationary waves of the ice age climate, J. Climate, 1, 807–819, 1988.
10
Dahl, K. A., Broccoli, A. J., and Stouffer, R. J.: Assessing the role of North Atlantic freshwater
forcing in millennial scale climate variability: A tropical Atlantic perspective, Clim. Dynam., 24, 325–346, 2005.
Donohoe, A. and Battisti, D. S.: Causes of reduced North Atlantic storm activity in a CAM3 simulation of the Last Glacial Maximum, J. Climate, 22, 4793–4808, 2009.
15
EPICA Community Members: One-to-one coupling of glacial climate variability in Greenland and Antarctica, Nature, 444, 195–198, 2006.
Goosse., H., and Fichefet, T.: Importance of ice-ocean interactions for the global ocean circu-lation: A model study, J. Geophys. Res., 104, 23337–23355, 1999.
Hwang Y. T and Frierson, D. M. W.: Increasing atmospheric poleward energy transport with
20
global warming, Geophys. Res. Lett., 37, L24807, doi:10.1029/2010GL045440, 2010. Kang, S. M., Frierson, D. M. W., and Held, I. M.: The tropical response to extratropical thermal
forcing in an idealized GCM: The importance of radiative feedbacks and convective parame-terization, J. Atmos. Sci., 66, 2812–2827, doi:10.1175/2009JAS2924.1, 2009.
Keigwin, L. D., Curry, W. B., Lehman, S. J., and Johnsen, S.: The role of the deep ocean in
25
North Atlantic climate change between 70 and 130 kyr ago, Nature, 371, 323–326, 1994. Kiehl J. T., Hack, J. J., Bonan, G. B., Boville, B. A., Williamson, D. L., and Rasch, P. J.: The
National Center for Atmospheric Research Community Climate Model, CCM3, J. Climate, 11, 1131–1149, 1998.
Li, C. and Battisti, D. S.: Reduced Atlantic Storminess during Last Glacial Maximum: Evidence
30
from a Coupled Climate Model, J. Climate, 21(14), 3561–3579, 2008.
CPD
7, 1235–1259, 2011Weakened atmospheric energy transport feedback in
cold glacial climates
I. Cvijanovic et al.
Title Page
Abstract Introduction
Conclusions References
Tables Figures
◭ ◮
◭ ◮
Back Close
Full Screen / Esc
Printer-friendly Version
Interactive Discussion
Discussion
P
a
per
|
Dis
cussion
P
a
per
|
Discussion
P
a
per
|
Discussio
n
P
a
per
Murakami, S., Ohgaito, R., Abe-Ouchi, A., Crucifix, M., and Otto-Bliesner, B. L.: Global-Scale Energy and Freshwater Balance in Glacial Climate: A Comparison of Three PMIP2 LGM Simulations, J. Climate, 21(19), 5008–5033, 2008.
Opsteegh J. D., Haarsma, R. J., Selten, F. M., and Kattenberg, A.: ECBILT: a dynamic alterna-tive to mixed boundary conditions in ocean models, Tellus, 50A, 348–367, 1998.
5
Peltier, W. R.: Global glacial isostasy and the surface of the ice age Earth: The ICE-5G (VM2) model and GRACE, Ann. Rev. Earth Planet. Sci., 32, 111–149, 2004.
Peterson, L. C., Haug, G. H., Hughen, K. A., and Rohl U.: Rapid changes in the hy-drologic cycle of the tropical Atlantic during the last glacial, Science, 290, 1947–1951, doi:10.1126/science.290.5498.1947, 2000.
10
Renssen H., Goose, H., and Fichefet, T.: Modeling the effect of freshwater pulses on the early
Holocene climate: The influence of high-frequency climate variability, Paleoceanography, 17(2), 1020, doi:10.1029/2001PA000649, 2002.
Shea, D. J., Trenberth, K. E., and Reynolds, R. W.: A global monthly sea surface temperature climatology, J. Climate, 5, 987–1001, 1992.
15
Trenberth, K. E. and Caron, J. M.: Estimates of meridional atmosphere and ocean heat trans-ports, J. Climate, 14, 3433–3443, 2001.
Trenberth, K. E. and Stepaniak, D. P.: Covariability of components of poleward atmospheric energy transports on seasonal and interannual timescales, J. Climate, 16, 3691–3705, 2003. Wang, Y. J., Cheng, H., Edwards, R. L., An, Z. S., Wu, J. Y., Shen, C. C., and Dorale, J. A.: A
20
High-Resolution Absolute-Dated Late Pleistocene Monsoon Record from Hulu Cave, China, Science, 294, 2345–2348, doi:10.1126/science.1064618, 2001.
Wang, P.: Seasonality over Greenland during the Holocene and possible explanations of the 8.2 kyr event – A study based on the circulation model ECBilt-CLIO, Msc Thesis, NBI, University of Copenhagen, Denmark, 2009.
25
Wunsch, C.: The total meridional heat flux and its oceanic and atmospheric partition, J. Climate, 18, 4374–4380, 2005.
CPD
7, 1235–1259, 2011Weakened atmospheric energy transport feedback in
cold glacial climates
I. Cvijanovic et al.
Title Page
Abstract Introduction
Conclusions References
Tables Figures
◭ ◮
◭ ◮
Back Close
Full Screen / Esc
Printer-friendly Version
Interactive Discussion
Discussion
P
a
per
|
Dis
cussion
P
a
per
|
Discussion
P
a
per
|
Discussio
n
P
a
per
|
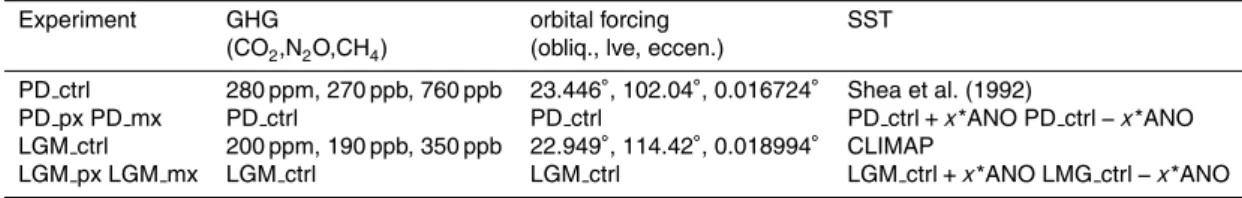
Table 1.Experiment summary,xis the strength factor used to multiply the anomaly (x=0.5, 1, 1.5, 2), ANO – anomaly from ECBilt-CLIO experiments.
Experiment GHG orbital forcing SST
(CO2,N2O,CH4) (obliq., lve, eccen.)
PD ctrl 280 ppm, 270 ppb, 760 ppb 23.446◦, 102.04◦, 0.016724◦ Shea et al. (1992)
PD px PD mx PD ctrl PD ctrl PD ctrl+x*ANO PD ctrl−x*ANO
LGM ctrl 200 ppm, 190 ppb, 350 ppb 22.949◦, 114.42◦, 0.018994◦ CLIMAP
CPD
7, 1235–1259, 2011Weakened atmospheric energy transport feedback in
cold glacial climates
I. Cvijanovic et al.
Title Page
Abstract Introduction
Conclusions References
Tables Figures
◭ ◮
◭ ◮
Back Close
Full Screen / Esc
Printer-friendly Version
Interactive Discussion
Discussion
P
a
per
|
Dis
cussion
P
a
per
|
Discussion
P
a
per
|
Discussio
n
P
a
per
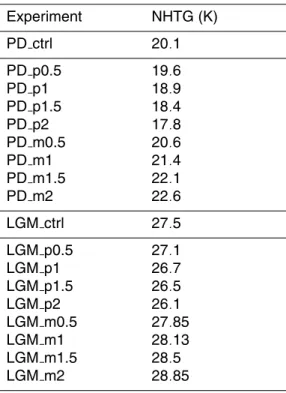
Table 2. Resulting Northern Hemisphere meridional temperature gradients (NHTG) from the different experiments.
Experiment NHTG (K) PD ctrl 20.1 PD p0.5
PD p1 PD p1.5 PD p2 PD m0.5 PD m1 PD m1.5 PD m2
19.6 18.9 18.4 17.8 20.6 21.4 22.1 22.6 LGM ctrl 27.5 LGM p0.5
LGM p1 LGM p1.5 LGM p2 LGM m0.5 LGM m1 LGM m1.5 LGM m2
CPD
7, 1235–1259, 2011Weakened atmospheric energy transport feedback in
cold glacial climates
I. Cvijanovic et al.
Title Page
Abstract Introduction
Conclusions References
Tables Figures
◭ ◮
◭ ◮
Back Close
Full Screen / Esc
Printer-friendly Version
Interactive Discussion
Discussion
P
a
per
|
Dis
cussion
P
a
per
|
Discussion
P
a
per
|
Discussio
n
P
a
per
|
Fig. 1. (a)Annual average sea surface temperature anomalies from ECBilt-CLIO experiments. Negative anomalies: dashed (0.5 K intervals), positive anomalies: solid (1 K intervals). Panels
(b)and(c) NH summer sea ice lines (−1.8◦C SST isotherms) for PD and LGM simulations,
CPD
7, 1235–1259, 2011Weakened atmospheric energy transport feedback in
cold glacial climates
I. Cvijanovic et al.
Title Page
Abstract Introduction
Conclusions References
Tables Figures
◭ ◮
◭ ◮
Back Close
Full Screen / Esc
Printer-friendly Version
Interactive Discussion
Discussion
P
a
per
|
Dis
cussion
P
a
per
|
Discussion
P
a
per
|
Discussio
n
P
a
per
Fig. 2. Atmospheric transport anomalies (PW) at the equator (a, b, c) and 30◦N (d, e, f)
for PD (full circles) and LGM (open circles) simulations as a function of NHTG anomaly (K). Positive/negative NHTG anomalies refer to NH cooling/warming. Linear regression coefficients
CPD
7, 1235–1259, 2011Weakened atmospheric energy transport feedback in
cold glacial climates
I. Cvijanovic et al.
Title Page
Abstract Introduction
Conclusions References
Tables Figures
◭ ◮
◭ ◮
Back Close
Full Screen / Esc
Printer-friendly Version
Interactive Discussion
Discussion
P
a
per
|
Dis
cussion
P
a
per
|
Discussion
P
a
per
|
Discussio
n
P
a
per
|
p05 p1 p15 p2
m2 m15 m1 m05
PD total PD dse PD latent
LGM latent LGM dse
LGM total
Fig. 3.Atmospheric transport anomalies: total (aandd), DSE (bande), latent (candf) for PD (upper plots) and LGM (lower plots) simulations. Black curves: NH cooling simulations (m2,
CPD
7, 1235–1259, 2011Weakened atmospheric energy transport feedback in
cold glacial climates
I. Cvijanovic et al.
Title Page
Abstract Introduction
Conclusions References
Tables Figures
◭ ◮
◭ ◮
Back Close
Full Screen / Esc
Printer-friendly Version
Interactive Discussion
Discussion
P
a
per
|
Dis
cussion
P
a
per
|
Discussion
P
a
per
|
Discussio
n
P
a
per
|
CPD
7, 1235–1259, 2011Weakened atmospheric energy transport feedback in
cold glacial climates
I. Cvijanovic et al.
Title Page
Abstract Introduction
Conclusions References
Tables Figures
◭ ◮
◭ ◮
Back Close
Full Screen / Esc
Printer-friendly Version
Interactive Discussion
Discussion
P
a
per
|
Dis
cussion
P
a
per
|
Discussion
P
a
per
|
Discussio
n
P
a
per
|
a b
c d
CPD
7, 1235–1259, 2011Weakened atmospheric energy transport feedback in
cold glacial climates
I. Cvijanovic et al.
Title Page
Abstract Introduction
Conclusions References
Tables Figures
◭ ◮
◭ ◮
Back Close
Full Screen / Esc
Printer-friendly Version
Interactive Discussion
Discussion
P
a
per
|
Dis
cussion
P
a
per
|
Discussion
P
a
per
|
Discussio
n
P
a
per