Soil and Plant Nutrition /Article
Losses and costs associated with water erosion
according to soil cover rate
Sonia Carmela Falci Dechen (1); Tiago Santos Telles (2*); Maria de Fátima Guimarães (3);
Isabella Clerice De Maria (1)
(1) Instituto Agronômico (IAC), Centro de Pesquisa e Desenvolvimento de Solos e Recursos Ambientais, Av. Barão de Itapura, 1.481,
13020-902 Campinas (SP), Brasil.
(2) Instituto Agronômico do Paraná (IAPAR), Área de Socioeconomia, Rodovia Celso Garcia Cid km 375,
86047-902 Londrina (PR), Brasil
(3) Universidade Estadual de Londrina (UEL), Departamento de Agronomia, Rodovia Celso Garcia Cid PR 445 km 380 s/n,
86057-970 Londrina (PR), Brasil. (*) Corresponding author: telles@iapar.br
Received: Oct. 14, 2014; Accepted: Feb. 5, 2015
Abstract
The aim of this study was to estimate water erosion costs associated with nutrient losses in four different rates of artificial cover. The experiment was carried out from 1987 to 1996 in runoff plots to measure soil losses in Campinas, State of Sao Paulo, in an Ferralsol under natural rainfall. The experimental design was completely randomized, with four treatments (0%, 24%, 40% and 90% artificial cover) and three replications. To estimate costs, P, K+, Ca2+ and Mg2+ concentrations in runoff water and
soil removed by erosion were summed up, converted into triple superphosphate, potassium chloride and dolomitic limestone and multiplied by their respective market prices. The results indicate that, under the experimental conditions, the greater the percentage of soil cover, the lower the losses of water, soil, organic matter and nutrients. The soil with 90% cover presented reduction of 51.97% in average water losses, 54.44 in soil losses and 54.91% in organic matter losses than the treatment with 0% cover. In bare soil, losses were estimated at 16% P2O5 and 8% KCl in terms of the amount of fertilizers recommended. Costs
varied from US$ 107.76 ha–1 year–1 in bare soil (0% cover) to US$ 18.15 ha–1 year–1 in soil with 90% cover. With these values,
losses were estimated at 616.5 million tons of soil per year for Brazil, as a result of soil erosion in annual crops, and cost of this process is around US$ 1.3 billion per year.
Key words: soil losses, water losses, nutrient losses, economic valuation, environmental valuation.
1. INTRODUCTION
Water erosion is one of the main forms of degradation of agricultural land in Brazil. It is a process of overland flow by runoff water, in which there is detachment, transport and deposition of soil particles, nutrients and organic matter (OM). The occurrence of erosion is determined, inter alia, by factors such as rainfall erosivity, soil erodibility and vegetation cover, and the soil cover is a major factor in controlling water erosion.
The main consequences of erosion are losses of water, soil, OM, nutrients and the costs generated (Pimentel et al., 1995; Telles et al., 2011; Telles et al., 2013a). The study of this phenomenon is of utmost importance, since freshwater is a scarce natural resource and that the gradual losses of soil can turn it into an unproductive land (Pimentel et al., 1995; Lal, 1998; Den Biggelaar et al., 2003a, b). In addition, spending on fertilizers, which represent between 20% and 41% of production costs in crops such as soybeans, corn
and wheat (Matson et al., 1998; Castro et al., 2006; Cavalett & Ortega, 2009; Souza et al., 2012), and the volume of inputs applied to a crop which can be washed out by rainwater, can pose significant economic losses with a substantial impact on costs and revenue of farmers. Besides that, there are costs of repairing damage caused by erosion in farms, such as working hours and machinery for replanting crops and maintenance of terraces.
studies have demonstrated the efficacy of conservation tillage associated with the use of crop residues on the soil in erosion control. These practices enable reductions of 50% to 100% in soil losses compared to conventional tillage – PC (Bertol et al., 1997; Bertol et al., 2007; Morais & Cogo, 2001). Among the most investigated conservation tillage practices, soil losses in no-tillage (PD), in general, is lower than in PC and in minimum tillage systems - PM - (Eltz et al., 1984a, b; Bertol et al., 2007; Pugliesi et al., 2011), given the higher percentage of soil cover and slighter disturbance of the soil. Systems with soil cover indices over 30% during cultivation and fallow periods are considered conservation systems (Lopes et al., 1987; Machado & Silva, 2001; Soane et al., 2012).
In Brazil, the association of physical losses caused by erosion with their economic aspects is not new (Telles et al., 2013b), but this approach was considered in a few studies (Marques et al., 1961; Sorrenson & Montoya, 1989; Martin et al., 1991; Marques, 1998; Rodrigues, 2005; Bertol et al., 2007; Sarcinelli et al., 2009; Dantas & Monteiro, 2010; Pugliesi et al., 2011; Andrade et al., 2011). Although these have addressed only the losses of nutrients in the production unit (on-site), representing a small portion of the total costs of soil erosion (Crosson, 1995), this information is important for farmers, researchers and
policy makers to form their opinions on the conservation management practices.
In this context, this study evaluated losses of water, soil, OM and nutrients, and estimated the costs of erosion according to four soil cover rates.
2. MATERIAL AND METHODS
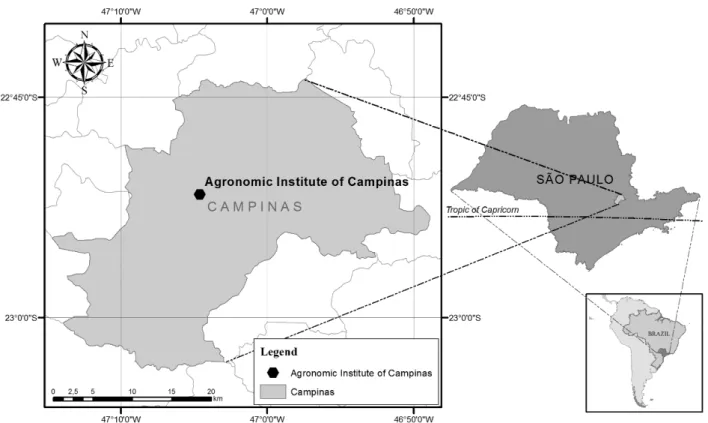
Study area
The experiment was conducted between 1987 and 1996, in the Experimental Center of the Agronomic Institute (IAC), Campinas, São Paulo State, Brazil (22°51’S and 47°4’W; 630 m altitude) figure 1, in a Ferralsol (classified according to Santos et al., 2006). According to the Köppen classification, the climate is Cwa, tropical of altitude, with dry winter and wet and hot summer. The average annual rainfall is 1,430 mm. The average temperature is 20.5°C (Setzer, 1966). The average annual erosivity is 6,738 mm ha–1 h–1year–1, with 62% of the annual erosion potential occurring from December to February (Lombardi & Moldenhauer, 1992). The history of the experimental area is described in Marques (1951), Marques et al. (1961) and Tengberg et al. (1997).
Evaluation of losses of soil, water and nutrients
The experimental design was completely randomized with four treatments and three replications. The treatments consisted of four soil cover rates: 0%, 24%, 40% and 90%. The treatment 0% coverage was kept fully bare. In the treatment with 24% cover, 2/5 of the plot was kept bare and 3/5 covered with 18% shading screen. In the other two treatments, 40% and 90% cover, we used 18% and 30% shading screens in the entire plot. The values of 40% and 90% are close to the values considered as soil cover with crop residues for conservation management and no-tillage system (SPD), respectively (Cline & Hendershot, 2006). The soil was kept without vegetation, manually weeded, so that the growth of weeds under the shading screen did not alter the coverage condition. In the year before the experiment onset, all plots were planted with sunnhep (Crotalaria juncea L.) without fertilizers. The draw of the treatments in the plots considered the history of the area, which consisted of cultivation of annual plants with and without crop rotation, so that the repetitions were distributed among the various previous uses. The experimental area received no fertilizer in the study period.
The plots were 100 m2, 25 m long and 4 m wide, with an average slope of 9%. The runoff collection system consists of two concrete tanks, separated by a Geib divider, in which 1/7 of the runoff is collected.
Table 1 shows the mean values of some physical and chemical soil properties, at the 0-0.20 m layer, in August 1987, before the start of the experiment. The analyses were performed on soil samples made up of three subsamples, using the procedures described by Quaggio & van Raij (1979) and van Raij et al. (2001) for chemical attributes and Camargo et al. (2009) for the texture fractions.
After each rainfall event, this study considered only rainfall with 40 mm or more, the storage tanks were drained to quantify losses of water and soil, following the procedure described by Bertoni (1949). Samples of soil transported by erosion were collected to determine the content of organic matter (OM), P, K+, Ca2+, Mg2+, Cu2+, Fe3+, Mn2+ and Zn2+; and samples of runoff water were taken to determine the concentrations of P, K+, Ca2+ and Mg2+. The OM content was determined by colorimetric method (Quaggio & van Raij, 1979). The concentrations of P, K+, Ca2+ and Mg2+ were
determined with ion exchange resin; the concentration of P by the colorimetric method, K+, by flame photometry, and Ca2+ and Mg2+, by atomic absorption spectrophotometry (van Raij et al., 2001). Concentrations of Cu2+, Fe3+, Mn2+ e Zn2+ were determined by ICP-OES after extraction by the DTPA method, at pH 7.3.
Estimating soil erosion costs
To estimate the costs of nutrient losses, based on the losses of P, K+, Ca2+ and Mg2+, their concentrations in the runoff water and soil transported by erosion were summed up and converted into commercial fertilizers. P was expressed as triple superphosphate (P2O5, 42%), K+ as potassium
chloride (KCl, 60%) and Ca2+ and Mg2+ as dolomitic
limestone [CaMg(CO3)2, 38%].
Prices paid by farmers for these fertilizers were obtained from the Institute of Agricultural Economics (IEA) in the State of São Paulo and the Department of Rural Economy (Deral), Secretariat of Agriculture and Supply of the Parana State. For calculation, we considered the prices in real currency paid in March 2011, converted into US dollars(4). The assumed value for the ton of triple superphosphate was US$ 682.84, for the potassium chloride, US$ 929.49, and for the dolomitic limestone, US$ 40.98.
The costs estimate was based on equation 1 (Telles et al., 2013b.):
m
i i i 1 C (Q P )
=
=
∑
(1)where: C is the soil erosion costs related to losses of the analyzed nutrients (P, K+, Ca2+ and Mg2+); Q
i is the amount of fertilizer lost by erosion; Pi the price per ton of different fertilizers; and m is the different fertilizers (in this case, triple superphosphate, potassium chloride and dolomitic limestone).
Statistical analysis
Annual data of losses of water, soil and nutrients and costs estimates on the basis of soil cover rates were subjected to analysis of variance and regression at 1% (p≤0.01) and 5% (p≤0.05) levels. Analyses were run with the Statistical Analysis System 9.3 (SAS©).
(4)Exchange Rate on March 3rd, 2011.
Table 1. Physical and chemical soil properties, in August 1987, before the start of the experiment, at the 0-0.20 m layer
Sand Silt Clay pH OM P Ca2+ Mg2+ K+ CEC V
(%) (CaCl2) (g dm
–3) (mg dm–3) (mmol
cdm
–3) (%)
34 9 57 5.3 37 7.5 38 16 2.5 89 65
3. RESULTS
Losses of soil, water and organic matter
The average annual loss of water, soil and OM caused by erosion between 1987 and 1996 showed a significant reduction according to the soil cover rates (0%, 24%, 40% and 90%), following a second order polynomial model (Table 2). Comparing the treatments with 0% and 90% cover, reductions were found in losses of water (51.97%), soil (54.44%) and OM (54.91%). Between the treatments with 0% and 40% cover, there was also a reduction in losses of water (8.36%), soil (8.23%) and OM (10.48%). Between the treatments with 0% and 24% cover, reductions in losses
of water, soil and OM were 3.08%, 8.95% and 11.38%, respectively.
Nutrient losses
In the runoff water, nutrient losses decreased linearly with increasing soil cover (Table 3). Comparing the bare soil (0% soil cover) with 90% cover, the latter showed lower
losses of P (84.11%), K+ (85.86%), Ca2+ (91.97%) and
Mg2+ (89.64%). In the soil with 0% cover in relation to the soil with 40%, lower losses were found for P (65.42%), K+ (73.79%), Ca2+ (83.83%) and Mg2+ (74.61%). In the soil with 0% cover compared to the soil with 24%, lower losses were observed for P (31.78%), K+ (35.52%) and increased
Table 2. Annual averages of losses of water, soil and organic matter by water erosion between 1987 and 1996, according to four different rates of soil cover
Cover Water Soil OM
(%) (mm year–1) (Mg ha–1 year–1) (kg ha–1 year–1)
0 170.74 27.59 685.96
24 165.48 25.12 607.88
40 156.46 25.32 614.05
90 82.00 12.57 309.31
Regression y = 169.48 + 1.83x - 0.157x2 y = 27.25 + 0.002x - 0.002x² y = 675.22 + 3.47x - 0.51x2
R2 0.70* 0.82* 0.84*
OM: organic matter. * p≤ 0.01.
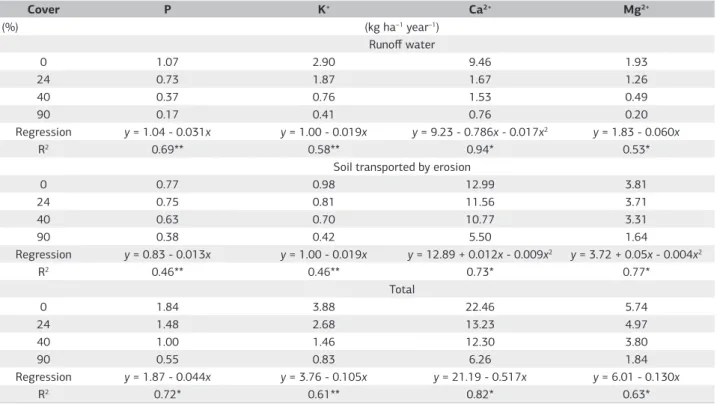
Table 3. Annual averages of losses of P, K+, Ca2+ and Mg2+ in the runoff water and soil transported by erosion between 1987 and 1996,
according to four different rates of soil cover
Cover P K+ Ca2+ Mg2+
(%) (kg ha–1 year–1)
Runoff water
0 1.07 2.90 9.46 1.93
24 0.73 1.87 1.67 1.26
40 0.37 0.76 1.53 0.49
90 0.17 0.41 0.76 0.20
Regression y = 1.04 - 0.031x y = 1.00 - 0.019x y = 9.23 - 0.786x - 0.017x2 y = 1.83 - 0.060x
R2 0.69** 0.58** 0.94* 0.53*
Soil transported by erosion
0 0.77 0.98 12.99 3.81
24 0.75 0.81 11.56 3.71
40 0.63 0.70 10.77 3.31
90 0.38 0.42 5.50 1.64
Regression y = 0.83 - 0.013x y = 1.00 - 0.019x y = 12.89 + 0.012x - 0.009x2 y = 3.72 + 0.05x - 0.004x2
R2 0.46** 0.46** 0.73* 0.77*
Total
0 1.84 3.88 22.46 5.74
24 1.48 2.68 13.23 4.97
40 1.00 1.46 12.30 3.80
90 0.55 0.83 6.26 1.84
Regression y = 1.87 - 0.044x y = 3.76 - 0.105x y = 21.19 - 0.517x y = 6.01 - 0.130x
R2 0.72* 0.61** 0.82* 0.63*
losses for Ca2+ (82.35%) and Mg2+ (34.72%). The total amounts of nutrients in runoff water were of the following order: Ca2+ > K+ > Mg2+ > P. This same sequence was observed by Hernani et al. (1999) who evaluated nutrient losses in an Oxisol of Dourados, Mato Grosso do Sul State, and by Silva et al. (2005), evaluating nutrient losses in an Oxisol of Lavras, Minas Gerais State.
Regarding the losses of nutrients in eroded sediments (Table 3), the reduction in relation to increasing soil cover was linear for P and K+, and polynomial for Ca2+ and Mg2+. Comparing the bare soil with the soil with 90% cover, the latter resulted in lower losses of P (50.65%), K+ (57.14%), Ca2+ (57.66%) and Mg2+ (55.80%). In turn, in the comparison of the soil with 0% cover to the soil with 40% cover, lower losses were found in the latter for P (18.18%), K+ (28.57%),
Ca²+ (17.09%) and Mg²+ (10.78%). When analyzing the
soil with 0% compared with the soil with 24% cover, the latter also showed minor losses of P (2.60%), K+ (17.35%), Ca2+ (11.01%) and Mg²+ (2.62%). The tendency of nutrient losses in eroded sediments was as follows: Ca2+ > Mg2+ > K+ > P.
In the case of total losses of P, K+, Ca2+ e Mg2+, in the comparison between the treatments 0% and 90%, the latter produced lower losses at 70.11%, 78.61%, 72.13% and 67.94%, respectively. Comparing the treatment 0% with 40%, losses of P, K+, Ca2+ and Mg2+ were, respectively, 45.65%, 62.37%, 45.24% and 33.80% lower. Finally, in the comparison of the treatment with 0% cover with the soil with 24% cover, losses of P, K+, Ca2+ and Mg2+ were 19.57%, 37.31%, 41.10% and 13.41%, respectively. The total losses of nutrients - the sum of the losses in runoff water and eroded sediments - followed the order: Ca2+ > Mg2+ > K+ > P.
In general, the average losses of Cu2+, Fe3+, Mn2+ and Zn2+ in the soil transported by erosion were also reduced due to the soil cover (Table 4). Comparing the soil with 90% cover with that with 0% (bare soil), the first had lower losses of Cu2+ (50%), Fe3+ (54.16%) and Mn2+ (63.89%). In the treatment 40% cover, compared with the soil with 0% cover, there were also minor losses of Cu2+ (18.75%), Fe3+ (4.17%) and Mn2+ (30.99%), and higher of Zn2+ (50%). In the soil with 24% cover, compared to the soil with 0%,
lower losses were registered for Cu 2+ (6.25%), Fe3+ (20.83%) and Mn2+ (8.95%), and higher for Zn2+ (50%).
The average losses and the total amounts of P, expressed as triple superphosphate (P2O5, 42%), of K+, as potassium chloride (KCl, 60%) and of Ca2+ and Mg2+, as dolomitic
limestone [CaMg (CO3)2, 38%], were reduced according
to the soil cover, for both the runoff water and the eroded sediments (Table 5).
Losses of P2O5 were lower in runoff water than in eroded sediments. In the runoff water, in the soil with 90% cover, losses of that element was reduced by 83.03% compared with bare soil (0% cover). For the treatments of 40% and 24% cover, compared to the soil with 0%, losses were reduced by 64.08% and 27.98%, respectively. In the eroded sediments, these losses were reduced by 53.21%, 18.29% and 3.56% for the treatments 90%, 40% and 24% soil cover, respectively, compared with bare soil (0% cover).
With respect to KCl, lower losses were also found in runoff water than in eroded sediments. Compared to the soil with 0% cover, losses in runoff of water were 86.12%, 74.41% and 36.96% lower for the treatments of 24%, 40% and 90% cover, respectively. In the same comparison, the losses in the eroded sediments were 57.79%, 29.65% and 18.59%.
As for CaMg(CO3)2, losses followed the same trend, i.e. in the runoff water, compared to soil with 0% cover were, 86.38% lower in the soil with 90%, 71.02% in that with 40% cover, and 56.66% in that with 24%. In eroded sediments, following the same comparison, the differences were 56.95%, 14.98% and 7.02, respectively.
On-site costs of soil erosion
Soil erosion costs associated with the loss of nutrients
in the form of triple superphosphate (P2O5, 42%),
potassium chloride (KCl, 60%) and dolomitic limestone [CaMg(CO3)2, 38%], in US$ ha–1 year–1, decreased with increasing soil cover rates (Table 6).
The highest costs were observed in soil with 0% cover, amounting to US$ 107.76 per ha–1 year–1 and showing a
Table 4. Annual averages of losses of Cu2+, Fe3+, Mn2+ and Zn2+ in the soil transported by water erosion between 1987 and 1996, according
to four different rates of soil cover
Cover Cu2+ Fe3+ Mn2+ Zn2+
(%) (kg ha–1year–1)
0 0.16 0.24 3.13 0.04
24 0.15 0.19 2.85 0.06
40 0.13 0.23 2.16 0.06
90 0.08 0.11 1.13 0.04
Regression y = 0.17 - 0.003x y = 0.25 - 0.004x y = 3.14 - 0.013x - 0.002x2 y = 0.05 + 0.003x - 9.15 . 10–5x2
R2 0.72** 0.65** 0.63* 0.76**
difference of US$ 36.09, US$ 72.38 and US$ 89.61 per ha–1 year–1, respectively, for the soils with 24%, 40% and 90% cover rates.
The costs associated with the loss of KCl were the largest ones, followed by P2O5 and CaMg(CO3)2. The cost generated by the loss of nutrients in the soil with 0% cover totaled US$ 107.76 ha–1 year–1. Of this amount, 37.75% correspond to P2O5, 53.26% to KCl and 8.99% to CaMg(CO3)2. In the soil with 24% cover, the cost was US$ 71.67 ha–1 year–1, and losses of P2O5, KCl and CaMg(CO3)2 corresponded respectively to 41.93%, 50.93% and 7.14% of this cost. In soil with 40% cover, the total cost was US$ 35.38 ha–1 year–1, and losses of P2O5, KCl and CaMg(CO3)2 contributed with 45.11%,
44, 01% and 10.88%, respectively, of this amount. In the soil with 90% cover, the total cost was US$ 18.15 ha–1 year–1, and losses of P2O5, KCl and CaMg(CO3)2 contributed, respectively, with 42.75%, 47% and 10.25% of the total.
4. DISCUSSION
According to Lopes et al. (1987), Machado and Silva (2001) and Soane et al. (2012), soil cover rates with plant residues at 30% or more, during cultivation and fallow periods, characterize conservation management systems, with the ability to control the rainfall erosivity. In SPD with
Table 5. Annual averages of losses of triple superphosphate (P2O5, 42%), potassium chloride (KCl, 60%) and dolomitic limestone [CaMg(CO3)2, 38%], in runoff water and eroded sediments, between 1987 and 1996, according to four different rates of soil cover
Cover P2O5 KCl CaMg(CO3)2
(%) (kg ha–1year–1)
Runoff water
0 5.54 5.98 26.88
24 3.99 3.77 11.65
40 1.99 1.53 7.79
90 0.94 0.83 3.66
Regression y = 54.72 - 1.597x y = 56.55 - 1.781x y = 236.49 - 7.562x
R2 0.41** 0.35** 0.36**
Soil transported by erosion
0 4.21 1.99 63.67
24 4.06 1.62 59.20
40 3.44 1.40 54.13
90 1.97 0.84 27.41
Regression y = 4.22 + 0.125x - 0.003x2 y = 2.02 - 0.038x y = 63.31 - 0.308x + 0.050x2
R2 0.53** 0.46** 0.76*
Total (runoff water + eroded sediments)
0 9.74 7.96 90.55
24 8.06 5.39 70.85
40 5.43 2.93 61.93
90 2.91 1.67 31.07
Regression y = 59.26 - 1.673x y = 58.57 - 1.819x y = 305.21 - 8.757x
R2 0.43** 0.36** 0.41**
* p≤ 0.01. * p≤ 0.05.
Table 6. Annual averages of soil erosion costs associated with losses of P, K+, Ca2+ and Mg2+, expressed in the form of triple superphosphate
(P2O5, 42%), potassium chloride (KCl, 60%) and dolomitic limestone [CaMg(CO3)2, 38%], in US$ ha–1year–1, between 1987 and 1996,
according to four different rates of soil cover
Cover P2O5 (42%) KCl (60%) CaMg(CO3)2 (38%) Total
(%) (US$ ha–1year–1)
0 40.68 57.39 9.69 107.76
24 30.05 36.50 5.12 71.67
40 15.96 15.57 3.85 35.38
90 7.76 8.53 1.86 18.15
Regression y = 40.47 - 1.143x y = 54.44 - 1.691x y = 8.89 - 0.255x y = 95.44 - 0.966x
R2 0.65** 0.60** 0.64** 0.62**
100% soil cover, Cassol & Lima (2003) and Cassol et al. (2004) observed losses of soil and water ten times lower when compared to the bare soil (0% cover). Bertol et al. (2007) found that the PD, due to the greater soil cover, promoted 57% reduction in water loss and 88% in soil loss, compared to the PC.
Studies comparing management systems demonstrated that, in general, water losses are less influenced by soil cover than soil losses, as shown by De Maria (1999). Results of water loss have not shown a pattern; higher water losses are observed either in the PC, PM or PD, or are similar between the different systems, given the influence of factors other than soil cover, such as changes in the structure and in water infiltration rate. In the present study, in which only soil cover influenced the losses, the increase in soil cover rate controlled the losses of both soil and water. This means that the soil cover favored the retention of soil particles and water in the production unit.
Many indicators of soil quality are closely related to the OM, such as aggregate stability (Tisdall & Oades, 1982), infiltration and retention of water in the soil, cation exchange capacity (CEC), nutrient availability to plants (Bronick & Lal, 2005), among others. In this context, losses of soil OM caused by erosion have a negative effect on the chemical, physical and biological soil properties, expressed mainly by reducing its fertility by reducing the productivity of the soil (Lal, 1998; Den Biggelaar et al., 2003a, b) and the vicious circle of accelerated erosion. Furthermore, soil erosion contributes to the release of CO2, which impacts negatively on climate change (Lal, 2004). The persistence of this process can lead agricultural activities, ultimately, to a situation of economic unsustainability, mainly because the farmer tries to make up for the loss of soil quality with a higher volume of inputs, which results in higher production costs - and the replacement of soil OM is not feasible in the short term. In this way, the attempt of economically valuing quality loss is risky, with high risk of estimation errors. Conservation management systems, such as PD, provide lower losses of soil OM (Hernani et al., 1999), and its benefits occur in the long term, depending on their dynamics.
Regarding the loss of macronutrients (P, K+, Ca2+ and Mg2+), the values were high (Table 3), especially P in runoff water, which can also result in eutrophication (Boardman & Poesen, 2006; Ekholm & Lehtoranta, 2012). However, soil cover was more effective in controlling losses of these nutrients in runoff water than in eroded sediments.
When considering the amount of fertilizer lost in relation to that applied by the farmers in annual crops, values were high (Table 5). For instance, the amount of fertilizer recommended by van Raij et al. (1996) to obtain yield of 6-8 t ha–1 of maize and 3-3.5 t ha–1 of soybean (70 kg ha–1 P
2O5 and 103 kg ha
–1 KCl), and comparing
these values to the results herein, it can be concluded that in the treatment without soil cover, the loss would
be 16% P2O5 and 8% KCl, and in the treatment with
90% cover, 5% P2O5 and 2% KCl. The difference between the treatments of 0% and 90% indicates a reduction in the loss of fertilizer, which allows farmers to choose to keep the cover on the soil - by planting cover crops or by crop rotation, like the SPD - guided by the economic rationality. Considering the amount of limestone customarily applied (≥ 2,000 kg ha-1), the losses observed in this study were proportionally low (90.55 kg ha–1).
Besides that, losses of micronutrients were very low (Table 4), so that there was no effect from the treatments of soil cover. Thus, to avoid underestimation errors, costs were not estimated.
The costs associated with the losses of P, K+, Ca2+ and Mg2+, expressed as P2O5 (42%), KCl (60%) and CaMg (CO3)2 (38%), in this study, were always lower the greater the soil cover rate. Losses of K+, in the form of KCl (60%), as well as in the study of Bertol et al. (2007), impacted most the on-site costs of soil erosion. In general, the results indicate that the higher the soil cover percentage, the lower the costs of erosion associated with total losses of nutrients, i.e., both in runoff water and in eroded sediments.
In Brazil, examples of this finding are reported in Bertol et al. (2007) and Pugliesi et al. (2011), who verified a reduction of losses generated by erosion in management systems with greater soil cover. In the first case (Bertol et al., 2007), the authors estimated the costs of soil erosion associated with nutrient losses, converted into triple superphosphate, potassium chloride and dolomitic limestone, in three management systems (PC, PM and PD) on a Cambisol. The values estimated in PC were 40.53% higher than in PD. In the second study (Pugliesi et al., 2011), the authors presented the costs related to loss of nutrients, expressed in the form of urea, simple superphosphate, potassium chloride and dolomitic limestone, on a Latosol, undulating relief, for different management systems. The estimates indicated that the costs in PC were 140% higher than in PD.
Moreover, both the losses and costs are annual, having a cumulative effect. When the soil is exposed for a long period to erosion, the volume of inputs necessary to return what is lost, in order to restore soil fertility to rates that ensure an adequate productivity, can be costly and even economically feasible. Therefore, maintenance of soil cover is essential to minimize the negative effects of erosion on agricultural lands.
With regard to debate on the importance of valuing the on-site costs of soil erosion considering the loss of nutrients (which is a small portion of the total cost), it can be said that although it is an underestimation of the real cost of erosion, the results generated are valid and of great importance, especially in developing countries, and mainly when those values are expanded to larger territorial units such as cities, states, country. In addition, there are few studies on this topic, and it is necessary and desirable to advance this line of research in Brazil.
For Brazil, for example, Bahia et al. (1992) estimated erosion losses in agricultural areas at 600 million tons of soil per year, amounting to US$ 1.5 billion according to nutrient losses. In turn, Hernani et al. (2002) estimated the losses at 820 million tons of soil per year, with a total cost of US$ 2.64 billion with losses of nutrients, which represented approximately 7% of Gross Domestic Product (GDP) of agriculture in 2000.
If we consider the estimates of soil losses and costs observed in this study, assuming the artificial soil cover of 24% as equivalent to PC, 40% to PM and 90% to SPD, and based on the numbers published by Llanillo et al. (2013) in relation to the area planted with annual crops by these tillage systems in Brazil(5)
2
, in 2006(6)
3
, it is possible to estimate losses of soil for the country at approximately 616.5 million of tons per year, with a total annual cost(7)
4
with the losses of P, K+, Ca2+ and Mg2+, expressed as P 2O5
(42%), KCl (60%) and CaMg(CO3)2 (38%), of around
US$ 1.3 billion(8
5
). The difference of these values from those
presented by Bahia et al. (1992) and Hernani et al. (2002) is that these authors considered, beyond the areas of annual crops, those areas used with pastures and perennial crops, totaling a larger area than that considered in this study.
From the differences obtained between the different cover rates, considering the possibility that the whole area of annual crops in Brazil were grown under PD, estimation of soil losses for the country would be about 420.3 million tons per year, with a total annual cost of the losses of P, K+, Ca2+ and Mg2+, expressed as P
2O5 (42%), KCl (60%) and
CaMg(CO3)2 (38%), at US$ 603.6 million.
From the farmer point of view, losses and costs are barely noticeable, but, considering the whole Brazilian agriculture, the values are high and justify the importance of using soil cover, among other factors
(5) This information is for the 2006 Agricultural Census, by the Brazilian Institute of Geography and Statistics – IBGE (Llanillo et al., 2013).
(6) PC: 11,784.213 ha; PM: 3,783.494 ha; SPD: 17,871.773 ha.
(7) These estimates consider only the monetary amounts that would have been paid by farmers for the lost nutrients and do not consider broadly replacement costs, because there is no analysis of the amount required to replenish in terms of nutrients to restore soil fertility in order to achieve maximum yield.
(8) In dollars on March 3rd, 2011.
5. CONCLUSION
Comparing to the bare soil (0% cover), the soil with 90% cover reduced the average losses of water, soil and OM by 51.97%, 54.44%, and 54.89%, respectively.
The highest soil cover percentage resulted in lower costs associated with losses of water, soil and nutrients by erosion.
Soil erosion costs associated with the loss of fertilizers for the rates of 0%, 24%, 40% and 90% soil cover were, respectively, US$ 107.76, US$ 71.67, US$ 35.38 and US$ 18.15 per ha–1 year–1.
As to bare soil, losses were estimated at 16% for P2O5 and 8% for KCl in relation to the recommended amount of fertilizer.
Based on the presented results, it is estimated that soil erosion costs related to losses of P, K+, Ca2+ and Mg2+, in annual crops in Brazil, would be around US$ 1.3 billion a year.
ACKNOWLEDGEMENTS
The authors are grateful to CNPq for scholarships and financial support (CNPq Process 562.453/2010-5) which enabled the research.
REFERENCES
Andrade, N. S. F., Martins, M. V., Fo., Torres, J. L. R., Pereira, G. T., & Marques, J. Jr. (2011). Impacto técnico e econômico das perdas de solo e nutrientes por erosão no cultivo da cana-de-açúcar. Engenharia Agrícola, 31, 539-550. http://dx.doi.org/10.1590/S0100-69162011000300014.
Bahia, V. G., Curi, N., Carmo, D. N., & Marques, J. J. G. S. M. (1992). Fundamentos de erosão do solo: tipos, formas, mecanismos, fatores determinantes e controle. Informe Agropecuário, 16, 25-31.
Bertol, I., Cogo, N. P., & Levien, R. (1997). Erosão hídrica em diferentes preparos do solo logo após as colheitas de milho e trigo, na presença e na ausência dos resíduos culturais. Revista Brasileira de Ciência do Solo, 21, 409-418. http://dx.doi.org/10.1590/S0100-06831997000300009.
Bertol, I., Cogo, N. P., Schick, J., Gudagnin, J. C., & Amaral, A. J. (2007). Aspectos financeiros relacionados às perdas de nutrientes por erosão hídrica em diferentes sistemas de manejo do solo. Revista Brasileira de Ciencia do Solo, 31, 133-142. http://dx.doi.org/10.1590/ S0100-06832007000100014.
Bertoni, J. (1949). Sistemas coletores para determinação de perdas por erosão. Bragantia, 9, 147-155. http://dx.doi.org/10.1590/S0006-87051949000200005.
Europe (p. 775-789). Chichester: John Wiley & Sons. http://dx.doi. org/10.1002/0470859202.
Bronick, C. J., & Lal, R. (2005). Soil structure and management: a review. Geoderma, 124, 3-22. http://dx.doi.org/10.1016/j. geoderma.2004.03.005.
Camargo, O. A., Moniz, A. C., Jorge, J. A., & Valadares, J. M. A. S. (2009). Métodos de análise química e física de solos do Instituto Agronômico de Campinas (Boletim Técnico, 106). Campinas: Instituto Agronômico. 77 p.
Cassol, E. A., & Lima, V. S. (2003). Erosão em entressulcos sob diferentes tipos de preparo e manejo do solo. Pesquisa Agropecuaria Brasileira, 38, 117-124. http://dx.doi.org/10.1590/S0100-204X2003000100016.
Cassol, E. A., Cantalice, J. R. B., Reichert, J. M., & Mondardo, A. (2004). Escoamento superficial e desagregação do solo em entressulcos em solo franco-argilo-arenoso com resíduos vegetais. Pesquisa Agropecuaria Brasileira, 39, 685-690. http://dx.doi.org/10.1590/ S0100-204X2004000700010.
Castro, S. H., Reis, R. P., & Lima, A. L. R. (2006). Custos de produção da soja cultivada sob sistema de plantio direto: estudo de multicasos no oeste da Bahia. Ciência e Agrotecnologia, 30, 1146-1153. http:// dx.doi.org/10.1590/S1413-70542006000600017.
Cavalett, O., & Ortega, E. (2009). Emergy, nutrients balance, and economic assessment of soybean production and industrialization in Brazil. Journal of Cleaner Production, 17, 762-771. http://dx.doi. org/10.1016/j.jclepro.2008.11.022.
Cline, J., & Hendershot, R. (2006). Conservation tillage. In R. Lal (Ed.), Encyclopedia of soil science (Vol. 1, p. 331-334). Boca Raton: CRC Press.
Crosson, P. (1995). Soil erosion estimates and costs. Science, 269, 461-464. http://dx.doi.org/10.1126/science.269.5223.461. PMid:17842347
Dantas, K. P., & Monteiro, M. S. L. (2010). Valoração econômica dos efeitos internos da erosão: impactos da produção de soja no cerrado piauiense. Revista de Economia e Sociologia Rural, 48, 619-633. http://dx.doi.org/10.1590/S0103-20032010000400006.
De Maria, I. C. (1999). Erosão e terraços em plantio direto. Boletim Informativo da Sociedade Brasileira de Ciência do Solo, 24, 17-22.
Den Biggelaar, C., Lal, R., Wiebe, K., & Breneman, V. (2003a). The global impact of soil erosion on productivity. I: Absolute and relative erosion-induced yield losses. Advances in Agronomy, 81, 1-48. http:// dx.doi.org/10.1016/S0065-2113(03)81001-5.
Den Biggelaar, C., Lal, R., Wiebe, K., Eswaran, H., Breneman, V., & Reich, P. (2003b). The global impact of soil erosion on productivity. II: Effects on crop yields and production over time. Advances in Agronomy, 81, 49-95. http://dx.doi.org/10.1016/S0065-2113(03)81002-7.
Ekholm, P., & Lehtoranta, J. (2012). Does control of soil erosion inhibit aquatic eutrophication? Journal of Environmental Management, 93, 140-146. http://dx.doi.org/10.1016/j.jenvman.2011.09.010. PMid:22054580
Eltz, F. L. F., Cassol, E. A., Guerra, M., & Abrão, P. U. R. (1984a). Perdas de solo e água por erosão em diferentes sistemas de manejo e coberturas vegetais em solo São Pedro (Podzólico Vermelho-Amarelo) sob chuva natural. Revista Brasileira de Ciência do Solo, 8, 245-249.
Eltz, F. L. F., Cassol, E. A., Scopel, I., & Guerra, M. (1984b). Perdas de solo e água por erosão em diferentes sistemas de manejo e coberturas vegetais em solo Laterítico Bruno-Avermelhado distrófico (São Jerônimo) sob chuva natural. Revista Brasileira de Ciência do Solo, 8, 117-125.
Hernani, L. C., Freitas, P. L., Pruski, F. F., De Maria, I. C., Castro, C., Fo., & Landers, J. N. (2002). A erosão e seu impacto. In C. V. Manzatto, E. Freitas Jr., & J. R. R. Peres (Eds.), Uso agrícola dos solos brasileiros (p. 47-60). Rio de Janeiro: Embrapa Solos.
Hernani, L. C., Kurihara, C. H., & Silva, W. M. (1999). Sistemas de manejo de solo e perdas de nutrientes e matéria orgânica por erosão. Revista Brasileira de Ciencia do Solo, 23, 145-154. http://dx.doi. org/10.1590/S0100-06831999000100018.
Lal, R. (1998). Soil erosion impact on agronomic productivity and environment quality. Critical Reviews in Plant Sciences, 17, 319-464. http://dx.doi.org/10.1016/S0735-2689(98)00363-3.
Lal, R. (2004). Soil carbon sequestration to mitigate climate change. Geoderma, 123, 1-22. http://dx.doi.org/10.1016/j.geoderma.2004.01.032.
Llanillo, R. F., Telles, T. S., Soares, Jr., D., & Pelinni, T. (2013). Tillage systems on annual crops in Brazil: Figures from the 2006 Agricultural Census. Semina: Ciências Agrárias, 34, 3691-3698. http://dx.doi. org/10.5433/1679-0359.2013v34n6Supl1p3691.
Lombardi, F., No., & Moldenhauer, W. C. (1992). Erosividade da chuva: sua distribuição e relação com as perdas de solo em Campinas (SP). Bragantia, 51, 189-196. http://dx.doi.org/10.1590/S0006-87051992000200009.
Lopes, P. R., Cogo, N. P., & Levien, R. (1987). Eficácia relativa de tipo e quantidade de resíduos culturais espalhados uniformemente sobre o solo na redução da erosão hídrica. Revista Brasileira de Ciência do Solo, 11, 71-75.
Machado, P. L. O. A., & Silva, C. A. (2001). Soil management under no-tillage systems in the tropics with special reference to Brazil. Nutrient Cycling in Agroecosystems, 61, 119-130. http://dx.doi. org/10.1023/A:1013331805519.
Marques, J. F. (1998). Custos da erosão do solo em razão dos seus efeitos internos e externos à área de produção agrícola. Revista de Economia e Sociologia Rural, 36, 61-79.
Marques, J. Q. A. (1951). Determinação de perdas por erosão. Archivo Fitotécnico del Uruguay, 4, 505-556.
Marques, J. Q. A., Bertoni, J., & Barreto, G. B. (1961). Perdas por erosão no estado de São Paulo. Bragantia, 20, 1143-1182. http:// dx.doi.org/10.1590/S0006-87051961000100047.
Martin, N. B., Matsunaga, M., Veiga, A. A., Fo., Donzelli, P. L., Salvio, J., No., Bertollini, D., Lombardi, F., No., Weill, M. A. M., Pedro, M. J., Jr., Berton, R. S., Oliveira, J. B., Carvalho, Y. C., Gatti, E. V., & Vieira, J. L. T. M. (1991). Economia agrícola paulista: características e potencialidades. Informações Econômicas, 21, 1-201.
Meyer, L. D., Wischmeier, W. H., & Foster, G. R. (1970). Mulches rate required for erosion control on steeps slopes. Soil Science Society of America Proceedings, 34, 928-931. http://dx.doi.org/10.2136/sss aj1970.03615995003400060031x.
Morais, L. F. B., & Cogo, N. P. (2001). Comprimentos críticos de rampa para diferentes manejos de resíduos culturais em sistema de semeadura direta em um Argissolo Vermelho da Depressão Central (RS). Revista Brasileira de Ciência do Solo, 25, 1041-1051. http:// dx.doi.org/10.1590/S0100-06832001000400026
Pimentel, D., Harvey, C., Resosudarmo, P., Sinclair, K., Kurz, D., McNair, M., Crist, S., Shpritz, L., Fitton, L., Saffouri, R., & Blair, R. (1995). Environmental and economic costs of soil erosion and conservation benefits. Science, 267, 1117-1123. http://dx.doi. org/10.1126/science.267.5201.1117. PMid:17789193
Pugliesi, A. C. V., Marinho, M. A., Marques, J. F., & Lucarelli, J. R. F. (2011). Valoração econômica do efeito da erosão em sistemas de manejo do solo empregando o método custo de reposição. Bragantia, 70, 113-121. http://dx.doi.org/10.1590/S0006-87052011000100017.
Quaggio, J. A., & van Raij, B. (1979). Comparação de métodos rápidos para a determinação da matéria orgânica em solos. Revista Brasileira de Ciencia do Solo, 3, 184-187.
Rodrigues, W. (2005). Valoração econômica dos impactos ambientais de tecnologias de plantio em região de cerrados. Revista de Economia e Sociologia Rural, 43, 135-153. http://dx.doi.org/10.1590/S0103-20032005000100008.
Santos, H. G., Jacomine, P. K. T., Anjos, L. H. C., Oliveira, V. A., Oliveira, J. B., Coelho, M. R., Lumbreras, J. F., & Cunha, T. J. F. (Eds.). (2006). Sistema brasileiro de classificação de solos. (2 ed.). Rio de Janeiro: Embrapa Solos.
Sarcinelli, O., Marques, J. F., & Romeiro, A. R. (2009). Custos e benefícios da adoção de práticas e medidas para conservação do solo agrícola: um estudo de caso na microbacia hidrográfica do córrego Oriçandinha. Informações Econômicas, 39, 5-16.
Setzer, J. (1966). Atlas climático e ecológico do estado de São Paulo. São Paulo: Comissão Interestadual da Bacia Paraná-Uruguai.
Silva, A. M., Silva, M. L. N., Curi, N., Lima, J. M., Avanzi, J. C., & Ferreira, M. M. (2005). Perdas de solo, água, nutrientes e carbono orgânico em Cambissolo e Latossolo sob chuva natural. Pesquisa
Agropecuaria Brasileira, 40, 1223-1230. http://dx.doi.org/10.1590/ S0100-204X2005001200010.
Soane, B. D., Ball, B. C., Arvidsson, J., Basch, G., Moreno, F., & Roger-Estrade, J. (2012). No-till in northern, western and south-western Europe: a review of problems and opportunities for crop production and the environment. Soil & Tillage Research, 118, 66-87. http:// dx.doi.org/10.1016/j.still.2011.10.015.
Sorrenson, W. J., & Montoya, L. J. (1989). Implicações econômicas da erosão do solo e do uso de algumas práticas conservacionistas no Paraná (Boletim Técnico, 21). Londrina: Iapar.
Souza, J. A., Buzetti, S., Tarsitano, M. A. A., & Valderrama, M. (2012). Lucratividade do milho em razão das fontes, doses e épocas de aplicação de nitrogênio. Revista Ceres, 59, 321-329. http://dx.doi. org/10.1590/S0034-737X2012000300005.
Telles, T. S., Dechen, S. C. F., & Guimarães, M. F. (2013a). Institutional landmarks in Brazilian research on soil erosion: a historical overview. Revista Brasileira de Ciência do Solo, 37, 1431-1440. http://dx.doi. org/10.1590/S0100-06832013000600001.
Telles, T. S., Dechen, S. C. F., Souza, L. G. A., & Guimaraes, M. F. (2013b). Valuation and assessment of soil erosion costs. Scientia Agricola, 70, 209-216. http://dx.doi.org/10.1590/S0103-90162013000300010.
Telles, T. S., Guimarães, M. F., & Dechen, S. C. F. (2011). The costs of soil erosion. Revista Brasileira de Ciencia do Solo, 35, 287-298. http://dx.doi.org/10.1590/S0100-06832011000200001.
Tengberg, A., Stocking, M., & Dechen, S. C. F. (1997). The impact of erosion on soil productivity: an experimental design applied in São Paulo State, Brazil. Geografiska Annaler. Series A. Physical Geography, 79, 95-107. http://dx.doi.org/10.1111/j.0435-3676.1997.00009.x.
Tisdall, J. M., & Oades, J. M. (1982). Organic matter and water-stable aggregates in soils. Journal of Soil Science, 33, 141-163. http:// dx.doi.org/10.1111/j.1365-2389.1982.tb01755.x.
van Raij, B., Andrade, J. C., Cantarella, H., & Quaggio, J. A. (Eds.). (2001). Análise química para avaliação da fertilidade de solos tropicais. Campinas: Instituto Agronômico. 284 p.


![Table 6. Annual averages of soil erosion costs associated with losses of P, K + , Ca 2+ and Mg 2+ , expressed in the form of triple superphosphate (P 2 O 5 , 42%), potassium chloride (KCl, 60%) and dolomitic limestone [CaMg(CO 3 ) 2 , 38%], in US$ ha –1](https://thumb-eu.123doks.com/thumbv2/123dok_br/15962701.684847/6.892.104.827.118.526/averages-associated-expressed-superphosphate-potassium-chloride-dolomitic-limestone.webp)
