AND JACK BEANS INTERCROPPED AND MONOCULTURES
Perdas de solo por erosão hídrica no cultivo do milho e feijão-de-porco consorciados e em monocultivos
Pedro Luiz Terra Lima1, Marx Leandro Naves Silva2, Nilton Curi2, John Quinton3
ABSTRACT
Adequate soil management can create favorable conditions to reduce erosion and water runoff, consequently increase water soil recharge. Among management systems intercropping is highly used, especially for medium and small farmers. It is a system where two or more crops with different architectures and vegetative cycles are explored simultaneously at the same location. This research investigated the effects of maize intercropped with jack bean on soil losses due to water erosion, estimate C factor of Universal Soil Losses Equation (USLE) and how it can be affected by soil coverage. The results obtained also contribute to database generation, important to model and estimate soil erosion. Total soil loss by erosion caused by natural rain, at Lavras, Minas Gerais, Brazil, were: 4.20, 1.86, 1.38 and 1.14 Mg ha-1, respectively, for bare soil, maize, jack bean and the intercropping
of both species, during evaluated period. Values of C factor of USLE were: 0.039, 0.054 and 0.077 Mg ha Mg-1 ha-1 for maize,
jack bean and intercropping between both crops, respectively. Maize presented lower vegetation cover index, followed by jack beans and consortium of the studied species. Intercropping between species showed greater potential on soil erosion control, since its cultivation resulted in lower soil losses than single crops cultivation, and this aspect is really important for small and medium farmers in the studied region.
Index terms: Cover plants, C factor, soil sustainability.
RESUMO
O manejo adequado do solo pode criar condições favoráveis para reduzir a erosão hídrica e escoamento superficial, e,
consequentemente, aumentar a recarga de água no solo. Entre os sistemas de manejo, o consórcio de culturas é um sistema de manejo muita utilizado, principalmente por médios e pequenos agricultores. Trata-se de um sistema onde duas ou mais culturas com diferentes ciclos e arquiteturas vegetativas são exploradas concomitantemente, no mesmo local. Portanto, objetivou-se neste trabalho, avaliar os efeitos do consórcio entre a cultura do milho e o feijão-de-porco nas perdas de solo por erosão hídrica, a determinação do fator C da Equação Universal de Perda de Solo (EUPS) e do índice de cobertura para os sistemas de cultivos estudados. Pode-se concluir que as perdas de solo totais por erosão hídrica sob chuva natural, no município de Lavras, MG, foram de 4,20, 1,86, 1,38 e 1,14 Mg ha-1, respectivamente, para o solo descoberto, milho, feijão-de-porco e o consórcio entre as duas espécies, durante o período
avaliado. Os valores de fator C da EUPS calculados para os diferentes sistemas de cultivos foram 0,039, 0,054 e 0,077 Mg ha Mg-1
ha-1 para o milho, feijão-de-porco e o consórcio entre as duas espécies, respectivamente. O plantio do milho solteiro apresentou
menor índice de cobertura vegetal, seguido do cultivo de feijão-de-porco solteiro e do consórcio entre as duas espécies vegetais. O consórcio entre as espécies apresentou maior potencial no controle de processos erosivos, uma vez que seu cultivo resulta em menores perdas de solo, quando se comparado ao cultivo solteiro das espécies estudadas, este aspecto é de grande importância para os pequenos e médios agricultores da região de estudo.
Termos para indexação: Plantas de cobertura, fator C, sustentabilidade do solo.
1Lancaster University – Lancaster Environment Center/LEC – Lancaster – United Kingdom – [email protected] 2Universidade Federal de Lavras/UFLA – Departamento de Ciência do Solo/DCS – Lavras – MG – Brasil 3Lancaster University – Lancaster Environment Center – Lancaster – United Kingdom
Received in september 9, 2013 and approved in november 29, 2013
INTRODUCTION
Comprehension of all processes involved in soil erosion is very important to reach sustainability of this natural resource. It can be obtained from a combination of
field experiments and observations in long and short time ranges since the phenomenon can be adequately quantified,
understood and even simulated (Brazier, 2004; Bilotta; Grove; Mudd, 2012).
conditions as well as protect against rain drop impacts (Freitas et al., 2012) and erosion (Dias et al. 2013), turning into important conservation practices at sustainable agricultural production systems (Castro et al., 2011; Cardoso et al., 2012; Chieza et al. 2013).
Research projects carried out by Carvalho et al. (2007) allowed to conclude that in very dense coffee cultivation, where weeds were maintained at acceptable
height by mowing, the soil was more efficiently protected
against soil losses and water runoff when compared to manually weeding, condition in which weeds are completely removed. Alternatively, when herbicide was used, an intermediate result was obtained. Bertol
and Miquelluti (1993) also verified a higher soil surface
protection on soil cultivated with maize then on bare soil conditions.
Among several combinations, systems that employ maize with soil cover plants were more effective to control water erosion, reducing both soil, water, and organic matter losses, as well as improvement of soil physical parameters (Debarba; Amado, 1997; Gilles et al., 2009; Rossetti et al. 2012, Dias et al. 2013).
Research investigations on soil and water losses due to raindrop direct impact traditionally employ, standard plots, a proposed by Wischmeier and Smith (1978), developed to monitor erosion in different tillage systems using 10,000 plots spread all over United States and it allowed the development o f t h e U n i v e r s a l S o i l L o s s E q u a t i o n – U S L E (Wischmeier; Smith, 1978). This model integrates five parameters as follows: A = R x K x LS x C x P , where A refers to soil losses, R is the rainfall erosivity index, K is the soil erodibility, LS is the length slope factor, C is the cover factor and P is the conservation practice factor.
USLE parameters for different conditions of soil tillage and soil classes are reviewed on literature such as Beutler et al., 2003; Cogo, Leviens and Schwarz, 2003; Mello et al., 2003; Prochnow et al., 2005; Marques et al., 2007; Vaezi et al., 2008; Ferreira et al., 2010; Castro et al., 2011; Cardoso et al., 2012; Dias et al., 2013.
However, such studies are relatively scarce in Brazil, especially in conditions of natural rainfall, which highlights the importance of obtaining a reliable database for different conditions available in Brazil, with the purpose of modeling soil erosion for large areas such as sub-basins. This approach is still rare in Brazil, thus, a soil loss database is important in order to model erosion in watersheds, specially the determination of the C factor.
C factor of USLE represents soil crop coverage, becoming very important to predict average soil loss potential caused by water (Schönbrodt et al., 2010). Its determination is time consuming and research reports on this subject are not frequent in Brazil and South America. Relation between intense erosive rains and different soil management and plants used to protect soil varies from region to region, which reinforces great importance of reliable databases that can allow modeling of soil losses. As example, Cogo, Moldenhauer and Foster (1983) and also Stocking (1988), investigating soil coverage and erosion, proposed mathematical relations between the C factor and soil coverage index. Considering that soil loss data at Minas Gerais state are relatively rare, especially involving Ultisols under natural rainfall on standard soil erosion plots, research efforts such as the present one, aiming to measure soil and water losses, as well as nutrients and organic carbon are very important to plan soil use and management on sustainable bases.
Therefore, the objective of this research was to evaluate the effects of intercropping between maize and jack beans on soil losses as well to determine the C factor and the coverage index.
MATERIAL AND METHODS
The experiment was carried out at the Federal University of Lavras (UFLA), in Lavras, Minas Gerais State, Brazil, at coordinates 21º13’20’’ S and 44º58’17’’ W and average altitude of 925 meters, from November
2011 to March 2012. The climate is classified as Cwa,
according to Koppen classification system (Brasil, 1992), with average annual rainfall of 1529.7 mm and average temperature of 19.4º C. The soil was classified as Red-Yellow Argisol according to Empresa Brasileira de Pesquisa Agropecuária-EMBRAPA (2013), which corresponds to Ultisols in US Soil Taxonomy. The slope of the area is 12%.
Seeds were spread in November 2011, 0.70 m each row apart, when single crop was tested, and 0.35 m when intercropped every other row. Crop rows were established perpendicularly to the slope. The crop system tested can be used by small and medium farm properties at South region of Minas Gerais state for human and animal supply.
Historical use of the experimental area prior to 2007 consisted of pastures with Brachiaria decumbens (Freitas et al., 2012), and the research area has been previously used to investigated several other soil cover crops such as: sun hemp (Crotalaria juncea L.), jack beans (Canavalia ensiformis DC.) and millet (Pennisetum sp Rich.) from 2007 to 2008 (Cardoso et al., 2012); pigeon pea legumes (Cajanus cajan (L.) Huth), sun hemp, jack beans and millet from 2008 to 2009 (Castro et al., 2011); and pigeon pea legumes, jack beans and millet, cultivated under different planting systems, from 2010 to 2011 (Freitas et al., 2012). These research projects, together with this investigation, will be very important to make up a database to evaluate soil erosion under tropical conditions.
Time periods were established as function of soil coverage (Wischmeier; Smith, 1978; de Maria; Lombardi Neto, 1997; Souza et al., 2010) as: seedling to post planting (A1 - 0 to 10, A2 - 10 to 20, e A3 - 20 to 35 days after seedling (DAS), respectively); crop establishment (B - 35 to 60 DAS); crop development (C - 60 to 80 DAS); maturation (D - 80 to 100 DAS); and post harvested (E - 100 to 130 DAS).
For soil characterization, samples were sieved through 2 mm sieve and then submitted to analysis which results can be seen in table 1.
Manually weeding was carried before planting and all residues from previous crops were removed. Fertilizers were applied, equivalent to 500 kg ha-1of NPK8:28:16, and
a topdressing fertilization of 400 kg ha-1 NPK 20:00:20. At
130 DAS, all plants were mowed and crop residues were left at soil surface.
Soil and water losses were evaluated at four standard plots according to Wischmeier and Smith (1978); plots were 4.0 m wide by 22.1 m long, being the length along the slope. All plots were limited by a galvanized zinc metal plate, inserted 20 cm into the soil and 20 cm left over the soil surface. At each plot lower side, an outlet was set to deliver soil and water into two 250 liter reservoirs connected to each other by a GEIB divisor, with 9 entrance windows, such that after the
first reservoir was completely filled, one ninth of runoff
was carried to the second reservoir, such as described by Aquino et al. (2012).
Soil losses were quantified after each erosive rain
according to the method described by Cogo, Leviens and Schwarz (2003). After solid suspension was shaken, three aliquots were separated and transferred to laboratory for decantation. The settled material was then oven dried at 105º C, for 24 hours, and the dry weight determined to quantify erosion.
Rain erosivity (factor R – EI30) was calculated from continuous monitoring of rain events, from November 2011 to March 2012, at the main weather station of Lavras, 5th Meteorological District, located at
UFLA campus. Rains with 10 mm were recorded with
tolerance of 0.2 mm, registered 24 hours daily every five
minutes. After manually quantifying the more uniform rain intensity, total kinetic energy was determined for each rain event according to the equation proposed by Wischmeier and Smith (1958) and Foster et al. (1981). This research considered individual rains those separated by more than 6 hours with rains less than 1 mm. Rain events with less than 10 mm long for 15 minutes but with intensity less than 24 mm h-1, or even kinetic energy less
than 3.6 MJ, were all considered as non-erosive ones (De Maria, 1994).
The equation used to calculate kinetic energy was proposed by Wischmeier and Smith (1958), adapted for international units by Foster et al. (1981) as:
E = 0.119+0.0873 log I, (1)
where E is the kinetic energy (MJ ha-1 mm-1) and I is the
rain intensity (mm h-1).
Kinetic energy value multiplied by precipitation occurred at rain events resulted in the kinetic energy expressed as MJ ha-1. Values obtained were accumulated
to obtain the total Kinetic energy for a given rain. The EI30 index was obtained by multiplying the
total kinetic energy by the maximum intensity verified for
a 30 min period (I30), accordingly to the method proposed by Wischmeier and Smith (1958). By adding the values for each rain, it was possible to obtain the total rain for each month.
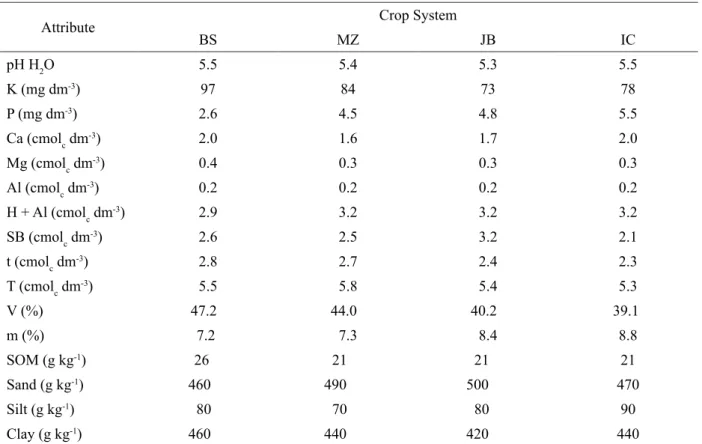
Table 1 – Chemical and physical soil attributes for different crop systems in Lavras, MG.
Attribute Crop System
BS MZ JB IC
pH H2O 5.5 5.4 5.3 5.5
K (mg dm-3) 97 84 73 78
P (mg dm-3) 2.6 4.5 4.8 5.5
Ca (cmolc dm-3) 2.0 1.6 1.7 2.0
Mg (cmolc dm-3) 0.4 0.3 0.3 0.3
Al (cmolc dm-3) 0.2 0.2 0.2 0.2
H + Al (cmolc dm-3) 2.9 3.2 3.2 3.2
SB (cmolc dm-3) 2.6 2.5 3.2 2.1
t (cmolc dm-3) 2.8 2.7 2.4 2.3
T (cmolc dm-3) 5.5 5.8 5.4 5.3
V (%) 47.2 44.0 40.2 39.1
m (%) 7.2 7.3 8.4 8.8
SOM (g kg-1) 26 21 21 21
Sand (g kg-1) 460 490 500 470
Silt (g kg-1) 80 70 80 90
Clay (g kg-1) 460 440 420 440
SB: sum of exchangeable bases; t: effective cation exchange capacity; T: potential cation exchange capacity; V: base saturation; m: aluminum saturation; SOM: soil organic matter; BS: bare soil; MZ: maize only; JB: jack beans only; IC: maize intercropped with jack beans.
where i is the maize growth stage, SLR is soil loss ratio (Mg ha Mg-1 ha-1), SLm is soil loss at plot m and SLb is
soil loss at bare soil plot.
FEI30 was calculated by dividing the EI30 value for each crop stage and the total EI30, for each period. The C factor for USLE, for each stage, was calculated by multiplying the SLR times FEI30 for each stage. The mean C factor values were used to obtain C values according to De Maria and Lombardi Neto (1997):
Determination of soil cover index (SCI) was obtained according to the methodology proposed by Stocking (1988), by random readings across crop rows, with three replications for each plot. Readings were
obtained with an apparatus containing 19 circle orifices of
9 mm diameter each, spaced 10 cm apart each other, along a two meters rod placed 1.20 meters above soil surface. Zero value was attributed for bare soil, 0.5 for any crop coverage detected inside the circle, and 1.0 when the circle was fully covered by crop leaves.
The soil cover index was calculated as:
SLR= SLm SLb i=1 7
i=1 7
∑
∑
SCI(%) number of vegetable cover readings total number of r
=
eeadings
where C is USLE C factor (Mg ha Mg-1 ha-1), R
i is erosivity
at growth stage i and R is the annual erosivity.
(3) SCI measurements started 10 DAS according to soil
cover percentage (Wischmeier; smith, 1978; De Maria; Lombardi Neto, 1997; Souza et al., 2010). SCI models
were fitted by polynomial equations for each crop system
at different stages.
(4)
SLR= SLm
SLb
i=1 7
i=1 7 ∑
Table 2 – Precipitation and rain erosivity from November 2011 to March 2012 according to different crop growth stages in Lavras, MG.
Period Growth stage Precipitation Erosivity
(mm) (MJ mm ha-1 h-1 period-1)
01/11 to 10/11/2011 A1 36.4 913.69
11/11 to 20/11/2011 A2 76.5 237.63
21/11 to 05/12/2011 A3 80.1 206.25
05/12 to 30/12/2011 B 410 3,077.54
31/12 to 19/01/2012 C 460.1 2,561.43
20/01 to 08/02/2012 D 83.1 636.85
09/02 to 10/03/2012 E 165 1,134.66
Total 1,311.2 8,768.04
A1, A2 and A3: seedling to post planting; B: crop establishment; C: crop development; D: maturation; E: post harvested.
RESULTS AND DISCUSSION
The highest rainfall occurred in December and January, with February showing the lowest intensity values (Table 2). The time periods related to maize development stage B, C, E, A1 and D were subjected to high erosivity values, larger than 500 MJ mm ha-1 h-1 month-1, considered
critical to promote erosion by Rufino (1986). Erosivity
values ranged from 206.25 to 3,077.54 MJ mm ha-1 h-1,
relative to stages A3 and B, respectively.
Some authors have detected high erosivity potential for this same region during December and March. Dias et al. (2013) stated that this period is the most critical for water erosion. Aquino et al. (2012) analyzed time series for 54 cities at South region of Minas Gerais state and detected high erosivity values, in agreement to those detected by this research (Table 2).
Studies developed by Silva et al. (2005) also detected values as high as 486.5 MJ mm ha-1 h-1 month-1for natural
rainfall in Lavras - MG from 1998 to 2002. Values obtained here, despite the short period (November to March), resulted in erosivity indexes similar to those found by Souza et al. (2010), Barreto et al. (2010) and Cardoso et al. (2012). In fact, Freitas et al. (2012) and Aquino et al. (2012) point out the necessity to adopt management practices that can reduce the sediment transport due to water erosion in this region.
Soil losses caused by water erosion for all systems evaluated are listed in table 3. Initially, it is highly noticeable that plants protect soil against water erosion. Intercropping
was highly beneficial directly reducing soil losses, and,
considering the crops used, jack beans emerged as adequate soil protection, probably due to its initial rapid growth when compared to maize. Its lower height with alternate leaves can better protect soil surface against raindrop impact and thus
reduce runoff. This protective behavior has been reported also by (Alvarenga et al., 1995; Favero et al., 2001; Castro et al., 2011; Cardoso et al., 2012).
Stage B, related to crop establishment, presented more soil loss quantity than stage C (crop development) for single cultivation of maize and jack beans, once that plants generate higher soil protection with time as they are naturally more evolved. However, after stage D, soil cover tends to decrease once there is reduction of plant leaves area (Souza et al., 2010). The highest soil loss among all treatments
was presented in stage C of bare soil, which confirms the
importance of soil cover when compared to cultivation managements at the same stage. This condition was established due to the elevated rainfall erosivity at such stage.
Soil losses measured for bare soil plots (Table 3) were coherent with those reported by Silva et al. (2005), when soil losses were determined for Inceptisol (179.14 Mg ha-1) and Oxisol (14.54 Mg ha-1), for the same months
and region of this research. Bertol and Miquelluti (1993) found soil losses larger than those reported here for maize crop in Inceptisol (6.98 Mg ha-1) probably because its
smaller soil thickness (Silva et al., 2005).
Values found in this research are also similar to those obtained by Cardoso et al. (2012), that measured 1.59 Mg ha-1of soil losses for plots cultivated with jack beans spaced
0.5 m each row apart in Ultisol. Castro et al. (2011) observed values of 1.77 Mg ha-1of soil losses from jack beans plots.
Debarba and Amado (1997) measured values of 1.64 Mg ha-1 caused by water erosion for maize intercropped with
jack beans. In this study soil losses were 1.14 Mg ha-1.
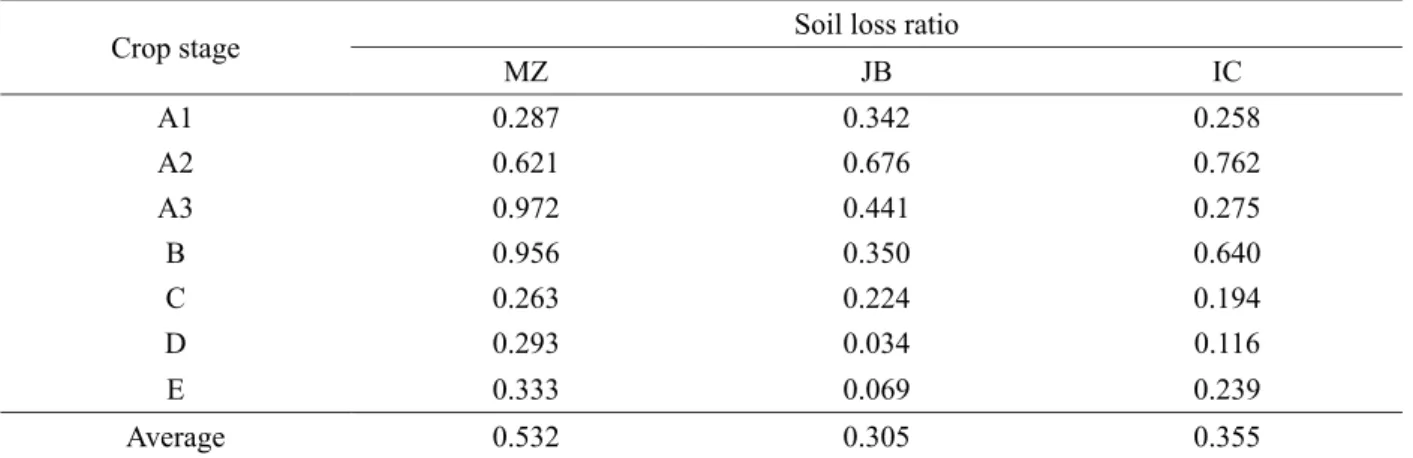
Table 4 – Soil loss ratio for different crop stages in Lavras, MG.
Crop stage Soil loss ratio
MZ JB IC
A1 0.287 0.342 0.258
A2 0.621 0.676 0.762
A3 0.972 0.441 0.275
B 0.956 0.350 0.640
C 0.263 0.224 0.194
D 0.293 0.034 0.116
E 0.333 0.069 0.239
Average 0.532 0.305 0.355
A1, A2 and A3: seedling to post planting; B: crop establishment; C: crop development; D: maturation; E: post harvested; MZ: maize only; JB: jack beans only; IC: maize intercropped with jack beans.
Table 3 – Soil losses by water erosion at different crop systems in Lavras, MG.
Crop stage Soil losses
BS MZ JB IC
--- Mg ha-1 stage-1
---A1 0.16 0.05 0.04 0.06
A2 0.43 0.27 0.33 0.29
A3 0.07 0.07 0.02 0.03
B 0.72 0.69 0.46 0.25
C 2.09 0.55 0.40 0.47
D 0.30 0.09 0.03 0.01
E 0.43 0.14 0.10 0.03
Average 0.60 0.26 0.20 0.16
Total 4.20 1.86 1.38 1.14
A1, A2 and A3: seedling to post planting; B: crop establishment; C: crop development; D: maturation; E: post harvested; BS: bare soil; MZ: maize only; JB: jack beans only; IC: maize intercropped with jack beans.
values were found for stage B. Intercropping reduced SLR values when compared to maize only. In fact, reduction in soil losses was already expected with plant growth development and consequent higher soil protection (De Maria; Lombardi Neto, 1997). However, jack beans single cultivation presented the lowest SLR values, probably due to its initial rapid growth when compared to other crops.
Values of SRL varied among crop stages, mainly because of rainfall erosivity at each stage. Stages A3 and B presented elevated SRL at maize, once that soil loss at such treatment was similar to soil loss at bare soil.
Bertol, Schick and Batistela (2002) demonstrated average values of SLR varying from 0.0611 to 0.1189 when maize was cultivated under no-till conditions or with use of agricultural machinery in soil.
C Factor for USLE was calculated for the different crop systems and its values are listed in table 5. Single maize system presented the highest C values when compared to other planting systems. Intercropping reduced
the C factor significantly. Stage B presented the highest
C factor value among all systems managements, due to
determined among all periods (Table 2), and to crop stage of implemented cultures. Although relative period of seedling to post planting represents soil conditions more susceptible to erosion, as having less soil cover, the rainfall that occurred at the time was much lower than the one that occurred at stage B. The control plot (bare soil) promoted greater soil loss than the other treatments, except for the control plot, which directly affected the higher value of the SLR factor (Table 4) and consequently a higher C factor.
Bertol, Schick and Batistela (2002) presented a C factor for no-till maize of 0.061 Mg ha Mg-1 ha-1 in
Inceptisol. De Maria and Lombardi Neto (1997) defined
several values for C factor for maize cultivated under different systems in Oxisol such as: 0.110 Mg ha Mg-1 ha-1
for maize cultivated at soil with previous crop residues incorporated into the soil, 0.139 Mg ha Mg-1 ha-1 for maize
with burned previous crop residues, 0.026 Mg ha Mg-1 ha-1
for maize with previous crop residues left over the soil surface, 0.102 Mg ha Mg-1 ha-1 for maize with previous
soybean residues incorporated into the soil, and 0.049 Mg ha Mg-1 ha-1 for maize with previous pasture residues
incorporated into the soil in experiments carried out at São Paulo state.
Comparatively, research done by Gabriels et al. (2003) calculated mean values of C factor for 40 different crop rotation systems in Belgium. The least value found for maize was 0.29 Mg ha Mg-1 ha-1, when rotated with wheat
(Triticum aestivum L.) and sugarbeet (Beta vulgaris L.), while the largest value found for maize rotated with potatoes
(Solanum tuberosum L.) was 0.510 Mg ha Mg-1 ha-1. Alberts,
Wendt and Burwell (1985) found C factor of 0.08 and 0.18 Mg ha Mg-1 ha-1 for maize and soybeans conventional tillage.
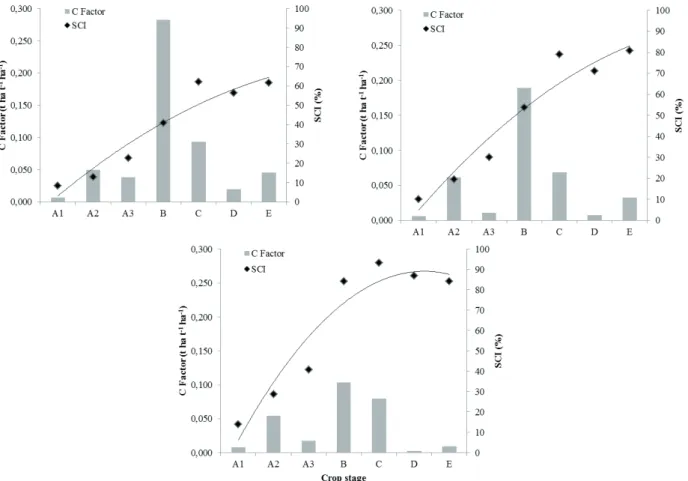
For perennial crops, the C factor decreases with plant growth. Following the procedure developed by Stocking (1988), the behavior of soil cover index (SCI) and C
factor values as plants grow can be observed in figure 1.
SCI measurements started 10 DAS, whereas Souza et al. (2010) pointed how important are the measurements at early stages of growth because high soil and water losses due to smaller coverage tend to occur at such stage.
SCI values increased when comparing single maize to single jack beans. Both were smaller than the intercropping between maize and jack beans that presented SCI as high as 54.02%. SCI value was proportional to crop development, fact that was not observed for C factor values
which were influenced by rain erosivity at each growth
stage. Souza et al. (2010) suggest a SCI higher than 30% to be considered as effective to rainfall erosion action. Such
relation can be verified in this study once there was a soil loss
decrease with SCI increasing. After stage C a decrease of SCI was observed, once there was a decrease of leaves area.
The values plotted in figure 1 were fitted by a
quadratic polynomial model relating SCI values to DAS.
All models presented coefficient of determination higher than 90% indicating a high fit of data (Table 6).
Plants with SCI higher than 30% can be classified as efficient for soil protection against water and soil losses by erosion and are defined as conservation management
system (Lopes; Cogo; Levien, 1987). Intercropping
Table 5 – USLE C factor for different crop stages in Lavras, MG.
Crop stage C factor
MZ JB IC
--- Mg ha Mg -1 ha-1
---A1 0.007 0.006 0.008
A2 0.050 0.061 0.054
A3 0.039 0.011 0.017
B 0.283 0.189 0.104
C 0.094 0.069 0.080
D 0.020 0.008 0.002
E 0.046 0.033 0.009
Average 0.077 0.054 0.039
Figure 1 – USLE C factor and soil cover index (SCI) at different crop stages in Argisol. MZ: maize only; JB: jack beans only; IC: maize intercropped with jack beans.
Table 6 – Soil cover index (SCI) for different crop systems as a function of time after seedling (DAS), in Lavras, MG.
Crop system SCI
Mathematical model R2
MZ IC = -0.808 DAS 2 + 16.68 DAS – 12.74 0.92
JB IC = -1.037 DAS 2 + 21.32 DAS – 15.34 0.94
IC IC = -2.961 DAS 2 + 37.25 DAS – 28.06 0.91
DAS: days after swing; MZ: maize only; JB: jack beans only; IC: maize intercropped with jack beans.
between maize and jack beans as well as jack beans only presented average SCI larger than 30% before 35 DAS, while maize only reached 30% SCI only after 35 DAS. SCI maximum values were 93.30%, 80.88% and 62.10%, respectively, for intercropping, only jack beans and only maize. Introduction of jack beans increased soil protection mainly due to its lower part rapid growth (Dias et al. 2013). Comparing soil losses listed in table 3 to SCI values, it
is possible to state that larger the soil coverage larger its protection against erosion processes. The same relation can be noticed when comparing SCI to C factor.
Research carried by Castro et al. (2011) on soil coverage by plants, pointed out that among plants evaluated, jack beans presented high soil protection when SCI was higher than 70%. Barreto et al. (2010) observed SCI values ranging from 56 to 83% for soybean at South region of Minas Gerais. Cardoso et al. (2012) also obtained similar results with maximum SCI of 95.61% for jack beans. Souza et al. (2010), investigating different varieties of maize, found SCI maximum of 80%.
Similar works were developed by Cogo, Moldenhauer and Foster (1983), as well as Stocking (1988) that found an exponential relation between C factor and IC such that soil vegetation cover between 60 and 100% does not result, necessarily, in large variation on soil losses by water erosion.
CONCLUSIONS
Cultivation of maize only presented smaller soil coverage values, increased by jack beans only and then increased more by intercropping between both species.
Intercropping presented higher potential to control erosive processes once it presented smaller soil losses when compared to single cropping of either species.
Intercropping of maize and jack beans presented a higher soil cover index and, consequently, lower C factor when compared with single cultivation of maize and jack
beans, which confirms the benefits of intercropping on
soil protection.
ACKNOWLEDGMENTS
Authors recognize their gratitude to CAPES (Coordination of Improvement of Higher Education
Personnel) agency for the financial support and scholarships,
to FAPEMIG (Research Foundation of Minas Gerais State) and CNPq (National Research and Development Council)
for their financial support. The authors are also thankful to
the support given by professors Gabriel José de Carvalho and Renzo Garcia Von Pinho, both from UFLA, and undergraduate students Fábio Santos Pereira, Pedro Velloso Gomes Batista and Endrew Antunes dos Santos.
REFERENCES
ALBERTS, E.E.; WENDT, R.C.; BURWELL, R.E. Corn and soybeans cropping effects on soil losses and C factors. Soil Science Society of America Journal, 49(3):721-728, 1985.
ALVARENGA, R.C. et al. Características de alguns adubos verdes de interesse para a conservação e
recuperação de solos. Pesquisa Agropecuária Brasileira, 30(2):175-185, 1995.
AQUINO, R.F.et al. Spatial variability of the rainfall erosivity in southern region of Minas Gerais state, Brazil. Ciência e Agrotecnologia, 36(5):533-542, 2012.
BARRETO, V.C.M. et al. Índice de cobertura vegetal e sua modelagem para cultivares de soja no sul de Minas Gerais.
Ciência e Agrotecnologia, 34(5):1168-1175, 2010.
BERTOL, I.; MIQUELLUTI, D.J. Perdas de solo, água e nutrientes reduzidas pela cultura do milho. Pesquisa Agropecuária Brasileira, 28(10):1205-1213, 1993.
BERTOL, I.; SCHICK, J.; BATISTELA, O. Razão de perdas de solo e fator C para milho e aveia em rotação com outras culturas em três tipos de preparo de solo. Revista Brasileira de Ciência do Solo, 26(3):545-552, 2002.
BEUTLER, J.F. et al. Perdas de solo e água num Latossolo Vermelho aluminoférrico submetido a diferentes sistemas de preparo e cultivo sob chuva natural. Revista Brasileira de Ciência do Solo, 27(3):509-517, 2003.
BILOTTA, G.S.; GROVE, M.; MUDD, S.M. Assessing
the significance of soil erosion. Transactions of the Institute of British Geographers, 37:342–345, 2012.
BRASIL. Ministério da Agricultura e Reforma agrária.
Normais climatológicas: 1961-1990. Brasília: Secretaria Nacional de Irrigação, 1992. 84p.
BRAZIER, R. Quantifying soil erosion by water in the UK: a review of monitoring and modelling approaches.
Progress in Physical Geography, 28:340–365, 2004.
CALEGARI, A. et al. Adubação verde no sul do Brasil. 2. ed. Rio de Janeiro: AS-PTA, 1993. 346p.
CARDOSO, D.P. et al. Plantas de cobertura no controle das perdas de solo, água e nutrientes por erosão hídrica. Revista Brasileira de Engenharia Agrícola e Ambiental, 16(6):632–638, 2012.
CASTRO, N.E.A. et al. Plantas de cobertura no controle da erosão hídrica sob chuvas naturais. Bioscience Journal, 27(5):775-785, 2011.
CERDAN, O. et al. Rates and spatial variations of soil erosion in Europe: A study based on erosion plot data.
Geomorphology, 122(1-2):167-177, 2010.
CHIEZA, E.D. et al. Propriedades físicas do solo em área sob milho em monocultivo ou consorciado com leguminosas de verão. Revista Brasileira de Ciência do Solo, 37(5):1393-1401, 2013.
COGO, N.P.; MOLDENHAUER, W.C.; FOSTER, G.R. Effect of residue cover, tillage-induced roughness, and runoff velocity on size distribution of eroded soil aggregates. Soil Science Society of America Journal, 47(5):1005-1008, 1983.
COGO, N.P.; LEVIENS, R.; SCHWARZ, R.A. Perdas
de solo e água por erosão hídrica influenciadas por
métodos de preparo, classes de declive e níveis de fertilidade do solo. Revista Brasileira de Ciência do Solo, 27(4):743-753, 2003.
DEBARBA, L.; AMADO, T.J.C. Desenvolvimento de sistemas de produção de milho no sul do Brasil com características de sustentabilidade. Revista Brasileira de Ciência do Solo, 21:473-480, 1997.
De MARIA, I.C. Cálculo da erosividade da chuva. In:
Manual de programas de processamento de dados de campo e de laboratório para fins de experimentação em conservação do solo. Campinas: IAC/SCS, 1994. Não paginado.
De MARIA, I.C.; LOMBARDI NETO, F. Razão de perdas de solo e fator C para sistemas de manejo da cultura do milho. Revista Brasileira de Ciência do Solo, 21(2):263-270, 1997.
DIAS, A.C. et al. Plantas de cobertura no controle da erosão hídrica no Sul de Minas Gerais. Ciência e Agrotecnologia, 37(5):410-418, 2013.
EMPRESA BRASILEIRA DE
PESQUISAAGROPECUÁRIA-EMBRAPA. Sistema brasileiro de classificação de solos. 3 Ed. Rio de Janeiro: Embrapa Solos, 2013. 353 p.
FAVERO, C. et al. Modificações na população de
plantas espontâneas na presença de adubos verdes.
Pesquisa Agropecuária Brasileira, 36(11):1355-1362, nov. 2001.
FERREIRA, A.O. et al. Influência da declividade e de
níveis de cobertura do solo no processo de erosão com chuva simulada. Revista Verde, 5(5):182-190, 2010.
FREITAS, D.A.F. et al. Modelagem da proteção do solo por plantas de cobertura no sul de Minas Gerais.
Revista Agro@mbiente On-line, 6(2):117-123, 2012.
FOSTER, G.R. et al. Conversion of the universal soil loss equation to SI metric units. Journal of Soil and Water Conservation, 31:355-359, 1981.
GABRIELS, D. et al. Assessment of USLE cover-management C-factors for 40 crop rotation systems on arable farms in the Kemmel beek watershed, Belgium.
Soil & Tillage Research, 74:47–53, 2003.
GILLES, L. et al. Perdas de água, solo, matéria orgânica e nutriente por erosão hídrica na cultura do milho
implantada em área de campo nativo, influenciadas
por métodos de preparo do solo e tipos de adubação.
Revista Brasileira de Ciência do Solo, 33(5):1427-1440, 2009.
LOPES, P.R.; COGO, N.P.; LEVIEN, R. Eficácia
relativa de tipo e quantidade de resíduos culturais espalhados uniformemente sobre o solo na redução da erosão hídrica. Revista Brasileira de Ciência do Solo, 11(1):71-75, 1987.
MARQUES, M.J. et al. Effect of vegetal cover on runoff and soil erosion under light intensity events. Rainfall simulation over USLE plots. Science of the total environment, 378(1):161-165, 2007.
MELLO, E.L. et al. Perdas de solo e água em diferentes sistemas de manejo de um Nitossolo Háplico submetido à chuva simulada. Revista Brasileira de Ciência do Solo, 27(5):901-909, 2003.
ROSSETTI, K.V. et al. Atributos físicos do solo em diferentes condições de cobertura vegetal em área de plantio direto. Revista Brasileira de Ciências Agrárias,7:427-433, 2012.
RUFINO, R. L. Avaliação do potencial erosivo da chuva para o estado do Paraná. Revista Brasileira de Ciência do Solo, 10(3):279-281, 1986.
SCHÖNBRODT, S. et al. Assessing the USLE crop and management factor C for soil erosion modeling in a large mountainous watershed in central China. Journal of Earth Science, 21(6):835-845, 2010.
SILVA, A.M. et al. Perdas de solo, água, nutrientes e carbono orgânico em Cambissolo e Latossolo sob chuva natural. Pesquisa Agropecuária Brasileira, 40(12):1223-1230, 2005.
SOUZA, F.S. et al. Índice de cobertura vegetal pela cultura do milho no período de chuvas intensas no sul
de Minas Gerais. Ciência e Agrotecnologia, 34(2):345-351, 2010.
STOCKING, M.A. Assessing vegetative cover and management effects. In: LAL, R. (Ed.). Soil erosion research methods. Ankeny: Soil and Water Conservation Society, 1988. p.163-185.
VAEZI, A.R. et al. Modeling the USLE K-factor for calcareous soils in northwestern Iran. Geomorphology, 97(3):414-423, 2008.
VIEIRA, C. O feijão em cultivos consorciados.
Viçosa, MG: UFV, 1989. 134 p.
WISCHMEIER, W.H.; SMITH, D.D. Predicting rainfall erosion losses: a guide to conservation planning. Washington: USDA, 1978. 58p.