Environmental Issues Related to Electricity Exchange Between South
American Countries
]
Ricardo M. e DINATO¹,2, Vinícius O. da SILVA¹, André L.V. GIMENES¹, Miguel E.M. UDAETA¹, Jose Aquiles Baesso Grimoni
1Energy Group of the Department of Electrical Energy and Automation Engineering, Polytechnic School, University of São Paulo, São Paulo Brazil
² GVces - São Paulo School of Business Administration Getulio Vargas Foundation (FGV), São Paulo, Brazil
Abstract
Since resources are not homogenously distributed throughout the planet, commerce of raw material between countries becomes a necessity. The present work analyzes the commerce of electricity between South American countries under the environmental perspective, using Life Cycle Assessment. The year 2012 was chosen to sketch the scenario of exportation and importation of electricity among the South American countries because it is the most recent data. To assess the electricity matrix of the countries, six categories of environmental impact were chosen: climate change, terrestrial acidification, freshwater eutrophication, particulate matter emission, natural land transformation, and fossil depletion. Among these categories, Paraguay was the best rated country, with the lowest environmental impact in five categories — except in natural land transformation, in which it had the highest, because of its hydroelectric-based matrix. The impact categories were divided into three groups: global pollution, local pollution, and depletion of natural resources. In the case of global pollution, energy integration of the continent can favor the global reduction of greenhouse gas emissions. As for local pollution, it is worth noting that countries exporting electricity consider the environmental impact within the country itself when negotiating MWh sales prices; it is necessary to internalize the externalities. Regarding the depletion of natural resources, the analyzed environmental impact categories are not critically important to these countries in the present moment. Energy integration in South America can be a vector to promote sustainable development in the region but it is necessary that environmental and social issues are duly considered in the decision-making processes.
Keywords:
Energy Integration, South of America, Energy Resources, Environmental Factors, Life Cycle Assessment1. INTRODUCTION
The progress of humankind is based on the constant search for energy. Since their beginnings, humans spent a great portion of their time seeking food to supply their own bodies’ energy demands. As time went by and the first civilizations were formed, energy was then used for other ends: shelter, commerce, industry, agriculture, and transportation.
The industrial revolution intensified the search for energy and countries began to realize that the distribution of energetic resources was not homogenously distributed throughout the planet. Some countries have demands higher than their own resources; others have greater resources than their demands. This scenario has led, beginning in the 19th century, to a series of armed conflicts throughout the world, moved by nations’ plans to appropriate others’ resources. After the Second World War, European countries began to seek peaceful alternatives to resolve these inequalities, which has led to projects and initiatives of commerce of energy surplus [1].
Even through this process of economic and power integration began in Europe, the concept was quickly spread throughout the world, including in South America. From the second half of the 20th century onwards, mechanisms of economic integration in the area were developed, such as the Andean Community (CAN), Southern Common Market (Mercosur) and the Union of South American Nations (UNASUR), as well as some bilateral initiatives [1,2].
The first interconnections in South America were motivated by the construction of great hydroelectric binational endeavors: Salto Grande in 1979 (Argentina and Uruguay), Itaipu in 1984 (Brazil and Paraguay) and Yaciretá in 1998 (Argentina and Paraguay). Other motivators were agreements of selling electricity, such as those between Brazil-Argentina, Argentina-Chile, and Brazil-Venezuela [2,3].
As for electric interconnection in South America, currently most countries have some kind of connection with border countries, as seen in Figure 1
Table 1 Relation of international electric interconnections in South America [4].
Reference Countries Location
1 Co-Ve Cuestecita (Co) - (Ve)
2 Co-Ve Tibú (Co) - La Fría (Ve)
3 Co-Ve San Mateo (Co) - El Corozo (Ve) 4 Co-Pa Cerromatoso (Co) - Panama (Pa) 5 Co-Ec Pasto (Co) - Quito (Ec)
6 Co-Ec Jamondino (Co) - Santa Rosa (Ec) 7 Co-Ec Ipiales (Co) - Tulcán (Ec) 8 Ec-Pe Machala (Ec) - Zorritos (Pe) 9 Br-Ve Boa Vista (Br) - El Guri (Ve)
10 Bo-Pe La Paz (Bo) - Puno (Pe)
11 Br-Py Saídas da Central Itaipú 12 Br-Py Foz do Iguaçu (Br) - Acaray (Py) 13 Ar-Py El Dorado (Ar) - Mcal. A. López (Py) 14 Ar-Py Clorinda (Ar) - Guarambaré (Py) 15 Ar-Py Saídas da Central Yacyretá 16 Ar-Br Rincón S. M. (Ar) - Garabi (Br) 17 Ar-Br P. de los Libres(Ar) - Uruguaiana(Br) 18 Ar-Uy Salto Grande(Ar) - Salto Grande(Uy) 19 Ar-Uy Concepción (Ar) - Paysandú (Uy) 20 Ar-Uy Colonia Elia (Ar) - San Javier (Uy) 21 Br-Uy Livramento (Br) - Riviera (Uy) 22 Br-Uy Pte. Médici (Br) - San Carlos (Uy) 23 Ar-Cl CT TermoAndes(Ar) - Sub.Andes(Cl)
It’s important to differentiate concepts of integration and energy interconnection. Energy interconnection between countries with the purpose of creating a common market is part of a wide process of regional integration, involving strategic issues other than just energy concerns. The energy interconnection deals only with energy transmission from one country to the other [3]. Basing on this definition, we cannot say that there is in fact, an energetic integration in South America, only point interconnections.
Thereby, the objective of the present work is to evaluate, from an environmental perspective, the energy matrix of South American countries that have exported or imported electricity in 2012. Based on this evaluation, it is possible to discuss the energy exchange between the continent’s countries under a socioenvironmental lens, as it is impossible to separate environmental and social questions
2. METHODOLOGY CONCEPTS
The electric matrix of the studied countries was analyzed using the Life Cycle Assessment (LCA). LCA is a tool that estimates the environmental performance throughout the sequence of activities taking place in the creation and use of a product (good or service). The extraction and consumption of resources (including energy), as well as air, water, and soil emissions are quantified in all stages of the life cycle of the studied product. The potential contribution for each of the environmental impact categories is then assessed. These categories include, among others, climate change, human and ecological toxicity, ionizing radiation, and deterioration of natural resources, such as: water, non-renewable energy sources, and soil [5].
LCA is derived from life cycle thinking, which is predicated on the understanding that primary matter is extracted from nature, converted into process material, combined with other materials to make up components that will be aggregated into a final product, and then sent to consumers that will use it and finally disposed in some way. Throughout this value chain, energy is used, residue is generated, and other natural resources are used [5].
Life cycle thinking allows us to identify in which stage throughout the life cycle of a product there is a greater opportunity to reduce environmental impacts. Without this analysis, changes can be made but that will lead to unexpected impacts in other stages of the life cycle. This means that there can be a dislocation of the environmental impact to other stages of the life cycle, other regions of the world, or other categories of environmental impact [5].
This concept is essential to coherently assess mitigation actions of environmental impacts, since there is no point in improving just one part of the analyzed system or just one part of the life cycle. If an alleged improvement leads to negative consequences in other parts of the systems, the resulting environmental impact can be even greater than the original one.
To assess the electric matrix of the studied countries, we selected six categories of environmental impact: climate change, terrestrial acidification, freshwater eutrophication, particulate matter emission, natural land transformation, and fossil depletion.
The South American countries that have exported or imported electricity in 2012 were: Argentina, Brazil, Colombia, Ecuador, Paraguay, Peru, Uruguay, and Venezuela. Table 2 shows the amount of commercialized electricity between each country in 2012.
Table 2 Electricity exchange between South American countries in 2012 (values in GWh) [4]. EXPORTER To ta l im p o rt a tio n Ar g en tin a (Ar ) Br a zil (Br ) Co lo m b ia (Co ) Ec u a d o r (Ec ) Pa ra g u a y (P y ) Per u (Pe) Ur u g u a y (Uy ) Ve n ez u ela (Ve ) IMPOR TER Ar - 79 - - 7,646 - 194 - 7,919 Br - - - - 40,016 - - 705 40,721 Co - - - 7 - - - - 7 Ec - - 236 - - 2 - - 238 Pe - - - 5 - - - - 5 Uy 279 463 - - - - 742 Ve - - 478 - - - 478 Total exportation 279 542 714 12 47,66 2 2 194 705 50,110
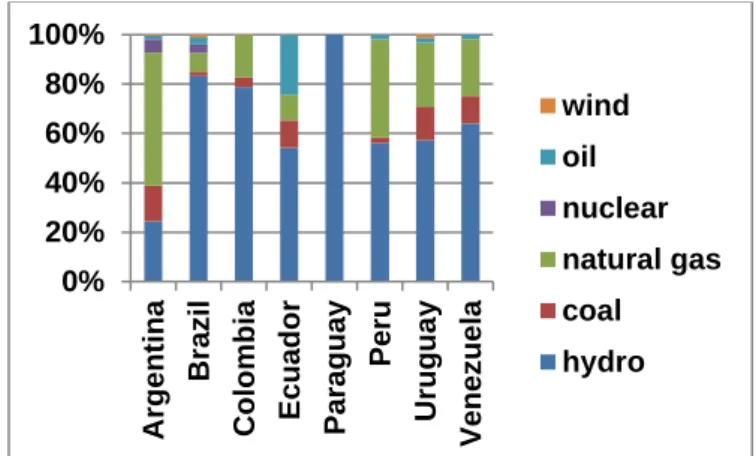
Figure 2 shows these countries’ electric matrixes, based on the 2012 power generation.
Fig. 2 Composition of electricity (2012 electricity generation) [4].
3.RESULTS AND DISCUSSION
Before the results are presented, it is important to note that LCA was based on an extremely simplified model of each country’s electric matrix. The default values from Ecoinvent, version 3.1, were used to model the potential environmental impact of each energy source. The software used was SimaPro, version 8.0.5.13.
The result of the potential environmental impact and the discussion were divided into three groups: global pollution, local pollution, and depletion of natural resources.
0% 20% 40% 60% 80% 100% Ar g ent ina Br az il Co lom b ia E cuad o r P ar a g u ay P er u Ur u g u a y V enez u ela wind oil nuclear natural gas coal hydro
3.1. Global Pollution
The category of impact pertaining to climate change is the only one analyzed in the present work that can be classified as global pollution. This means that the site where the greenhouse gas (GHG) emissions occur is irrelevant, since the impact — the increase in the planet’s overall temperature — affects all countries.
Figure 3 presents GHG emissions related to the electric matrix of each country. This means, for instance, that to generate 1 MWh of electricity in 2012 in Venezuela, about 400 kg of CO2e were emitted. The colors represent which forms of generation were the responsible for each emission.
Fig. 3 Environmental impact category: climate change (kg CO2e/MWh).
Since this type of pollution is global, the electricity exchange between the South American countries could contribute to reduce global GEE emissions. Under this perspective, we can divide the commercialization of electricity in the continent in the year of 2012 in two:
Case I. Country with higher carbon intensity in the matrix, exporting to country with lower carbon intensity in the matrix
Case II. Country with lower carbon intensity in the matrix, exporting to country with higher carbon intensity in the matrix
Table 3 divides the exchange of electricity in 2012 between cases I and II.
0 100 200 300 400 500 600 wind oil nuclear natural gas coal hydro
Table 3 Division of the electricity exchange between South American countries in 2012 between cases I and II.
Case I Case II
Argentina → Uruguay Brazil → Argentina Ecuador → Colombia Brazil → Uruguay
Ecuador → Peru Colombia → Ecuador
Venezuela → Brazil Colombia → Venezuela Paraguay → Argentina Paraguay → Brazil Peru → Ecuador Uruguay → Argentina
The exchange in case I is not desirable for climate change, since a less carbon-intensive matrix is substituted for a more intensive one, increasing global GHG emissions.
In the specific stance of Venezuela exporting to Brazil, this energy is used to supply the needs of Roraima, a state still not connected to the national grid (Sistema Interligado Nacional, SIN). Looking specifically at this environmental issue, it would be more advantageous to connect Roraima to SIN instead of importing electricity for Venezuela.
The exchange classified as case II contributes to the global decrease of GHG emissions. Of the twelve 2012 exchanges, eight belong to case II. This type of exchange is desirable and may begin to receive greater incentives after the Paris Agreement.
Analyzing the example of Argentina, it is more advantageous for the country to import electricity from Brazil, Paraguay, or Uruguay instead of increasing its own generation with natural gas or mineral coal. Obviously this analysis contemplates only this specific environmental impact and energetic integration goes far beyond this single aspect.
Another question to be analyzed is the commitments to reduce GHG emissions made by the 195 countries signing the Paris Agreement [6]. A country may cease exportation of electricity to a neighboring country in order to meet their reduction demands, thus decreasing the burning of fossil fuel.
3.2. Local Pollution
There are several categories of environmental impact that can be classified as local pollution. In the present study, only three were analyzed: terrestrial acidification, freshwater eutrophication, and particulate matter emission. By generating electricity for exportation, one country pollutes itself to meet the needs of another. Obviously, there is some financial gain to this, but it is important to note that external impacts should be included in this negotiation.
Figure 4 depicts how the electric matrix of each country contributes to terrestrial acidification. Ecuador tops the ranking, emitting almost 3 kg of SO2e for each 1 MWh generated. Oil thermoelectric plants are the main culprits for this emission in the country. On the other side of the list, there is Paraguay, whose matrix is comprised basically of hydroelectric plants, the emission of acidification gases being very low.
Source: own compilation
Fig. 4 Environmental impact category: terrestrial acidification (kg SO2 eq/MWh)
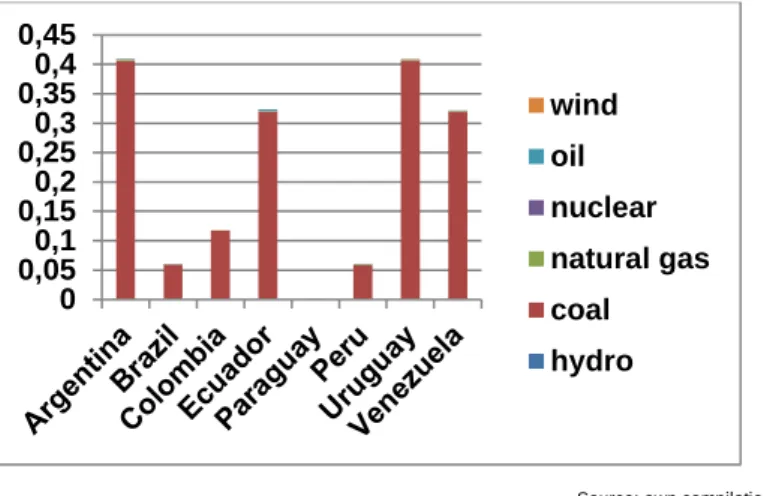
Figure 5 presents the freshwater eutrophication impact. Mineral coal emerges as a highly pollutant resource in terms of eutrophication. It is worth noting that this pollution occurs in the coal extraction stage, and not on burning. To simplify, we assumed that the coal burned was extracted in the same country.
In this fashion, countries using more coal in generating energy are those leading the ranking, especially Argentina and Uruguay, with emissions over 0.4 kg of P eq for generating 1 MWh of electricity. Once again, Paraguay is in the last position, with minimal emissions thanks to their hydroelectric-based matrix. 0 0,5 1 1,5 2 2,5 3 3,5 wind oil nuclear natural gas coal hydro
Source: own compilation
Fig. 5 Environmental impact category: freshwater eutrophication (kg P eq/MWh)
Figure 6 shows the emission of particulate matter for the generation of electricity in the studied countries. Once again, mineral coal has the lowest performance in this category, responsible for most emissions. However, as opposed to eutrophication, emission of particulate matter occurs during the burning of the coal itself. Argentina, Ecuador, and Uruguay top the ranking, followed closely by Venezuela. Again, Paraguay is at the bottom, with emissions close to zero.
Fig. 6 Environmental impact category: particulate matter emission (kg PM10 eq/MWh)
Discussion of the three local pollution categories analyzed can be done in a unified way. In the case of local pollution, it is not important to know whether the exporting country pollutes more or less than the importing country, since pollution is restricted to its geographic limits. In some cases, pollution can reach neighboring countries, being then classified as regional pollution, as it occurs frequently in Europe, but which does not happen very often in South America.
0 0,05 0,1 0,150,2 0,25 0,3 0,350,4 0,45 wind oil nuclear natural gas coal hydro 0 0,5 1 1,5 2 2,5 wind oil nuclear natural gas coal hydro
Generation of electricity for exportation provokes environmental impacts in the country of origin to meet the importing country’s demands. In negotiation, these environmental impacts should be taken into account in the value of MWh, since these external factors are prejudicial to the environment and society of the exporting country.
3.3. Depletion of Natural Resources
Depletion of natural resources can also be called natural resource exhaustion. In the present work, two impact categories were analyzed within this group: natural land transformation and fossil depletion. Figure 7 presents the impact category named environment transformation. This category accounts for only the area transformed to generate energy in a purely quantitative analysis, regardless of what used to be in the transformed area: forest, savanna, sea, or ocean. The only analysis made is how many square meters are needed to generate 1 MWh of electricity.
Fig. 7 Environmental impact category: natural land transformation (m²/MWh)
Among the energy alternatives used by the analyzed countries, hydroelectricity is one that needs a higher area for generation of electricity. Paraguay leads this ranking, since its matrix is composed basically of hydroelectric plants. On the other side, there is Argentina, with lesser reliance in hydroelectricity.
Natural land transformation shows how much area has been transformed to generate energy, affecting the availability of area in the country for other ends. Therefore, the natural resource that is quickly diminishing is precisely this availability. In countries with low demographic density this is less of an issue; however each square meter is highly sought after in higher demographic density countries. As an example, Paraguay has a demographic density of only 17 inhabitants per square kilometer, being the 200th in a list of 233 countries, being one of the least populous countries [7]. Thus, the
0 0,05 0,1 0,15 0,2 0,25 wind oil nuclear natural gas coal hydro
dispute for real estate is not a problem for Paraguay, and it is worth considering using part of its area to generate revenue by exporting electricity.
The South American countries, in general, have low demographic density when compared to other continents’, as seen in Table 4. The contest for space is not a serious problem in the continent.
Table 4 Demographic Density of South American Countries in 2015 [7].
Position in world ranking
Country or region Demographic
density (people/km2) 147 Ecuador 65 167 Colombia 43 174 Venezuela 35 184 Brazil 25 185 Peru 25 186 Chile 24 195 Uruguay 20 200 Paraguay 17 202 Argentina 16 214 Bolivia 10 223 Guyana 4 225 Suriname 3 226 French Guiana 3 232 Falkland Island 0.2
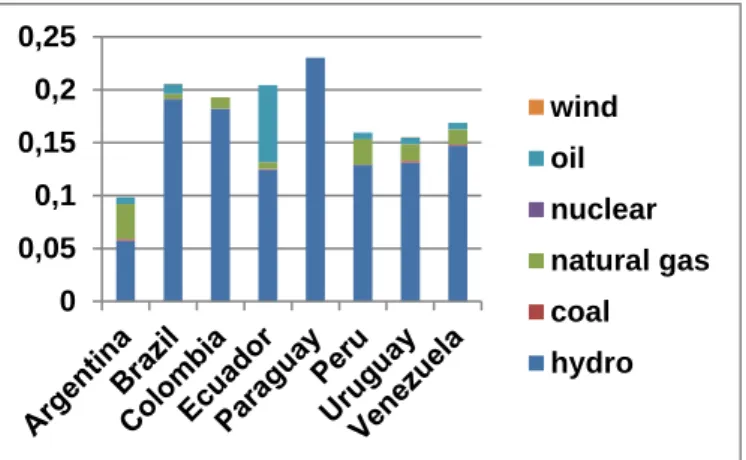
Figure 8 presents the category named fossil depletion. It is a concept similar to toe, but accounts the sum of all fossil fuel used throughout the life cycle of electricity generation. Even hydroelectric plants have some impact in this category, because of the fossil fuels used during production and operation of the plants.
In a general way, the countries whose matrixes depend the most on fossil fuel are those that are exhausting this natural resource, with Argentina leading the ranking and Paraguay in the last position. A fossil fuel under the soil, however, has no value, only a reserve for the future.
Extracting fossil fuels to generate electricity, export, and generate revenue seems to be pertinent issues for any country. As long as the reserves are far from being exhausted, it is natural that countries exploit these resources to generate revenue, as it is the case with mining.
On the other hand, long-term planning could point that reserving these resources for the future can be fruitful, since the price of these fuels would increase at the same pace the fossil fuels of other
countries would deplete. There is some risk to this reasoning, however, since renewable resources are becoming increasingly cheaper, thus being more advantageous as a medium-term plan.
Since South American countries are still developing, there would be little sense to reserve these resources for the future instead of solving present issues. From the environmental impact perspective, it is pertinent that exploitation of the resources continues to meet the internal and external demands.
Fig. 8 Environmental impact category: fossil depletion (kg oil eq/MWh)
4. CONCLUSIONS
The exchange of electricity between South American countries has been taking place for some decades, but there are few studies dealing with the environmental issues related to this commerce. From the global pollution perspective, there is a great opportunity to reduce global greenhouse emissions by interconnecting South American countries. Natural resources can and should be optimized to meet the energy needs of the continent’s countries and minimizing emissions. Countries with higher hydric potential can be exporters of low carbon intensity electricity to countries with greater reliance on fossil fuel. Since the problem of climate change is global, the joint effort of the countries can contribute to mitigate this environmental impact, considered by many humankind’s greatest challenge in the present century.
Regarding local pollution, it would be important to include external factors in the commercial price of electricity. By generating electricity for exportation, a country is polluting its own region and causing damage to the environment and to the health of the population. Thus, this impact should be accounted in the sell price of MWh.
0 20 40 60 80 100 120 140 160 180 wind oil nuclear natural gas coal hydro
Depletion of natural resources should also be taken into account in the exchange of electricity. However, the two analyzed categories — natural land transformation and depletion of fossil resources — do not seem to be critical as of now.
Conventional energy planning takes into consideration only technical-economic issues for decision-making, and it is vital that energy integration does not follow the same path. Political issues are inherent to the integration process, but the other dimensions of sustainable development (environmental and social) also need to be considered so that the economic gains do not overpower the society’s well-being.
11. ACKNOWLEDGEMENTS
To students of discipline - PEA5899 Integração Energética: Análise Sistêmica e Avançada para América Latina (Energy Integration: Systemic and Advanced Analysis for Latin America) – of the post graduate program in electrical engineering of the Polytechnic School, University of São Paulo, Brazil. To GEPEA - Energy Group of the Department of Electrical Energy and Automation Engineering, for its support to the development of this study.
11. REFERENCES
[1] Reis,A.G. 2014. A arquitetura da integração energética sul-americana, a participação brasileira e a geoenergia humana. Master’s thesis, Polytechnic School, University of São Paulo, São Paulo, Brazil.
[2] Udaeta, M.E.M.; Silva, V.O.; Galvão, L.C.R.; Souza, F.N. Analysis of Energy Integration and the Transboundary Superstructure in South America. Proc.: Journal of Business and Economics, 2016, Vol. 7, 1, pp. 21-43.
[3] Abreu Junior, A.C. 2015. A integração da indústria de energia elétrica na América do Sul: análise dos modelos técnicos e de regulamentação,” Master’s thesis, Polytechnic School, University of São Paulo, São Paulo, Brazil.
[4] Comisión de Integración Energética Regional (CIER). 2013. Síntesis informativa energética de los países de la CIER. Información del sector energético en países de América del Sur, América Central y El Caribe. Datos del año 2012. Available: www.cier.org.uy
[5] United Nations Environment Programme. 2011. Global guidance principles for life cycle assessment databases. A basis for greener processes and products. Paris, France.
[6] United Nations Framework Convention on Climate Change. 2016. Historic Paris agreement on climate change: 195 nations set path to keep temperature rise well below 2 degrees Celsius,” 2016. Available: http://newsroom.unfccc.int/unfccc-newsroom/finale-cop21
[7] United Nations, Department of Economic and Social Affairs, Population Division, 2015. World population prospects: the 2015 revision, DVD edition,” 2015. Available: http://esa.un.org/unpd/wpp/ Download/Standard/Population
![Table 1 Relation of international electric interconnections in South America [4].](https://thumb-eu.123doks.com/thumbv2/123dok_br/17803518.841015/5.892.249.643.264.844/table-relation-of-international-electric-interconnections-south-america.webp)


![Table 4 Demographic Density of South American Countries in 2015 [7].](https://thumb-eu.123doks.com/thumbv2/123dok_br/17803518.841015/13.892.245.651.379.785/table-demographic-density-south-american-countries.webp)

