Novembro de 2016 U m inho | 20 1 6 Flá
vio João Magalhães Soar
es
Me
tabolic changes during pos
thar
ves
t deh
ydration process in g
rape (V
itis vinifera L.) berries
Flávio João Magalhães Soares
Metabolic changes during postharvest
dehydration process in grape
Flávio João Magalhães Soares
Metabolic changes during postharvest
dehydration process in grape
(Vitis vinifera L.) berries
Novembro de 2016
Dissertação de Mestrado
Mestrado em Biologia Molecular, Biotecnologia
e Bioempreendedorismo em Plantas
Trabalho efetuado sob a orientação do
Professor Doutor Hernâni Varanda Gerós
e do
This work was supported by national funds by FCT - Portuguese Foundation for Science and Technology, under the project UID/AGR/04033/2013.
FEDER/COMPETE-Operational Competitiveness Programme - INNOVINE - ref. 311775.
Artur Conde was supported by INTERACT - NORTE-01- 0145-FEDER-000017 - Linha VitalityWine - ON 0013 (BPD/UTAD/INTERACT/VW/218/2016).
This work also benefited from the networking activities within the European funded COST ACTION FA1106 “QualityFruit".
A vida é feita de batalhas, batalhas pra sobreviver E quando falhas, vês que as falhas é que ensinam a crescer O saber não ocupa espaço a quem abre espaço ao saber E mesmo que chegues atrasado nunca é tarde pra aprender
Only those who will risk going too far
can possibly find out how far one can go.
Acknowledgments
Esta tese de mestrado representa dois anos intensos de muito trabalho e sobretudo dois anos de crescimento como profissional e como pessoa. Por isso e como não poderia deixar de ser, tenho que deixar alguns agradecimentos a quem me ajudou neste percurso e a quem partilhou de alguma forma estes anos comigo.
Um especial e sincero agradecimento aos meus orientadores por toda a ajuda e disponibilidade em auxiliar em todas as etapas deste projeto. Ao Professor Doutor Hernâni Gerós por me ter recebido no seu grupo e por toda a sua orientação e conhecimento partilhado. Ao Doutor Artur Conde pela paciência e grande trabalho que fez comigo. Sinto que me fez crescer muito como investigador e como pessoa, obrigado por isso. É sem dúvida um gosto muito grande poder aprender e trabalhar com os melhores.
Não posso deixar de agradecer a todo o pessoal do LBV, ao Henrique Noronha, Viviana Martins, Richard Gonçalves, Weina e Nikola por nos fazerem sentir em casa logo no primeiro dia, pelo bom ambiente de trabalho e auxilio sempre que necessário. Angélica e Filipa por terem partilhado este ano comigo, também gosto muito de vocês… basicamente vocês são amigos que guardo para a vida.
O maior obrigado do mundo aos meus pais e aos meus irmãos, por toda a ajuda, por todo o sacrifício feito para que eu pudesse terminar mais uma etapa do meu percurso académico e poder continuar a perseguir um sonho.
E “the last but not the least”, um agradecimento especial à Rita por ter acompanhado estes últimos anos comigo, pelo amor e pela paciência nas alturas mais complicadas. Obrigado!
Abstract
After detachment from the plant and until cell death, fruits remain metabolically active, resulting in compositional modifications. For certain food products, postharvest controlled stresses are applied to induce desired physical or chemical changes. In the case of grapes, a gradual dehydration process is normally utilized for raisin production and also for the production of special wines. Postharvest dehydration, in general, causes changes in texture, color, taste and nutritional value of food due to the high temperatures and long drying times required in the process. However, very limited information is so far available on the molecular modifications that are triggered during postharvest dehydration-induced compositional and phonological changes as well as on and their regulatory mechanisms.
Thus, to better understand the molecular responses and metabolic changes during grape berry postharvest dehydration, we applied an industry-mimicking slow dehydration process for eleven days at 50ºC to intact berry clusters. A set of molecular, cellular and biochemical analyses were performed to assess if postharvest dehydration had a significant impact in grape berry cellular metabolism. Dried grape berries lost almost 40% of weight in water and transcriptional analyses by real time qPCR showed that several aquaporin genes (VvPIP2;1, VvTIP1;2 and VvSIP1) were strongly up regulated during the applied treatment. Transcriptional analysis also revealed that postharvest dehydration provoked an improvement in sugar transport capacity from berry apoplast
into cells as suggested by the severe increase in transcripts of sugar transporters (VvHT1,
VvSWEET11, VvSWEET15, VvTMT1). As the concentration of glucose, fructose and sucrose was barely changed, post-phloem transport stimulation in berry cells could account for that occurrence. Moreover, transcriptional and biochemical enzyme activity analyses also suggested that dehydrated grape berries subjected to postharvest dehydration had substantially enhanced polyol biosynthesis capacity, as corroborated by significant sorbitol concentrations detected only in dehydrated grapes. Postharvest dehydration also affected the metabolism of organic acids in grape berries, by inducing transcriptional and biochemical activity modifications in malate dehydrogenases and malic enzymes that lead to organic acid (malate and tartrate) degradation as demonstrated by HPLC analysis. Real time qPCR analyses in key targets of the secondary metabolism (VvSTS1, VvCHS1, VvPAL1 and VvFLS1) suggested a general up-regulation of secondary pathways. However, a higher magnitude overexpression of the peroxiredoxin VvPRX31, associated with phenolics/anthocyanins degradation, could have simultaneously been responsible for the observed decrease in the concentration of total phenolics concentration in dehydrated berries. Taken together, all these molecular changes show that postharvest dehydration clearly impacts a wide range of metabolic pathways and molecular mechanisms of primary and secondary metabolism of grape berry cells.
Resumo
Após a colheita e até ocorrer morte celular, os frutos permanecem metabolicamente ativos, resultando em modificações na sua composição. Para certos produtos alimentares após a sua colheita, é utilizado um processo controlado de desidratação para induzir alterações físicas e químicas desejadas. No caso das uvas, um processo gradual de desidratação é normalmente utilizado para produção de uvas passas e para a produção de vinhos especiais e fortificados. Processos de desidratação do fruto, no global, causam alterações na textura, cor, sabor e valor nutricional dos alimentos devido a altas temperaturas e longa duração do processo. No entanto, existe escassa informação sobre as alterações metabólicas e mecanismos moleculares envolvidos na resposta a este processo.
Assim, com a finalidade de perceber melhor o metabolismo de uvas já colhidas, aplicamos um processo lento de desidratação similar ao utilizado industrialmente e colocamos cachos de uvas expostos a 50ºC durante onze dias. Varias técnicas de análise molecular e bioquímica foram utilizadas para averiguar os efeitos que tratamentos de desidratação após a colheita da uva, afetam provocam no seu metabolismo. As uvas passas perderam cerca de 40% do seu peso em água e
análises transcricionais por real time qPCR mostraram que a expressão de vários genes que
codificam aquaporinas (VvPIP2;1, VvTIP1;2 e VvSIP1) foi estimulada. Análises transcricionais realizadas por real-time qPCR, revelaram que a desidratação provocou um aumento da capacidade de transporte de açúcares do apoplasto do bago para as células, demonstrado pelo aumento dos
transcritos de transportadores de açúcares (VvHT1, VvSWEET11, VvSWEET15, VvTMT1). No
entanto, as concentrações de glucose, frutose e sacarose permaneceram praticamente inalteradas. As uvas desidratadas apresentaram também uma síntese de polióis aumentada, comprovada pela significativa concentração de sorbitol quantificada em uvas desidratadas. Também foi visível que o metabolismo dos ácidos nas uvas foi afetado, existindo alterações transcricionais e bioquímicas em enzimas-chave que levaram a uma degradação e consequente menor concentração dos ácidos orgânicos principais (malato e tartarato), de acordo com
quantificações por HPLC. Análises por real time qPCR a alguns genes chave do metabolismo
secundário (VvSTS1, VvCHS1, VvPAL1 e VvFLS1) sugerem uma estimulação de várias vias de
metabolismo secundário. No entanto uma sobreexpressão de maior magnitude do gene VvPRX31, que codifica uma peroxiredoxina, associada a degradação de fenólicos/antocianinas, poderá ter tido um papel na diminuição drástica da quantidade de fenólicos totais nas uvas passas. Em suma, todas estas alterações metabólicas demonstram que o processo de desidratação após colheita tem um forte impacto em várias vias metabólicas e mecanismos moleculares envolvidos no metabolismo primário e secundário das células do bago de uva.
Table of contents
Acknowledgments ... VII Abstract ... IX Resumo ... XI Table of contents ... XIII Abbreviations and acronyms ... XVI
1. Introduction ... 3
1.1. Grape berry development ... 4
1.2. Aquaporins in grape berry ... 4
1.3. Sugar transport in grapevine ... 5
1.3.1. Sugar transporters ... 5
1.3.2. Polyols in grape berry ... 7
1.4. Organic acids in the grape ... 7
1.4.1. The importance of malic acid and its metabolism ... 8
1.5. Phenolic compounds in grape berries ... 10
1.5.1. Nonflavonoids ... 10 1.5.2. Flavonoids ... 11 1.5.3. Phenolic biosynthesis ... 12 1.5.3.1. Biosynthesis of phenylpropanoids ... 13 1.5.3.2. Flavonoid pathway ... 13 1.5.3.3. Stilbene Pathway ... 15
2. Material and Methods ... 19
2.1. Grapevine field conditions and sampling ... 19
2.2. Quantification of total phenolics and anthocyanins ... 19
2.3. RNA extraction ... 20
2.5. Major Sugars and organic acids extraction and quantification by HPLC analyses ... 22
2.6. Malate quantification ... 22
2.7. Enzyme assays ... 23
2.7.1. Total protein extraction ... 23
2.7.2. Enzyme activity assays ... 23
2.8. Statistical analysis ... 24
3. Results ... 27
3.1. Phenological aspects of the grape berry during postharvest dehydration ... 27
3.1.1. Water content ... 27
3.1.2. pH ... 28
3.1.3. Chlorophylls and carotenoids ... 29
3.2. Modulation of aquaporin expression and water transport capacity ... 29
3.2.1. Plasma membrane aquaporin ... 29
3.2.2. Intracellular aquaporins ... 30
3.3. Modifications of sugar transport and metabolism in grape berries during postharvest dehydration ... 31
3.3.1. Transcriptional and metabolomic changes in sugar transport and metabolism ... 31
3.3.2. Transcriptional, metabolomic, and enzyme activity changes in sugar alcohol transport and metabolism ... 34
3.3.2.1. Polyol transport ... 34
3.3.2.2. Sorbitol ... 35
3.3.2.3. Mannitol ... 37
3.3.2.4. Galactinol ... 37
3.4. Modifications of organic acids metabolism in grape berries during postharvest dehydration ... 38
3.4.2. Enzyme activity and transcriptional changes of molecular mechanisms involved in
malate synthesis ... 39
3.4.3. Enzyme activity and transcriptional changes of molecular mechanisms involved in malate degradation ... 40
3.5. Modifications of secondary metabolism during postharvest dehydration ... 41
3.5.1. Transcriptional changes in phenylpropanoids pathway ... 42
3.5.2. Transcriptional changes in stilbene pathway ... 43
3.5.3. Transcriptional changes in flavonoids pathway – flavonol biosynthesis ... 43
3.5.4. Concentration of total phenolics and anthocyanins ... 44
3.5.5. Degradation of phenolics ... 45
4. Discussion ... 49
4.1. Postharvest dehydration leads to morphological changes in grape berry and enhancement of water transport capacity ... 49
4.2. Postharvest dehydration improved sugar transport capacity in berries ... 50
4.3. Enhancement of polyol accumulation in grape berries subjected to postharvest dehydration ... 51
4.4. The concentration of major organic acids decrease during postharvest dehydration as result of molecular changes in organic acid metabolism ... 52
4.5. Phenolic compounds are degraded during postharvest dehydration in grape berries despite apparently increased synthesis capacity ... 53
Abbreviations and acronyms ATP C4H CHI CHS CoA cwINV DAHPs DW DTT E4P FLS FW HPLC-RI LDOX MDH ME OAA PAL PEP PIPs qPCR RFOs SIP STS TCA TIP Adenosine triphosphate Cinnamic acid 4-hydroxylase Chalcone isomerase
Chalcone synthase Coenzyme A Cell wall invertase
Deoxy-D-arabino-heptulosonate7-phosphate synthase Dry weight Dithiothreitol D-erythrose 4-phosphate Flavonol synthase Fresh weight
High-performance liquid chromatography - refractive index detector Leucoanthocyanidin dioxygenase Malate dehydrogenase Malic enzyme Oxaloacetate Phenylalanine ammonia-lyase Phosphoenolpyruvate
Plasma membrane intrinsic protein
Real-time qualitative polymerase chain reaction Raffinose family oligosaccharides
Small basic intrinsic protein Stilbene synthase
Tricarboxylic acid
Tonoplast intrinsic protein VvHT
VvSUC VvTMT
Hexose transporter Sucrose transporter
1. Introduction
Grapevine (Vitis vinifera L.) is a woody perennial plant that predominates in Mediterranean climates and has great importance from an economic point of view as the most cultivated fruit plant in the world. According to the International Organization of Vine and Wine, there are more than 7.5 million hectares of vineyards, while 270 million hectoliters of wine is produced each year (Chaves et al. 2010; Berdeja et al. 2015; Ferreira et al. 2016).
Besides wine production, its fruit is used mostly for dietary purposes, whereas seeds and leaves are used in herbal medicine and food supplements (Fraternale et al. 2016). The grape berry is a non-climacteric fruit with relatively high sugar and moisture content very sensitive to microbial spoilage during storage after harvest. Thus, they must be consumed or processed into various products, like dried grapes, in a few weeks in order to reduce economic losses (Adiletta et al. 2016).
A gradual dehydration process (either by open sun, shade or mechanical drying) is normally utilized for raisin and high quality wine production, with particular and differentiated characteristics such as sweet and fortified wines. Raisins are rich in nutritional content and its production is presently a growing export business in many countries. According to the United States Department of Agriculture, the world raisin production is approximately of 1.3 million ton and wines from dehydrated grapes is trending up, particularly in Italy, composing a novel niche in the winemaking industry (Adiletta et al. 2016; Pangavhane and Sawhney, 2002; Wang et al. 2015; Noguerol-Pato et al. 2012). After harvest and until cell death, fruits remain metabolically active, resulting in compositional modifications. For certain food products, postharvest controlled stresses are applied to induce desired physical or chemical changes. In general, applied dehydration causes changes in texture, color, taste and nutritional value of food due to the combination of high temperatures and water loss caused by the long drying times required in the process (Schreiner an Huyskens-Keil, 2006; Rizzini et al. 2009). These changes suggest that an applied post-harvest dehydration process might strongly influence important primary and secondary metabolic pathways of grape berry cells, such as sugar post-phloem transport and metabolism, organic acids metabolism and phenolics biosynthesis and/or degradation, which are all key metabolic pathways strongly associated with the quality of berries. However, concrete information on how the molecular mechanisms involved in these metabolic pathways are changed during post-harvest dehydration is still somewhat limited.
4
1.1. Grape berry development
Until the final phenological and biochemical characteristics of a fully ripe grape berry ready to be harvested and dehydrated, an immense set of biochemical and physiological processes occur during grape berry development in the plant. Grape berry growth is sustained by import of carbohydrates, mineral nutrients and water, while different components (amino acids, pigments and other compounds) are mostly synthesized within the berry. Berry development can be divided into two phases I and II separated by one lag stage, which is characterized by a slow or inexistent growth and loss of chlorophyll (Gerós et al., 2012).
During the first phase of development, which occurs after fruit-set and during the first weeks of development, there is a massive cell division and cell expansion in the pericarp of the grape. The berry is characteristically firm and green due to the high presence of chlorophyll (Conde et al. 2007).
At the beginning, there is an accumulation of tartaric acid, mostly in the periphery of the berry, while malic acid accumulates in the flesh cells at the end of this first stage. Thereafter, a second growth phase occurs that coincides with the beginning of ripening (veraison). This phase is characterized by softening and change in skin color of the grape berries, mainly due to an increase of synthesis and accumulation of anthocyanins. Moreover, fruit doubles in size, sugar is accumulated and there is a decline of organic acid content (Conde et al., 2007; Liang et al., 2011).
1.2. Aquaporins in grape berry
Water is by far the most abundant constituent in grape berries (75-85%) and is the main solvent of solutes like sugars, organic acids and phenolic compounds (Ribéreau-Gayon et al. 2006). Before veraison, berry water is provided by the phloem and the majority, by the xylem. In the final growth stage of the berries, the phloem provides almost the total of berry water requirements, however, it has to cross the biological membranes and the hydraulic conductivity of the membranes is controlled mainly by the presence of specialized proteins (aquaporins) that belong to the major intrinsic proteins (MIP) family. Aquaporins are essential in cell to cell water flow regulation and in the hydraulic conductivity of the plasma membrane and tonoplast (Alleva et al. 2006; Maurel et al. 1997; Sutka et al. 2005). For these reasons, they are very important molecular mechanisms in the response of plant cells to water deficit or dehydration, among other abiotic stresses. The MIP superfamily in plants had been originally divided into four subfamilies: the plasma membrane intrinsic proteins (PIPs), tonoplast intrinsic proteins (TIPs), nodulin-like intrinsic proteins (NIPs) and
the small basic intrinsic proteins (SIPs) (Forrest and Bhave, 2007). Recently, another subfamily called the X intrinsic proteins (XIPs) has been identified, with members in a number of dicotyledonous plants including tomato (Sade et al. 2009) and grapevine (Danielson and Johanson, 2008).
1.3. Sugar transport in grapevine
In grapevine, sugars (mostly sucrose and monosaccharides) are important for grape berry development and quality due to their role as primary carbon and energy source (Agasse et al. 2009). Besides these functions, these metabolites also play a role as osmotic and signaling molecules (Afoufa-Bastien et al. 2010) important in the plant development and responses to biotic or/and abiotic factors (Lemoine et al. 2013). For that, sugar transport is a fundamental process in which photosynthetic leaves (as sources) provide carbohydrate resources to the heterotrophic (sink) tissues, supporting their growth and development (Afoufa-Bastien et al. 2010).
Once inside the phloem, sucrose transport is motivated by hydrostatic pressure and difference of concentration between source and sink organs, like grapes, where sugars are then unloaded from the phloem (Lalonde et al. 2004). The amount of glucose and fructose accumulated over ripening is roughly similar, suggesting that sucrose is hydrolyzed by the action of invertase or sucrose synthase during this long transport to the vacuole of flesh cells (Conde et al. 2007; Agasse et al. 2009).
1.3.1. Sugar transporters
Sugar transport is mediated by a set of transporters which are implicated in basic metabolic pathways, transfer of these solutes within and between cells, and intermediate long-distance transport between tissues and organs. Sugar accumulation is a major factor in winemaking industry due to the organoleptic properties sugars confer and because they are precursors for the production of ethanol during wine fermentation (Conde et al. 2007).
After veraison and during ripening, berries accumulate practically equal amounts of glucose and fructose (the major soluble sugars in grape berry), suggesting that sucrose is hydrolyzed for the storage into the vacuole of mesocarp cells (Agasse et al. 2009). The allocation of sucrose into source and sink cells is controlled by sugar transporters mediating the transport of sucrose, as the case of VvSUCs (Howell et al. 1994; J S Hawker 1969) and also putatively by some transporters belonging to the SWEET transporters family, like VvSWEET11 and VvSWEET15. Reducing monosaccharides are
6
also allocated into sink cells by the action of hexose transporters, as VvHT1 (Zhang et al. 2006;
Afoufa-Bastien et al. 2010). These transporters act as sugar/H+ symporters and belong to the major
facilitator superfamily in which members share a common structure of 12 transmembrane domains connected by hydrophilic loops (Chong et al. 2014). Monosaccharides are stored in the vacuole via tonoplast monosaccharide transporters (like VvTMT1).
In the mesocarp of grape berries, the phloem unloading occurs initially through a symplastic route that involves passive movement via plasmodesmata. However, an apoplastic unloading is highly suggested in the final ripening stages of the berry, when high sugar concentrations are found in the berry apoplast (Patrick, 1997; Wang, 2003). Zhang and coworkers (2006) demonstrated that a shift from symplastic to apoplastic unloading occurs at or just prior to the onset of ripening. Enzymatic hydrolysis of sucrose within sink organs by cell wall invertase (cwINV) and the uptake of residual sucrose by symporters appear to maintain simultaneously low sucrose levels and high hexose levels in the apoplast (Wada et al. 2008). Import of sucrose across the plasma membrane may occur via sucrose symporters (SUC). Sucrose can also be hydrolyzed and he hexoses resulting from this invertase activity (glucose and fructose) are then be transported across the plasma membrane of storage cells by monosaccharide transporters, like the hexose transporters VvHTs, and subsequently stored in vacuole through tonoplast monosaccharide transporters (TMTs) as VvTMT1 (Figure 1).
Figure 1. Speculative model for sugar uptake into berries after veraison. Single, yellow triangles
SWEET transporter; cwINV, cell wall invertase; SUC, sucrose transporter; HT, hexose transporter; TMT, tonoplast monosaccharide transporters.
1.3.2. Polyols in grape berry
Plants have developed complex biochemical and physiological systems to mitigate the negative effect of abiotic stresses. Present in all living forms (Noiraud et al. 2001), polyols (or sugar alcohols) are an example of organic molecules accumulated that protect the cells against harmful osmotic and metabolic imbalances caused by different stresses (Pillet et al. 2012; Agasse et al. 2009). Sugar alcohols are closely related to sugars, as they represent the chemically reduced form of an aldose or ketose sugar.
Mannitol, formed by six carbons, is the most abundant polyol in nature and its accumulation is essential for salt/osmotic stress tolerance in Olea europaea and for the protection against heat stress-induced oxidative damage and excessive solar irradiance (Conde et al. 2011, 2015). Sorbitol is other polyol commonly found in nature, is a polyhydric alcohol with sweetness properties. In higher plants, is synthesized in mature leaves from glucose-6-phosphate by the consecutive activities of an aldose-6-P-reductase (Negm and Loescher, 1981) and a specific phosphatase. Sorbitol accumulation also contributed to increased salt/water deficit tolerance in various fleshy fruits (Conde et al. 2015). In grapevine’s mannitol and sorbitol metabolism, the NAD-dependent enzymes mannitol dehydrogenase (MTD) and sorbitol dehydrogenase (SDH) are crucial in regulating the pool of these polyols, as they are responsible for catalyzing their oxidation. Also, in grapevine berries, galactinol and raffinose family oligosaccharides (RFOs) are compatible solutes and additionally may act as signaling molecules that mediate stress responses. RFOs are synthesized from sucrose by subsequent additions of activated galactose moieties donated by galactinol. (Pillet et al. 2012).
1.4. Organic acids in the grape
Organic acids are present in all plants, supporting various and different aspects of cellular metabolism (Sweetman et al. 2009). Together with sugars, they represent the main soluble constituents of ripe fruits and have great influence in the organoleptic properties (flavour, color and aroma) of wines and grape juices (Mato et al. 2005). Moreover, organic acids metabolism has effect on the stability of fruit beverages, reduce microbial spoilage and lessen oxidation due to the low-pH
8 conditions. Immature berries are also preserved from early predation by their unpalatability to birds and other aggressors (Ford, 2012).
The majority of organic acids present in the fruits is synthesized in the flesh from imported sugars (Sweetman et al. 2009; Etienne et al. 2014) and can be used in the Krebs cycle (respiration), gluconeogenesis, fermentation to ethanol, amino acid synthesis/interconversion, and as a substrate for the synthesis of secondary metabolites such as pigments (Famiani et al. 2015).
Environmental factors and cultivation practices affect this metabolism and the organic acid content in flesh of fruits (e.g. temperature, light intensity, cultivar, rootstock, mineral nutrition, water availability, fruit load/pruning). However, how these modifications occur is in most cases uncertain (Etienne et al. 2014).
The sourness is generally attributed to proton release from acids, while the anion forms each contribute with a distinct taste. Acidity is also one of the main ripening indicators that determines the harvest date, particularly for fruits in which a small level of acidity is important for further processing (Sweetman et al. 2009; Johanningsmeier et al. 2005).
The variety of organic acids and the levels to which they accumulate are extremely variable and depend of species, developmental stages and tissue types (Walker et al. 2011). Berries of
grapevine V. vinifera are particularly unusual because accumulate significant concentrations of
tartaric and malic acid (despite progressive reduction in malate content during ripening), by far the predominant acids at all stages of development, that contribute to the pH and acidity of the grape beverages (Sweetman et al. 2014; Ford, 2012).
1.4.1. The importance of malic acid and its metabolism
Malic acid is an important plant metabolite, it is likely present in all cell types and is the principal acid in many fruits, both climacterics (like tomato, peach, apple and banana) and non-climacteric (as pineapple, lime, cherry and grape) (Sweetman et al. 2009). It has, moreover, showed influence over the stomatal aperture, improving plant nutrition and increasing resistance to heavy metal toxicity. Malate can also affect characteristics on wine through involvement in secondary processes such as carbonic maceration and malolactic fermentation, and can even alter the growth capabilities of malolactic bacteria (Schulze et al. 2002; Fernie and Martinoia 2009; Lee et al. 2008; Kunkee, 1991).
Malic acid is (after tartrate, that is not used in primary metabolic pathways,) the major organic acid accumulated during early berry development and the only high-proportion organic acid
actively metabolized throughout ripening of grape berry (Sweetman et al. 2009). Before veraison,
grapes accumulate this acid mostly through the metabolism of sugars translocated to the berry. In a post-veraison fruit, malate is catabolyzed by many pathways, like TCA cycle and respiration, gluconeogenesis, amino acid interconversions, ethanol fermentation, and the production of complex secondary compounds such as anthocyanins and flavonols (Famiani et al. 2000; Farineau, 1977; Ruffner, 1982). With the accumulation of sugars and inhibition of glycolysis in ripening grapes, malate is likely a vital source of carbon for these pathways (Ruffner and Hawker, 1977).
The enzymes NAD- or NADP-MDH are present in several cellular compartments. MDHs predominantly catalyze the reversible reduction of oxaloacetate to malate and are important in several metabolic pathways (Nunes-Nesi et al. 2007; Sweetman et al. 2014). However, if malate is abundant and OAA is further metabolized into compounds as PEP or aspartate, then MDH activity will favor the conversion of malate to OAA. Still, while the MDH reaction is reversible, affinities of the
mitochondrial (mMDH) and cytosolic (cytMDH) enzymes are higher for NADH and OAA than for NAD+
and malate, therefore favoring the synthesis of malate in vitro (Sweetman et al. 2009;
Taureilles-Saurel et al. 1995). Malic enzyme (ME) catalyzes the reversible reaction between malate and pyruvate, it is activated by fumarate and coenzyme A (CoA) and is potentially regulated via changes in aggregation state. The enzyme is formed by two subunits with similar primary sequence and in vitro studies have provided evidence that both subunits are required for activity. Malic enzyme can exist in a different of oligomeric forms (heterodimer, heterotetramer, and heterooctamer) and each has distinct kinetic properties (Day et al. 1984; Grover S. D and Wedding R. T, 1982). Depending on the isoform present, cellular conditions and the availability of substrates, is potentially involved in both malate synthesis and degradation. While NADP-ME is reversible, it directionality favors malate
degradation, and is dependent on post-translational regulators, including NAD(P)+/NAD(P)H ratio,
substrate availability and pH conditions (Franke and Adams, 1995). Furthermore, an intensification of NADP-ME activity has been observed during the ripening of grape berries (J.S. Hawker, 1969; Ruffner et al. 1976; Ruffner et al. 1984), supporting a role for this enzyme in malate degradation.
10
1.5. Phenolic compounds in grape berries
Secondary metabolites have a fundamental role on plant defense mechanisms against biotic or abiotic stresses and are also important for plant growth and development. In grapevine, secondary metabolism has tremendous influence in wine production, as they contribute to color, flavor, aroma, texture, astringency, stabilization of wine and exhibit antioxidant properties (Costantini et al. 2006).
Grape berries accumulate a vast collection of phenolic compounds, mostly polyphenols, that differ according to the varieties and the environments where the cultivar grows. The composition of grape berries strongly affects the properties and sensory qualities of wine, particularly phenolics, that also have beneficial effects in many aspects of human health (Corder et al. 2006; Jang et al. 1997). Phenolic compounds consist in molecules with one or more hydroxyl (OH) substituents bonded to a six-carbon (C6) aromatic ring. They are divided in two major groups, nonflavonoid phenolics and flavonoids (Teixeira et al. 2013).
1.5.1. Nonflavonoids
Nonflavonoids include hydroxybenzoic acids, hydroxycinnamic acids, volatile phenols and stilbenes. Except for hydroxycinnamic acids (p-coumaric, caffeic and ferulic acids), that are the third most abundant class of soluble phenolics, nonflavonoids are present in berry in low concentration (Adams, 2006). Mostly founded in the free form, the major hydroxybenzoic acids in grape are gentisic, salicylic, gallic and p-hydroxybenzoic acids (Pozo-Bayón et al. 2010). Gallic acid is the most represented hydroxybenzoic acid, which is found free and conjugated with acyl substituent of flavan-3-ols. Other benzoic acids such as protocatechuic, vanillic, and syringic acids were reported in Riesling wine from Germany (Baderschneider and Winterhalter, 2001).
Stilbenes are low molecular weight phenolics present naturally in a large number of edible
plants, including several species of genus Vitis, like V. vinifera. Their biosynthesis increase from
veraison to ripening and possess antifungal activity, allowing plants to deal with pathogen attacks (Langcake and Pryce, 1977; Bavaresco et al. 2009). Some stilbenes present in grape berries, particularly resveratrol, have been long studied and known for their benefits to human health (Aggarwal and Shishodia, 2006).
1.5.2. Flavonoids
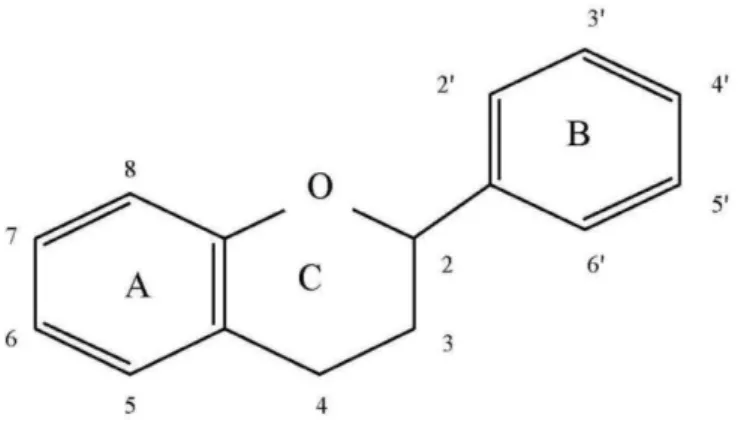
Flavonoids are C6-C3-C6 polyphenolic compounds, with two hydroxylated benzene rings (A and B) connected by a tree carbon chain that is part of a heterocyclic C ring (Figure 2). Depending of the oxidation state of the C ring, flavonoids can be divided in flavonols, flavan-3-ols and anthocyanins (Downey et al. 2003). The composition and concentration of flavonoids in grapes is highly variable and modulated by external biotic and abiotic factors (Bavaresco et al. 2009).
Flavonols are products of the flavonoid biosynthetic pathway, further described ahead, and are mainly synthesized in the grape skin. Their most widespread roles in plant appear to be as UV protectants localized in the upper epidermis and as copigments with the anthocyanins in flowers and fruit (Mattivi et al. 2006; Downey and Rochfort, 2008). Copigmentation is an association between flavonols and the anthocyanin pigments that confers stability on the coloured form of the anthocyanin molecule resulting in increased colour (Downey et al. 2003). Of the three main flavonols, kaempferol, quercetin and myricetin, mainly quercetin-3-O-glucoside and -3-O-glucuronide are found in grape berries (Price et al. 1995).
Flavan-3-ols are the most abundant phenolics in grape berries and various terms have been used to describe these compounds in the literature, however proanthocyanidins and condensed tannins (their polymeric form) are used more frequently (Aron and Kennedy, 2008). Flavan-3-ols are characterized by the presence of a hydroxyl group at the 3 position of the C ring (Figure 2) and are detectable in every part of the berry, despite being more concentrated in seeds, followed by skin and in a lesser extent in berries’ flesh. Nowadays, the general role of these compounds in plants is related to their protection against harmful intruders such as microbes, fungi, insects and herbivorous animals, due to their astringent properties (Aron and Kennedy, 2008; Verries et al. 2008; Pfaffl, 2001; Mattivi et al. 2006). Proanthocyanidins have also influence in wine properties and are responsible for the grape skin organoleptic properties such as astringency and bitterness (Teixeira et al. 2013).
Anthocyanins in berries comprise a large group of water-soluble pigments and are found mainly in the external layers of the hypodermis (the skin) (Szajdek and Borowska, 2008). They are derivatives of the flavylium cation and are synthesized from anthocyanidins by glycosylation at the 3 and 5 positions of the C ring (Janvary et al. 2009). These secondary metabolites are responsible for the pigmentation red, blue and purple of plant tissues. Anthocyanins play an important role in plant reproduction, by attracting pollinators and seed dispersers, and also in protection from
photo-12 oxidative stress (Winkel-Shirley, 2002). In grapes, the large amounts of anthocyanins accumulated, contribute to the sensory attributes of wine. Furthermore, considerable attention has been paid to the health benefits of anthocyanins, since epidemiological investigations have indicated that the moderate consumption of anthocyanin-rich products such as red wine is associated with a lower risk of cardiovascular disease (Hou, 2003; Mori et al. 2007) Anthocyanins are synthesized in the cytosol of the epidermal cells and then stored in the vacuole (Fontes et al. 2011; Braidot et al. 2008).
Figure 2. Flavonoid C6-C3-C6 skeleton. Two hydroxylated benzene rings (A and B) connected by a three carbon chain that is part of a heterocyclic C ring.
1.5.3. Phenolic biosynthesis
The amino acid phenylalanine is the precursor of all phenolics through the phenylpropanoid and flavonoid pathways. Phenylalanine derive from the shikimate pathway, which connects carbohydrate metabolism with the biosynthesis of aromatic amino acids and secondary metabolites (Sparvoli et al. 1994).
Phenylpropanoids contribute to all aspects of plant responses towards biotic and abiotic stimuli. They are indicators of plant stress responses upon variation of light or mineral treatment and are also key mediators of the plants resistance towards pests (La Camera et al. 2004). Phenylpropanoid-based polymers, like lignin, suberin, or condensed tannins, contribute substantially to the stability and robustness of gymnosperms and angiosperms towards mechanical or environmental damage, like drought or wounding (Vogt, 2010).
1.5.3.1. Biosynthesis of phenylpropanoids
In the phenylpropanoid pathway, three enzymatic transformations redirect the carbon flow from primary metabolism converting phenylalanine into 4-coumaroyl-Coa. Firstly, deamination by phenylalanine ammonia-lyase (PAL) forms the phenylpropanoid skeleton, producing cinnamic acid. Cinnamic acid 4-hydroxylase (C4H) catalyzes the introduction of a hydroxyl group at the para position
of the phenyl ring of cinnamic acid, producing p-coumaric acid. The carboxyl group of p-coumaric
acid is then activated by formation of a thioester bond with CoA, a process catalyzed by
p-coumaroyl:CoA ligase (4CL), forming 4-coumaroyl-CoA.
Stilbene and flavonoid pathways begins with the end product of phenylpropanoid pathway, 4-coumaroyl-CoA, that is substrate to both stilbene synthase (STS) and chalcone synthase (CHS) (Figure 3). Various phenylpropanoid pathway intermediates are also diverted into biosynthetic pathways for benzoic acid, salicylic acid, and coumarins.
Figure 3. Phenylpropanoid pathway. PAL, phenylalanine ammonia lyase; C4H, cinnamate-4-hydroxylase; 4CL, 4-coumaroyl:CoA-ligase; CHS, chalcone synthase; STS, stilbene synthase (Flamini et al. 2013).
1.5.3.2. Flavonoid pathway
The biosynthesis of flavonoids (Figure 4) is the culmination of two metabolic pathways, the shikimate’s (that has phenylalanine as product) and the phenylpropanoid’s.
14 Chalcone synthase (CHS) is responsible for the first step of the flavonoid pathway, synthetizing tetrahydroxychalcone from one molecule of 4-coumaroyl-CoA and three molecules of malonyl-CoA. Chalcone isomerase (CHI) ends the formation of the molecular structure to produce naringenin, which may undergo different hydroxylations through various enzymes forming dihydroflavonols. This dihydroflavonols serves as subtracts to the flavonol synthase (FLS) that catalyzes the formation of the flavonols kaempferol, quercetin, and myricetin. The formation of anthocyanins and flavan-3-ols also derives from dihydroflavonols (Gerós et al. 2012). Firstly, dihydroflavonols are reduced into flavan-3,4-ols (leucoanthocyanidins) that are posteriorly converted into anthocyanidins by the enzyme leucoanthocyanidin dioxygenase (LDOX) (Gollop et al. 2001).
Anthocyanidins are unstable and can be stabilized by a glycosylation reaction, catalyzed by UDP-glucose flavonoid 3-O-glucosyltransferase (UFGT), which results in anthocyanin production and is the last biosynthetic step of anthocyanin synthesis and the final part of the flavonoid pathway.
Figure 4. Simplified diagrammatic representation of the flavonoid biosynthetic pathway. Enzymes for each step are shown in bold. Flavonoid intermediates are boxed and principle flavonoid end products are in gray boxes. CHS, Chalcone synthase; CHI, chalcone isomerase; F3H, flavanone3 -hydroxylase; DFR, dihydroflavonol-4-reductase; LDOX, leucoanthocyanidin dioxygenase; UFGT, UDP-glycose:flavonoid-3-O-glycosyltransferase for anthocyanin synthesis. The unidentified enzyme encoding a glycosyl transferase for flavonol glycone synthesis is referred to as GT (Takos et al. 2006).
1.5.3.3. Stilbene Pathway
Plant stilbenes are derived from the general phenylpropanoid pathway. All higher plants seem to be able to synthesize malonyl-CoA and CoA-esters of cinnamic acid derivatives, but only few plant species are able to produce stilbenes (Chong et al. 2009).
Stilbene synthase (STS) is characteristic of stilbene-producing plants and controls the first step of the stilbene pathway, competing with CHS for the same substrate, 4-coumaroyl-CoA. STS catalyzes three reactions of condensation of 4-coumaroyl-CoA with 3 molecules of malonyl-CoA producing resveratrol. This resveratrol has a different ring folder, compared to tetrahydroxychalcone, the product of CHS, since the terminal carboxyl group is removed prior to closure of the A ring.
Objectives
As mentioned above, postharvest dehydration is a stressing event that induces significant modifications in the metabolism of fruits, affecting total amounts of compounds essential to the quality of berries, including sugar, phenolics, organic acids, amino acids, mineral elements, and pigments. Unlike preharvest water stress, limited information is available on the specific processes triggered by typically industrial postharvest dehydration of grape berries and the regulatory mechanisms involved in these changes.
Given that, the purpose of this study was to analyze particular metabolic changes during this process using molecular and biochemical analyses to understand the role of sugar transporters, which are involved in sugar allocation from berry apoplast into the cells, aquaporins (VvSIP1 and VvXIP1), and polyol transporters during the dehydration process. Moreover, the metabolism of organic acids and secondary metabolites (phenolics – phenylpropanoids, stilbenes), due to their relevance in berry/wine flavor; and of polyols, due to their involvement in water deficit stress tolerance, were also thoroughly investigated.
To accomplish these objectives, we recurred to a combination of several techniques including RNA extraction and transcriptional analyses by real-time qPCR, protein extraction and enzymatic activity measurements, and metabolite (sugars, acids, polyols, phenolics, anthocyanins) extraction and quantification by HPLC among other biochemical and cell biology approaches.
2. Material and Methods
2.1. Grapevine field conditions and sampling
Clusters of Vitis vinifera cv. Sémillon, a golden-skinned grape used to make dry and sweet white wines, mostly in France and Australia, were harvested from a commercial vineyard in Fafe, north of Portugal. In this region the climate is typically Mediterranean, with a warm temperate climate, dry and hot summers, and with higher precipitation during autumn and winter (Kottek et al. 2006). Vineyard was managed without irrigation and grown following standard cultural practices applied in commercial farms.
The grape clusters (sound berries and uniform size) were randomly, carefully and representatively harvested and, subsequently, a set of grape clusters were placed in small perforated boxes where they were subjected in laboratorial conditions to an industry-mimicking slow dehydration process at 50ºC for eleven days, while other set was immediately frozen in liquid nitrogen (control). Sampling was performed after five days and eleven days of dehydration, by collecting randomly and representatively berries from the dehydrated clusters and immediately freezing them in liquid nitrogen. None of the clusters or individual berries presented signs of fungal contamination. Berries were ground to a fine powder under liquid nitrogen refrigeration and stored in -80°C for posterior studies.
2.2. Quantification of total phenolics and anthocyanins
The concentration of total phenolics and anthocyanins was performed as described in our previous work (Conde et al. 2016). Briefly, the concentration of total phenolics was quantified by the Folin-Ciocalteu colorimetric method in berries from all experimental conditions. Total phenolics were extracted in 1.5 mL of pure methanol from 100 mg of berry grounded tissue. The homogenates were vigorously shaken for 15 min and subsequently centrifuged at 18000 xg for 20
min. Twenty μL of each supernatant were added to 1.58 mL of deionized water and 100 μL of
Folin reagent, vigorously shaken and incubated for 5 min in the dark before adding 300 μL of 2M
sodium carbonate. After 2 h of incubation in the dark, the absorbance of the samples was measured at 765 nm. Total phenolic concentrations were estimated using a gallic acid calibration curve and represented as gallic acid equivalents (GAE). Anthocyanins were extracted from 150 mg of grape berry grounded tissue with 1 mL of 100% acetone. The suspension was vigorously shaken
20 for 30 min. The homogenates were centrifuged for 20 min at 18000 xg and the supernatants were collected. Anthocyanin extracts were diluted 1:10 in 25 mM potassium chloride solution pH 1.0 and absorbance was measured at 520 nm and 700 nm, using 25mM potassium chloride solution pH 1.0 as blank. Total anthocyanin quantification was calculated in relation to cyanidin-3-glucoside equivalents, calculated by equation 1, per DW:
[� � � ℎ ��� � ] � �⁄ = �520−�700 ×��×��×
�× (1)
where MW is the molecular weight of cyanidin-3-glucoside (449,2 g mol-1), DF is the dilution factor
and ε is the molar extinction coefficient of cyanidin-3-glucoside (26900 M-1 cm-1).
2.3. RNA extraction
A total of 200 mg of grape berry tissue previously grounded in liquid nitrogen was used for total RNA extraction following the protocol by Reid and coworkers (2006) in combination with purification with RNeasy Plant Mini Kit (Qiagen). After treatment with DNase I (Qiagen), RNA integrity was confirmed running the samples in 1% agarose gel stained with SYBR Safe (InvitrogenTM, Life Technologies). cDNA was synthesized from 1 µg of total RNA using Omniscript Reverse Transcription Kit (Qiagen).
2.4. Transcriptional analyses by real-time qPCR
Real-time PCR analysis was performed with QuantiTect SYBR Green PCR Kit (Qiagen) using 1 μL cDNA (diluted 1:10 in ultra-pure distilled water) in a final reaction volume of 10 μL per well. For reference gene, VvGAPDH (glyceraldehyde-3-phosphate dehydrogenase) was selected, as this gene was proven to be very stable and ideal for qPCR normalization purposes in grapevine (Reid et al. 2006). Specific primer pairs used for each target or reference gene are listed on Table 1. Melting curve analysis was performed for specific gene amplification confirmation. The expression values were normalized by the average of the expression of the reference genes as described by Pfaffl (2001). For all experimental conditions tested, one or two independent runs with triplicates were performed.
Table 1 Primers forward (F) and reverse (R) used for gene expression analysis by real-time qPCR.
Gene Acession Number
(Genoscope) Primers Ref. Primers
VvCHS1 GSVIVT00037967001 (8x) F: 5′-CGAGCTCACCACCGAGCACCTTACCT-3′ Boubakri et al. (2013) R: 5′-CCGCTCGAGTGTTGGCTACCTGCTTCACT-3′
VvFLS1 GSVIVT00015343001 F: 5’-CAGGGCTTGCAGGTTTTTAG-3’ Boubakri et al.
(2013) R: 5’-GGGTCTTCTCCTTGTTCACG-3
VvGAPDH GSVIVT00009717001 F: 5’-CACGGTCAGTGGAAGCATCAT-3’ Conde et al.
(2014) R: 5’-CCTTGTCAGTGAACACACCAG-3
VvcytMDH GSVIVT01028332001 F: 5’-TGGAACTCCAGAGGGAACTTGG-3’ Sweetman et
al. (2009) R: 5’-TCTTCCATTCTCCAGCACAGCAAG-3’
VvmytMDH GSVIVG01021185001 F: 5’-TGTACCAGTTGTTGGTGGTCACG-3’ Sweetman et
al. (2009) R. 5’-TGTTGGATTTCGGTGTGGCTTG-3’
VvmytME GSVIVT01026824001 F: 5’-TTCTCGAAGATCGCCTTTGTGG-3’ Sweetman et
al. (2009) R: 5’-TGAACTCCAAGGTCACCCAGAC-3’
VvPIP2;1 GSVIVT01016276001 F: 5’-TCAAGGCTCTTGGGTCATTCAGG-3’ Fouquet et al.
(2008) R: 5’-CAATTGGAAGAGGTGCCAGAACTC-3’
VvTIP1;2 GSVIVT01033677001 F: 5’-TTCGTGATCGCTGATCTTTCCAC-3’ Fouquet et al.
(2008) R: 5’-CAAACGCGTTCCACACTGTCAC-3’
VviPRX31 VIT_14s0066g01850
(UniProt)
F: 5’-ATGGCATTGATCCTCTTTTC-3’ Movahed et al.
(2016) R: 5’-CTAGTTTAAGGCATCACACC-3’
VvPLT1 GSVIVT01031930001
F: 5’-GGGGACAAGTTTGTACAAAAAAGCAGGCT
CTGAGATGGCTACAGGGAA-3’ Conde et al.
(2014) R: 5’-GGGGACCACTTTGTACAAGAAAGCTGGGT
TCATCCATTAGTTCCTAATTGAATC-3’
VvTMT1 GSVIVG01009024001 F: 5’-GTTGCCGTCAACTTCGCAAC–3 Hayes et al.
(2007) R: 5’-GAAGGAATTTAGCTATGGCAGAG-3’
VvSWEET11 GSVIVT01010993001 F: 5’-GGGACGTGCATAGAAGCTACA-3’ Chong et al.,
(2014) R: 5’-GCAGACCCAACCGACTATCTT-3
VvGOLS1 GSVIVT01028174001 F: 5′-TGATTACAGCAGTGTTTTGCC-3 Pillet et al.
(2012) R: 5′-CGAGAGTACTGGCCTCTTCTAG-3′
VvcwINV GSVIVG01016869001 F: 5'-ATGAATCATCTAGTGTGGAGCAC-3' Hayes et al.
(2007) R: 5'-CTTAAACGATATCTCCACATCTGC-3
VvPAL1 GSVIVG01025703001 F: 5′-CCGAACCGAATCAAGGACTG-3 Boubakri et al.
(2013) R: 5′-GTTCCAGCCACTGAGACAAT-3′
22
VvSTS1 GSVIVT01010590001 F: 5′-CGAAGCAACTAGGCATGTGT-3 Boubakri et al.
(2013) R: 5′-CTCCCCAATCCAATCCTTCA-3′
VvHT1 GSVIVG01003181001 F: 5’-TCGGAGTGGATGGAGAACCTTG-3’ Hayes et al.
(2007) R: 5’-GACATCACCACCACAAAGAAGGC-3’
2.5. Major Sugars and organic acids extraction and quantification by HPLC analyses
The extraction of sugars and organic acids from grapevine berry samples was adapted from a method described in (Eyéghé-Bickong et al. 2012). Extracts were obtained adding 800 µL of
dH2O and 5% (w/v) insoluble PVPP to 80mg of grape berry frozen powder and by vigorously
vortexing. An equal volume of chloroform (800 µL) was added to the mixture and the biphasic solvent was vortexed for 5 min to mix and incubated at 50ºC for 30 min with continuous shaking. After incubation, the samples were centrifuged at 17,500 xg for 10 min at room temperature to recover the upper aqueous phase containing the sugars and organic acids. The aqueous phase was re-centrifuged (as above) to remove any residual cell debris. The supernatant was transferred to HPLC vials, after filtration, and crimp-sealed for HPLC analysis. Each grapevine sample was extracted in triplicate before HPLC analysis. Chromatographic analyses were carried out on a Hitachi Auto Sampler L-2200 Elite LaChrom chromatograph coupled to a Refractive Index (RI) detector. The injections were of 20 μL and the flow rate was kept constant throughout the analysis
at 0.5 mL min-1 at 60ºC. The HPLC column was a Rezex RCM monosaccharide Ca2+ (8%) and with
water as the mobile phase. Sugar, sorbitol and tartrate concentrations on each sample were determined by comparison of the peak area with established calibration curves of each compound (fructose, glucose, sucrose, sorbitol, glucose 6-phosphate and tartrate). Solid-phase extraction (SPE) was used to separate organic acids from sugars on the samples, prior to HPLC analysis, as per instructions of the manufacturer.
2.6. Malate quantification
Malate quantification was performed recurring to the Malate Assay Kit (Sigma-Aldrich), using 30 mg of grape berry tissue homogenized in 500 µL of water for 30 min and then centrifuged at 10000 xg for 10 min. As per manufacturer instructions, the supernatant was mixed with malate assay buffer to a final volume of 50 µL per well. The reaction mixes were set up in a 96-well plate
according to the industrial kit directions and after 30 min of incubation in the dark, the absorbance of the samples was measured at 450 nm in a plate reader. The malate concentrations were determined using a calibration curve.
2.7. Enzyme assays
2.7.1. Total protein extraction
Grape berry total protein was extracted using a method described by Stoop and Pharr (1993) with several modifications. Sample powder was thoroughly mixed with extraction buffer in an approximately 1:1 (v/v) powder buffer ratio. Protein extraction buffer contained 50 mM Tris-HCl pH 8.9, 5 mM MgCl2, 1 mM EDTA, 1 mM phenylmethylsulfonyl fluoride (PMSF), 5 mM dithiothreitol (DTT) and 0.1% (v/v) Triton X-100. The homogenates were thoroughly mixed and centrifuged at 18000 xg for 20 min and the supernatants were maintained on ice and used for all enzymatic assays. Total protein concentrations of the extracts were determined by the method of Bradford (1976) using bovine serum albumin as a standard.
2.7.2. Enzyme activity assays
Enzyme activity assays were performed as described by C. Sweetman and coworkers (2014) with some modifications. NAD-dependent cytosolic MDH activity was quantified as the rate of NADH oxidation at pH 6.0 (50 mM MES), in the presence of 5 mM oxaloacetate to ensure maximum velocity. NAD-dependent mitochondrial MDH activity was quantified as the rate of NAD reduction
at pH 7.4 (MOPS) in the presence of 2 mM MgCl2 and 10 mM malate to ensure maximum velocity.
NAD-dependent mitochondrial ME activity was quantified as the rate of NAD reduction at pH 7.4
(50 mM MOPS) in the presence of 8mM MnCl2 and 5 mM malate, to ensure maximum velocity.
Mannitol dehydrogenase (VvMTD) and sorbitol dehydrogenase (VvSDH) protein activity determination were carried out following Conde et al. 2015. VvMTD and VvSDH activity assays were performed at 37 ºC, in a total reaction volume of 1ml. The reaction mixtures contained protein
extract, 300 mM BIS-TRIS propane (pH 9.0), 1 mM NAD+, and 200 mM mannitol or 200 mM
d-sorbitol, for VvMTD or VvSDH activity respectively, to ensure maximum velocity. The reduction of
NAD+ was evaluated spectrophotometrically at 340 nm. All polyol oxidation reactions were initiated
24 were performed exactly like the mannitol oxidation assays, but using 200 mM fructose to start the reaction and 1 mM NADH as co-factor.
2.8. Statistical analysis
The results were statistically analyzed by Student’s t test using Prism vs. 5 (GraphPad Software, Inc.). For each condition, statistical differences between mean values are marked with asterisks (* P < 0.05; ** P < 0.01; *** P < 0.001).
3. Results
3.1. Phenological aspects of the grape berry during postharvest dehydration
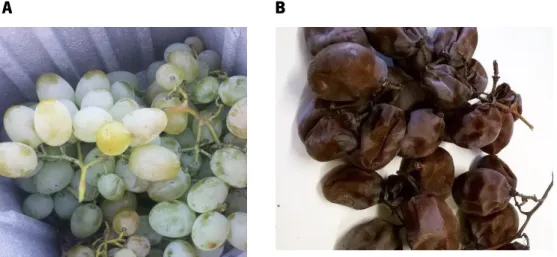
As motioned in material and methods section, a slow dehydration process was applied to intact berry clusters for eleven days at 50ºC and, consequently, changes in their phenological aspect were visible. With clear signals of dehydration, the grapes lose their initial appearance becoming darker and wrinkled as we can see in the Figure 5, and become noticeably sweeter. No fungal infection symptoms were visible.
Figure 5. Grape berry clusters immediately after harvest (A) and after dehydration (B). Grapes berries were subjected to eleven days of a slow postharvest dehydration process at 50oC.
3.1.1. Water content
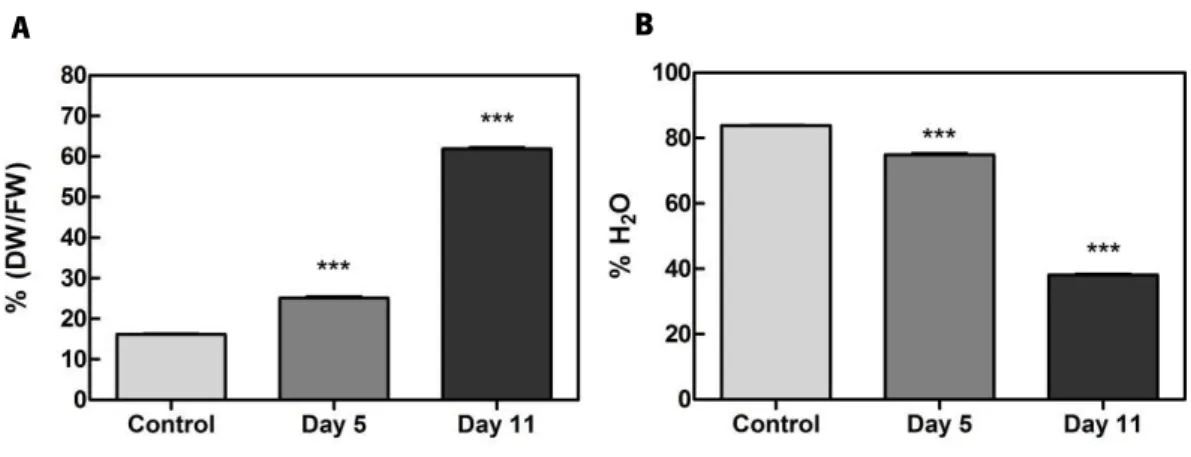
To evaluate the effect of dehydration in the water content, berry clusters’ weight was measured before treatment (control), 5 days into the postharvest dehydration process and at the end of the treatment after 11 days. As reported in Figure 6, there was an increase of more than 3-fold in the dry weight-to-fresh weight ratio after day 11, when DW composed about 60% of total berry FW (Figure 6A). Inherently, water content progressively diminished from an initial 83% to just about 37% after postharvest dehydration (Figure 6B).
28
Figure 6. Effect of postharvest dehydration on water content of grape berries.
(A) Dry weight (DW)-to-fresh weight FW ratio expressed in percentage; (B) Percentage of berry water content; Measurements were made in grape berry tissues subjected to five and eleven days of dehydration process and without treatment (control). Values are the mean ±SEM. Asterisks indicate statistical significance (Student’s t-test; ***P<0.001).
3.1.2. pH
One of the strongest relationships between temperature and fruit quality occurs with grape berry acidity, whereby high temperatures reduce the concentration of organic acids (Sweetman et al. 2014). For that reason, pH values of grape berries subjected to dehydration process and without treatment (control) were measured. As shown in Figure 7, pH values of dehydrated grapes subjected to 5 days and 11 days of treatment were higher (4.1 and 4.0, respectively) when compared to the control (3.7).
Figure 7. Effect of postharvest dehydration on the pH of grape berries. Measurement was made in grape berry tissues subjected to five and eleven days of dehydration process and without treatment (control). Values are the mean ±SEM. Asterisks indicate statistical significance (Student’s t-test; **P<0.01).
3.1.3. Chlorophylls and carotenoids
The quantification of photosynthetic pigments was accomplished according to Lichtenthaler and Buschmann (2005). The concentration of pigments, both carotenoids (Figure 8A) and total chlorophylls (Figure 8B), was lower in grape berries subjected to five (0.003 µg mg
DW-1) or eleven days (0.004 µg mg DW-1) of dehydration process when compared to grapes without
treatment (control) (0.01 µg mg DW-1).
Figure 8. Effect of postharvest dehydration on the concentration of photosynthetic pigments in grape berries. Pigments were extracted from grape berry tissues subjected to five and eleven days of dehydration process and without treatment (control). The extracts were subsequently analyzed by spectrophotometry and pigment quantification was performed according to equations described in Material and Methods section. Concentration of carotenoids (A) and total chlorophylls (B) in samples extracts are expressed and µg per mg of DW. Values are the mean ±SEM. Asterisks indicate statistical significance (Student’s t-test; *P<0.05; **P<0.01).
3.2. Modulation of aquaporin expression and water transport capacity
Aquaporins are membrane water channels that play critical roles in controlling cellular and tissue water movement as well as content (Fouquet et al. 2008). As we had significant water content variation in dried grapes, we assessed the gene expression of some plasma membrane and intracellular aquaporins.
3.2.1. Plasma membrane aquaporin
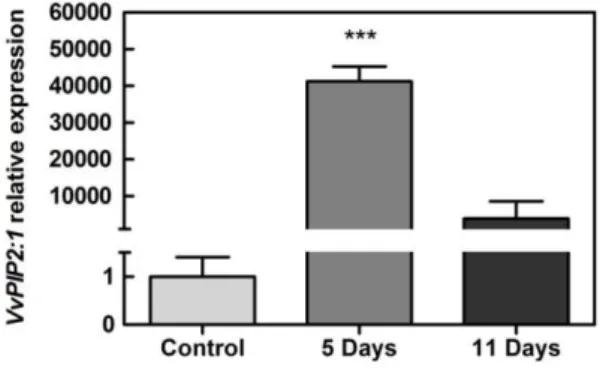
The abundance of the transcripts encoding for the plasma membrane intrinsic protein VvPIP2:1 was analyzed by real-time qPCR. As shown in Figure 9, VvPIP2:1 expression in grapes
30 subjected to postharvest dehydration was extremely enhanced, particularly after the first five days of treatment (Figure 9), when it dramatically increased about 40000 fold. A subsequent dramatic decrease in VvPIP2:1 transcripts at day 11 ensued.
Figure 9. Effect of postharvest dehydration in the transcript levels of the plasma membrane intrinsic protein VvPIP2:1 in grape berries. Gene expression analyses, by real-time qPCR, in grape berry tissues subjected to five and eleven days of dehydration process and without treatment (control);
VvPIP2:1 relative expression levels were obtained after normalization with the expression of the reference genes. VvGAPDH. One PCR run with triplicates was performed for each tested mRNA. Values are the mean ± SEM. Asterisks indicate statistical significance (Student’s t-test; ***P<0.001).
3.2.2. Intracellular aquaporins
The gene expression of some intracellular aquaporins was also analyzed. Real-time qPCR
revealed that the expression of the tonoplast intrinsic protein (VvTIP1:2) was also extremely
increased by postharvest dehydration, predominantly after the first five days of treatment (Figure 10A). Also, the gene that encodes the endoplasmic reticulum (ER)-located grape berry small and basic intrinsic protein (VvSIP1) was up-regulated in dried grapes, particularly in 5 days dehydrated grapes (in about 6-fold) when compared to untreated berries (Figure 10B), however in an immensely lower magnitude than VvTIP1:2 and plasma membrane AQPs overexpression.
Figure 10. Effect of postharvest dehydration in the transcript levels of intracellular aquaporins in grape berries. (A) tonoplast intrinsic protein VvTIP1:2; (B) small and basic intrinsic protein gene expression analyses, by real-time q-PCR, in grape berry tissues subjected to five and eleven days of dehydration process and without treatment (control); VvPIP2:1 relative expression levels were obtained after normalization with the expression of the reference genes. VvGAPDH. One PCR run with triplicates was performed for each tested mRNA. Values are the mean ± SEM. Asterisks indicate statistical significance (Student’s t-test; *P<0.05; **P<0.01).
3.3. Modifications of sugar transport and metabolism in grape berries during
postharvest dehydration
In order to evaluate possible changes, at berry level, in sugar transport capacity, concentration and metabolism in response to postharvest dehydration, metabolomic and transcriptional analysis approaches were adopted.
3.3.1. Transcriptional and metabolomic changes in sugar transport and
metabolism
Sugar content in grape berries without treatment (control) and subjected to five or eleven days of dehydration process was quantified by HPLC. As shown in Figure 11A and Figure 11B, glucose and fructose concentration, respectively, were identical between all experimental
conditions. Glucose concentration was estimated to be roughly 450 µg mg-1 DW before postharvest
dehydration, approximately 400 µg mg-1 DW after 5 days of treatment and 420 µg mg-1 DW at the
end of it. Fructose concentration was estimated to be around 300 µg mg-1 DW for all experimental
conditions. Sucrose content was slightly decreased after 5 days of dehydration (by about 10%).
32 However, berries at five and eleven days of dehydration, had more glucose 6-phosphate along time of dehydration than control ones (Figure 11D).
Figure 11. Effect of postharvest dehydration on the concentration of major sugars in grape berries. (A) Glucose; (B) fructose, (C) sucrose and (D) glucose 6-phosphate were quantified by HPLC in grape berry tissues subjected to five and eleven days of dehydration process and without treatment (control). Values are the mean ± SEM. Asterisks indicate statistical significance (Student’s t-test; *P<0.05; **P<0.01).
To understand if sugar transport was modified due to dehydration process, the expression levels of some genes involved in this process were determined by real-time qPCR in grape berries without treatment (control) and subjected to five and eleven days of dehydration process. The plant SWEET family of sugar transporters is a recently identified protein family of sugar uniporters. They are typically bidirectional sugar transporters that mediate both high-capacity low-affinity uptake and efflux of sugar across the plasma membrane, catalyzing the transport of sucrose, fructose and/or glucose, depending on the transporter (Chong et al. 2014). VvSWEET11 is highly homologous to Arabidopsis AtSWEET11, and exhibited, in dehydrated grapes, also a very strong overexpression comparatively to the control (Figure 12A). VvSWEET15 transcripts were 3-fold higher in berries
A B
D C
subjected to five days of dehydration than in control (Figure 12B), while the expression of the plasma membrane hexose transporter VvHT1 in the dehydrated berries was immensely increased relatively to the control (Figure 12C). The expression of the tonoplast monosaccharide transporter VvTMT1 was also higher in berries subjected to postharvest dehydration process (Figure 12D). In
agreement, the gene expression of cell wall invertase VvcwINV that catalyzes the conversion of
apoplastic sucrose into glucose and fructose was also enhanced at both postharvest dehydration stages (Figure 12E).
Figure 12. Effect of postharvest dehydration in the transcript levels of some grapevine sugar transporters in grape berries. Gene expression analyses, by real-time q-PCR, in grape berry tissues subjected to five and eleven days of dehydration process and without treatment (control); (A) SWEET11 transporter (VvSWEET11); (B) SWEET15 transporter (VvSWEET15); (C) Hexose transporter 1 (VvHT1); (D)
A B
C
E
34
Tonoplast monosaccharide transporter 1 (VvTMT1); cell wall invertase (VvcwINV) gene expression analyses. Gene relative expression levels were obtained after normalization with the expression of the reference gene
VvGAPDH. One PCR run with triplicates was performed for each tested mRNA. Values are the mean ± SEM. Asterisks indicate statistical significance (Student’s t-test; *P<0.05; **P<0.01; ***P<0.001).
3.3.2. Transcriptional, metabolomic, and enzyme activity changes in sugar
alcohol transport and metabolism
To overcome the effects of abiotic stresses, plants have developed complex and active systems involving a wide range of biochemical and physiological processes. Polyols are important metabolites that frequently function as carbon and energy sources and/or osmoprotective solutes in some plants (Conde et al. 2015) and to evaluate possible changes in the sugar alcohol transport capacity, metabolism and concentration in response to postharvest dehydration, metabolomic and direct transcriptional analysis were adopted as strategies.
3.3.2.1. Polyol transport
VvPLT1 encodes a grapevine polyol transporter with the ability to also transport monosaccharides. Results show that VvPLT1 transcripts abundance was severely and increasingly higher along the dehydration process in comparison with the control (Figure 13).
Figure 13. Effect of postharvest dehydration in the transcript level of the polyol transporter
VvPLT1. Gene expression analysis, by real-time qPCR, of VvPLT1 in grape berry tissues subjected to five and eleven days of dehydration process and without treatment (control). VvPLT1 relative expression levels were obtained after normalization with the expression of the reference gene VvGAPDH. One PCR run with triplicates was performed for each tested mRNA. Values are the mean ± SEM. Asterisks indicate statistical significance (Student’s t-test; **P<0.01; ***P<0.001).
3.3.2.2. Sorbitol
Sorbitol content in grape berry tissues from all experimental conditions was quantified by HPLC-RI. As shown in Figure 14, sorbitol presence was only detected in grape berries subjected to
postharvest dehydration reaching concentrations of up to 3.2 µg mg DW-1.
Figure 14. Effect of postharvest dehydration on the concentration of sorbitol in grape berries. Sorbitol was quantified by HPLC in grape berry tissues subjected to five and eleven days of dehydration process and without treatment (control). Values are the mean ± SEM.
In grapevine, according to KEGG (Kanehisa and Goto, 2000) sorbitol is primarily and reversibly oxidized to sorbose or fructose in an reaction catalyzed by a sorbitol dehydrogenase
(SDH). Transcriptional analyses by real-time qPCR shown that VvSDH, that encodes sorbitol
dehydrogenase, was strongly up-regulated in grape berries subjected to postharvest dehydration (Figure 15), with roughly a 450-fold and 150-fold increase in expression at 5 and 11 days of treatment, respectively.
Figure 15. Effect of postharvest dehydration in the transcript level of VvSDH in grape
berries. Gene expression analysis, by real-time qPCR, of VvSDH in grape berry tissues subjected to five and eleven days of dehydration process and without treatment (control). VvSDH relative expression levels