Abstract
The bark from Quercus faginea mature trees from two sites was chemically characterized for the first time. The barks showed the following composition: ash 14.6%, total extractives 13.2%, suberin 2.9% and lignin 28.2%. The polysaccharides were composed mainly of glucose and xylose (50.3% and 35.1% of all monosaccharides respectively) with 4.8% of uronic acids. The suberin composition was: ω-hydroxyacids 46.3% of total compounds, ɑ,ω-alkanoic diacids 22.3%, alkanoic acids 5.9%, alkanols 6.7% and aromatics 6.9% (ferulic acid 4.0%). Polar extracts (ethanol-water) had a high phenolic content of 630.3 mg of gallic acid equivalents (GAE)/g of extract, condensed tannins 220.7 mg of catechin equivalents (CE)/g extract, and flavonoids 207.7 mg CE/g of extract. The antioxidant activity was very high corresponding to 1567 mg Trolox equivalents/g of extract, and an IC50 of 2.63 μg extract/ml. The lipophilic extracts were constituted mainly by glycerol and its derivatives (12.3% of all compounds), alkanoic acids (27.8%), sterols (11.5%) and triterpenes (17.8%). In view of an integrated valorization, Quercus faginea barks are interesting sources of polar compounds including phenols and polyphenols with possible interesting bioactivities, while the sterols and triterpenes contained in the lipophilic extracts are also valuable bioactive compounds or chemical intermediates for specific high-value market niches, such as cosmetics, pharmaceuticals and biomedicine.
Citation: Ferreira JPA, Miranda I, Sousa VB, Pereira H (2018) Chemical composition of barks from Quercus faginea trees and characterization of their lipophilic and polar extracts. PLoS ONE 13(5): e0197135. https://doi.org/10.1371
/journal.pone.0197135
Editor: Ing-Feng Chang, National Taiwan University, TAIWAN
Received: September 24, 2017; Accepted: April 26, 2018; Published: May 15, 2018
Copyright: © 2018 Ferreira et al. This is an open access article distributed under the terms of the Creative Commons Attribution License, which permits unrestricted use, distribution, and reproduction in any medium, provided the original author and source are credited.
Data Availability: All the relevant data are within the paper.
Funding: The sampling was supported by the project OAKWOODS (PTDC/AGR-AAM/69077/2006) funded by Fundação para a Ciência e a Tecnologia (FCT). We thank José L. Louzada for providing the samples from Site 1 and Sofia Knapic for project management. We also thank Joaquina Silva and Lidia Silva for help with the chemical analysis. This work was supported by the Strategic Project (UID/AGR/00239/2013) of Centro de Estudos Florestais, by the national funding from FCT. The third author acknowledges a post-doc scholarship by FCT (SFRH /BPD/ 97970/2013).
Competing interests: The authors have declared that no competing interests exist.
Introduction
The Quercus faginea Lam. (Portuguese oak) species is native to the Western Iberian Peninsula, and the North African countries of Morocco, Tunisia and Algeria, where it coexists with other oaks such as Q. ilex L., Q. suber L., Q. pyrenaica Willd., and Q. robur L. Its distribution has become fragmented in the last centuries [1], and there are concerns on a future area reduction with warming and reduced rainfall trends, since drought is the main limiting factor of sub-Mediterranean oaks [2], and specifically of Q. faginea [3–4]. Although the wood from this species was valued and intensively exploited for naval construction in the XV-XVI centuries [5], nowadays it is not used in a significant extent, even if its potential and environmental and cultural importance are acknowledged. General descriptions of Q. faginea wood refer good aesthetic appearance, high density, and considerable mechanical strength [6–8].
Recent research efforts have been made to increase knowledge on the growth and wood characteristics of Q. faginea with the objective to contribute towards its valorization for high-quality end-uses [9–11].
Little is known about the bark of Q. faginea. One detailed study of bark anatomy and biometric features was made recently: it showed a persistent rhytidome including 3–5 sequential periderms with thin cork layers with a discontinuous development [12]. Knowledge on the bark complex structure and chemical composition allows a more efficient sampling, fractioning and processing towards specific end-uses.
Bark is an important protection component of trees e.g. against fire, frost, fungal diseases or animal injuries, depending on thickness and structure, and therefore a contributor to sustainability [13, 14]. Barks from different tree species are currently left in the forest or burnt in mills of wood, pulp and paper industries [15,16]. In addition to their fuel value, barks are now viewed also as Published: May 15, 2018 https://doi.org/10.1371/journal.pone.0197135
potential resource for biorefineries given their chemical complexity and diversity and several studies are increasing the otherwise rather scarce information on barks [17–24]. They can be a source of high-value chemicals for a variety of areas, from
pharmaceutical and bioactive natural compounds to green polymers and bio-based materials [16,17].
In this study, the bark from Q. faginea mature trees growing in two locations in Portugal in the species distribution area was chemically analyzed regarding the summative chemical composition and the composition of suberin, lipophilic and polar extractives. The antioxidant properties of the bark extracts were also evaluated. It is our goal to contribute to the valorization of Q. faginea under a full resource approach, and thereby to the strengthening of the species distribution.
Materials and methods
The samples from the Quercus faginea trees were collected in two locations: one stand in the northeast of Portugal (site 1), near Macedo de Cavaleiros and the other stand in the center of Portugal (site 2), near Vimeiro. For the first site, the authority who issued the permission was Instituto da Conservação da Natureza e das Florestas ICNF, and for site 2 the private owner was asked and gave permission. These study does not involve endangered or protected species.
Sampling
The bark samples were obtained from Quercus faginea trees selected from two stands located in the region of the species natural distribution in Portugal. One stand was located near Macedo de Cavaleiros (northeast of Portugal, 41° 30′ N, 07° 01′ W; 554 m altitude; site 1) and the other near Vimeiro (centre of Portugal, 39° 29′ N, 09° 01′ W; 100 m altitude; site 2). The stands resulted from natural regeneration and were unmanaged, mixed and uneven-aged with an average tree age of 40 years (site 1) and 125 years (site 2) [11].
Three trees from each stand were randomly selected for this study. A cross-sectional disc at breast height (1.3 m above ground) was taken and the bark manually removed. The bark samples were air-dried in a well ventilated indoor room, protected from light. The samples were ground individually in a cutting mill (Retsch SM 2000) using an output sieve of 10 mm x 10 mm, followed by one of 2 mm x 2 mm and fractionated with a vibratory system (Retsch AS 200basic) with standard sieves. After sieving, the 40–60 mesh (0.425 mm—0.250 mm) fractions were collected for chemical analysis.
Summative chemical analysis
Chemical summative analyses included determination of ash, extractives soluble in dichloromethane, ethanol and water, suberin, Klason and acid soluble lignin and the monomeric composition of polysaccharides. All determinations were made with duplicate samples.
Ash was determined by measuring the residue remaining after incinerating the sample overnight in a muffle furnace at 525°C (TAPPI T 211 om-02).
The extractives were determined with procedures adapted from Tappi 204 cm-97, in a soxhlet system successively with dichloromethane, ethanol and water (all supplied by Sigma-Aldrich, ≥99.8% purity, St. Louis, MO, USA), under reflux, during 6h, 16h and again 16h, respectively. The extractives solubilized by each solvent were determined by mass difference of the solid residue after drying at 105 °C and reported as percent of the original sample.
The suberin content was determined in the extractive-free material by use of methanolysis for depolymerization [25]. A 1.5 g sample of extractive-free material was refluxed with a 3% (m/v) solution of NaOCH in CH OH (100 ml) during 3 h (both supplied by Sigma-Aldrich, 95% and ≥99.8% purity respectively, St. Louis, MO, USA). The sample was filtrated and washed with methanol, and the filtrated residue was refluxed again with 100 ml CH OH for 15 min and filtrated. The combined filtrates were acidified to pH 6 with 2 M H SO (Merck KGaA, 98% purity, Darmstadt, Germany) and evaporated to dryness. The residues were suspended in water (50 ml) and the products recovered with dichloromethane in three successive extractions (of 50 ml each). The combined extracts were dried over anhydrous Na SO (ACS Sigma-Aldrich, ≥99% purity, St. Louis, MO, USA), and the solvent evaporated to dryness. The suberin extracts were quantified and the results expressed in percent of the initial dry mass.
Klason and acid-soluble lignin, and carbohydrates contents were determined on the extracted and desuberinized materials. Sulphuric acid (72%, 3.0 ml) was added to 0.35 g of the sample and the mixture was placed in a water bath at 30°C for 1 h, after which it was diluted to 3% H SO and hydrolyzed for 1 h at 120°C. The sample was vacuum-filtered through a crucible and washed with boiling purified water. Klason lignin was determined as the mass of the solid residue after drying at 105°C (TAPPI T 222 om-02). The acid-soluble lignin was determined on the combined filtrate by measuring the absorbance at 206 nm using a UV/VIS spectrophotometer (TAPPI Useful Method UM 250). The remaining acid solution was kept for sugar analysis.
The composition of polysaccharides was evaluated after hydrolysis by determining the content in neutral monossacharides (rhamnose, arabinose, xylose, galactose, mannose and glucose), uronic acids (galacturonic and glucuronic acids) in the hydrolysate from the lignin analysis using High Pressure Ion-exchange Chromatography with a pulsed amperometric detector (HPIC-PAD). The compounds were separated in a Dionex ICS-3000 system, with an Aminotrap plus Carbopac PA10 column (250 x 4 mm). The content of acetic acid was also determined in the hydrolysate using a High-Pressure Ion-exclusion Chromatography with a UV/Visible detector (HIPCE-UV). The compounds were separated in a Thermo Finnigan Surveyor installed with a Biorad Aminex 87H column (300 x 7.8 mm).
Ethanol-water extracts composition
Extracts were prepared using approximately 1 g of the bark samples and a solution of ethanol/water (50/50, v/v), with a 1:10 (m/v) solid-liquid ratio for 60 min at 50°C in an ultrasonic bath (Branson 2200 Scientific Support, Inc., Hayward, CA, USA). The sample was filtrated and the supernatant extract was used to determine the contents in total phenolics, flavonoids and condensed tannins. Each assay was performed at least three times and at least three independent replicates were prepared for each standard and sample.
The antioxidant activity of these extracts was also determined using DPPH and FRAP methodologies. Total phenolics. 3 3 3 2 4 2 4 2 4
The total phenolic content was determined using a modified Folin-Ciocalteu method [26]. Gallic acid (GA) was used as standard, the experiment was conducted in triplicate.
An aliquot of each bark extract (100 μl) was mixed with 4 ml of Folin-Ciocalteau (1:10 v/v) reagent (Sigma-Aldrich, ≥99.8% purity, St. Louis, MO, USA) and vortexed. After 3–8 min at room temperature, 4 ml of Na CO (Sigma-Aldrich, ≥99.9% purity, St. Louis, MO, USA) solution (7.5% m/v) were added, vortexed and incubated in a thermostatized water-bath at 45°C for 1 min. The
absorbance of the resulting blue colored mixtures was recorded with a spectrophotometer (UV-160A Recording Spectrophotometer, Shimadzu) at 765 nm against a blank containing only water. The same procedure was followed for preparation of the gallic acid (Sigma-Aldrich, ≥99% purity, St. Louis, MO, USA) calibration curve, using seven previously prepared stock standard solutions in the range of 0.014 to 0.762 g/l; the calibration curve of gallic acid was y = 0.0076x+0.0108 (r = 1.000). The total phenolic content was expressed as milligrams of gallic acid equivalents (GAE) per g of extract.
Total flavonoids.
Total flavonoid content was determined using a modified aluminum chloride methodology with catechin (CA) as standard [24]. Aliquots (1 ml) of the extract solutions, or catechin standard solution, were taken to 4 ml water and 0.3 ml NaNO (Sigma-Aldrich, ≥99% purity, St. Louis, MO, USA) solution (5% m/v) and kept during 5 min in the dark. Then 0.3 ml AlCl (Sigma-Aldrich, ≥99% purity, St. Louis, MO, USA) solution (10% m/v) was added, and after 6 min 2 ml NaOH (Sigma-Aldrich, ≥98.0% purity, St. Louis, MO, USA) solution (4%, m/v) and 2.4 ml water were added sequentially and vigorously shaken. Absorbance was recorded at 510 nm after 30 min incubation, against water (UV-160A Recording Spectrophotometer, Shimadzu). A standard calibration plot was generated using six sequentially and independently prepared stock standard solutions of catechin (Sigma-Aldrich, ≥99.0% purity, St. Louis, MO, USA) with concentration from 0.10 to 1.0 mg/ml. The concentrations of flavonoid in the test samples were calculated from the calibration plot (y = 0.9268x, r = 0.950) and expressed as mg catechin (CA) equivalent/g of extract.
Condensed tannins.
Condensed tannins content was determined by the vannilin-sulphuric acid assay using catechin as standard [27]. An aliquot (1 ml) of the extract sample was dried and dissolved in 10 ml of methanol. An aliquot of 1 ml was added to 2.5 ml of vanillin (Sigma-Aldrich, ≥99.0% purity, St. Louis, MO, USA) solution (1% m/v in methanol) and 2.5 ml of sulphuric acid 25% (m/v in methanol), and the volume of 10 ml completed with methanol. The extract samples and blanks (with 1 ml of methanol) were incubated for exactly 15 min. Subsequently, the absorbance was measured at 500 nm using a UV–Vis spectrophotometer (UV-160A Recording Spectrophotometer, Shimadzu). The same procedure was followed for preparation of the catechin calibration plot from standards with concentrations of 10, 20, 40, 60, 80 and 100 mg/l (y = 0.0738x+0.0054, r = 0.996). The results were expressed as mg catechin (CA) equivalents/g of extract (mg CA/g).
Antioxidant activity.
The antioxidant activity of the ethanol-water extracts was determined by two methods to cover the various mechanisms of antioxidant action [28,29]: 2,2-diphenyl-1-picryhydrazyl (DPPH), which measures the free radical scavenging capacity, and ferric reducing/antioxidant power (FRAP), which measures the sample’s ferric reducing power.
The DPPH assay was performed using 2,2-diphenyl-1-picrylhydrazyl hydrate (DPPH, Sigma-Aldrich, ≥99.0% purity, St. Louis, MO, USA), a nitrogen centered free radical having an odd electron that changes from purple to yellow when the odd electron is paired in the presence of a radical scavenger to form the reduced DPPH-H [28,29]. The DPPH results are expressed either as IC value or as Trolox equivalents on a dry extract base.
Different dilutions of the initial extract and of a stock Trolox (Sigma-Aldrich, ≥97.0% purity, St. Louis, MO, USA) solution (0.2 mg/ml) in methanol were prepared. An aliquot of 100 μL of each methanolic solution were added to 3.9 ml of a DPPH methanolic solution (24 μg/ml). The blank sample consisted of 100 μl of methanol added to 3.9 ml of DPPH solution. After 30 min incubation at room temperature in the dark, the absorbance was measured at 515 nm.
The radical scavenging activity of each sample was calculated by the DPPH inhibition percentage as follows: I % = [(Abs -Abs )/-Abs ]×100, where -Abs was the absorbance of the blank and -Abs was the absorbance in the presence of the extract at different concentrations. The IC inhibiting concentration represents the concentration of a sample necessary to sequester 50% of the DPPH radicals and was obtained by plotting the inhibition percentage against the extract concentration. The scavenging effect was also expressed as the Trolox equivalent antioxidant capacity (TEAC) determined from the calibration curve with Trolox solution of different concentrations and the percentage of scavenging effect on the DPPH radical.
The ferric reducing antioxidant power (FRAP) assay depends on the reduction of ferric ion into ferrous ion [30]. The FRAP reagent was obtained by mixing 300 mM sodium acetate buffer (pH 3.6), 10 mM TPTZ (tripyridyl triazine, Sigma-Aldrich, ≥98.0% purity, St. Louis, MO, USA) solution and 20.0 mM FeCl .6H2O solution in a ratio of 10:1:1 (volume). An aliquot (100 μl) of extract or standard was then added to 3 ml of the FRAP reagent and the reaction mixture was incubated at 37°C for 30 min. The absorbance was measured at 593 nm in comparison with a blank. Aqueous solutions of known Trolox concentrations in the range of 0–0.5 Mmol/L were used for the calibration, and the results were expressed as Mmol Trolox equivalents/g dry mass.
Lipophilic extracts composition
The lipophilic extracts that were solubilized from the bark samples with dichloromethane were recovered as a solid residue after solvent evaporation and dried overnight under vacuum at room temperature. Aliquots (2 mg) of each sample were taken and derivatized in 100 μL of pyridine (Sigma-Aldrich, ≥99.8% purity, St. Louis, MO, USA); the compounds with hydroxyl and carboxyl groups were trimethylsilylated into trimethylsilyl (TMS) ethers and esters, respectively, by adding 100 μl of bis(trimethylsily)-trifluoroacetamide (BSTFA, Sigma-Aldrich, ≥99.0% purity, St. Louis, MO, USA). The reaction mixture was heated at 60°C for 30 min in an oven.
The derivatized extracts were immediately analyzed by injection in a GC–MS Agilent 5973 MSD with the following GC conditions: Zebron 7HG-G015-02 column (30 m, 0.25 mm; ID, 0.1 μm film thickness), flow 1 ml/min, injector 280 °C, oven temperature program, 100 °C (1 min), rate of 10 °C/min up to 150 °C, rate of 4 °C/min up to 300 °C, rate of 5 °C/min up to 370 °C, rate of 8 °C/min up to 380 °C (5 min). The MS source was kept at 220 °C and the electron impact mass spectra (EIMS) taken at 70 eV of energy.
The compounds were identified as TMS derivatives by comparing their mass spectra with a GC–MS spectral library (Wiley, NIST),
2 3 2 2 3 2 2 50 0 1 0 0 1 50 3
and by comparing their fragmentation profiles with published data [31,32]. For semi-quantitative analysis the area of peaks in the total ion chromatograms of the GC–MS analysis was integrated and their relative proportions expressed as area proportion of the total chromatogram area. Each aliquot was injected in triplicate and results presented by mean (only standard deviation inferior to 5% was considered).
Suberin composition
Aliquots of the dichloromethane extracts (5 ml) from the suberin depolymerization reaction were taken, evaporated under N flow and dried at room temperature (r.t.) under vacuum overnight. The samples were derivatized as described above and immediately analyzed by injection in a GC–MS Agilent 5973 MSD with the following GC conditions: Zebron 7HG-G015-02 column (30 m, 0.25 mm; ID, 0.1 μm film thickness), flow 1 ml/min, injector 280°C, oven temperature program, 100°C (1 min), rate of 8°C/min up to 250°C, rate of 5°C/min up to 300°C (5 min), rate of 5°C/min up to 350°C (5 min), rate of 10°C/min up to 380°C (5 min). The MS source was kept at 220°C and the electron impact mass spectra (EIMS) taken at 70 eV of energy.
The compounds were identified and quantified as described above. Each aliquot was injected in triplicate and results presented by mean (only standard deviation inferior to 5% was considered).
Statistical analysis
All results were expressed as mean and standard deviation (SD). The significance of differences (p ≤ 0.05) among the
corresponding mean values was determined using one-way analysis of variance (ANOVA) using the Sigmaplot statistical software (version 11.0).
Results and discussion
Chemical composition
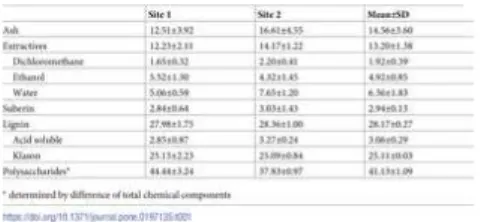
The summative chemical composition of the Q. faginea bark samples, from the two sites, is summarized on Table 1. No significant differences were found between the trees of site 1 and the trees of site 2. The mean composition was (in % of the oven dry bark): 14.6% ash, 13.2% extractives, 2.9% suberin, 28.2% lignin and 41.1% polysaccharides. Concerning the extractives, the ethanol and water-soluble compounds showed higher proportion (representing 85.6% of the total extractives and 11.3% of the bark) than the dichloromethane extractives (14.4% of the extractives and 1.9% of the bark).
Table 1. Chemical composition (% of total o.d. mass) of bark from Quercus faginea from sites 1 and 2 and the mean value.
https://doi.org/10.1371/journal.pone.0197135.t001
The humidity in the Q. faginea bark samples from the two sites was determined after 24 h oven-drying at 60 °C and 2 h at 100 °C, corresponding to 13.4–14.2% of bark.
The extractives content of Q. faginea bark is very similar to that of the sapwood and heartwood of the trees in these two sites [11]. The results are, however, much higher than those found in the bark of other Quercus species: 4.6% in Q. robur [33], 2.1% in Q.
petraea [34], 5–6% in Q. vulcanica [35], 5.4% in Q. alba, 6.6% in chestnut oak and 5.8% in Q. stellata [36]. In a few cases of other
species, the bark was separated in phloem and cork: in Q. cerris rhytidom, the extractives corresponded to 6.5% and 16.7% in the phloem and cork respectively [37], and in Q. suber to 6.2% and 10.4% respectively [38], and in Pseudotsuga menziesii to 28.4% and 29.2% [22].
The suberin content was low, which is consistent with the cellular characteristics of Q. faginea bark that contains periderms that produce only thin cork layers; therefore, the bark is mostly constituted by the lignocellulosic phloem tissues [12]. In fact, suberin content is in direct relation with the proportion of cork in the bark i.e. barks with more cork will have more suberin. This is the case for instance of species such as Q. suber [39, 40], Q. cerris [18, 37], Pseudotsuga menziesii [22] or Q. variabilis barks [24]. In species with a small proportion of cork, the content in suberin is correspondingly low e.g. in the bark of Pinus pinea [41] or Tectona
grandis [42].
Lignin content is relatively high (28.2%). This is justified by the substantial lignification of bark fibers and sclereids [12]. Lignin content is similar to the observed for sapwood and heartwood (28–29%) of trees from the same species [11]. The comparison with barks of other Quercus species shows similar range of values to those reported for Q. robur (25–35%) [33, 43], Q. petraea (17–30%) [34, 43], Q. alba and Q. stellata (14–26%) [36], and Q. vulcanica (25%) [35].
The carbohydrate composition based on the monosaccharides found in the acid hydrolysates is summarized in Table 2. The major monosaccharide was glucose (over 50% of the total) and xylose (35.1%); rhamnose and arabinose exist in very small amounts and, together with galactose and mannose accounted for only 9% of total monosaccharides) while uronic acids represented 4.6%; no acetylation of the polysaccharides was detected. Comparing to the carbohydrate composition of Q. faginea wood, glucose and xylose also represented the major monosaccharides (approximately 90% of the total neutral monosaccharides).
2
Table 2. Carbohydrate composition of bark from Quercus faginea from sites 1 and 2 in % of total monosaccharides.
https://doi.org/10.1371/journal.pone.0197135.t002
Similar composition was reported for the Q. cerris rythidome [37] where glucose and xylose also constituted the major
monosaccharides identified (48.4% glucose and 27.9–40.3% xylose). Other barks showed a similar pattern e.g. 47.0% and 33.8% of glucose and xylose respectively in Betula pendula [21].
Ash content was particularly high. It is known that bark accumulates inorganic materials and their content is usually much higher than in wood which in this species was about 19 times over [11]. Previously, was already observed that crystals and druses occurred profusely in chambered axial parenchyma in Q. faginea bark as well as large prismatic crystals in sclereids that might may explain these findings [12]. The ash content of Q. faginea bark was higher than that of other Quercus species, namely in the co-occurring cork oaks (0.7%) [19], the American oak, Q. alba (0.2–1%) [36] and the so-called European oaks (0.3%) [33] and 9–10% [43]. However, the content was similar to that of Q. vulcanica that reached 13.5% [35].
Ethanol-water extracts composition
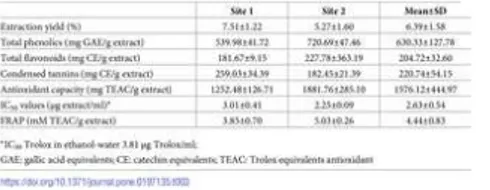
Table 3 shows the yield and composition of the ethanol-water (1:1) extracts concerning total phenolics, flavonoids and condensed tannins content.
Table 3. Composition and antioxidant capacity of ethanol-water extracts of bark from Quercus faginea.
https://doi.org/10.1371/journal.pone.0197135.t003
The extraction yield under the conditions used was lower than the total polar extractives determined by soxhlet extraction (6.4% vs. 11.3%). This yield difference between extraction processes was also obtained when analysing sapwood and heartwood of Q.
faginea trees [11]. This indicates that the extraction procedure may be optimized to improve extraction yield e.g. by increasing
extraction time or temperature.
Phenolic substances are the major constituents of extractives (Table 3), representing 54% to 72% of the Q. faginea bark ethanol-water extracts (corresponding to 40.5 and 38.0 mg GAE/g of bark). This is similar to the value found for methanol-ethanol-water extracts of cork from Algerian Q. suber (787.0 mg GAE/ g extract) [44] as well as for phenolic contents determined in the heartwood of Q.
robur, Q. petraea and Q. pyrenaica [12]. The bark of Q. faginea contains more phenolics than its sapwood (19.5 mg GAE/g of
wood) but lower than heartwood (81.8 mg GAE/g of wood) [11].
The extracts were rich in flavonoids and condensed tannins (204.7 and 220.7 mg CE/g of extract respectively) with some differences between sites: the bark extracts from site 1 were richer in condensed tannins than those from site 2 and the opposite was observed concerning flavonoid content. The natural between-tree variability and the tree age difference between site 1 and 2 may contribute to this difference [45] for wood phenolic composition. Overall the Q. faginea bark content in flavonoids and tannins was much above the values found for sapwood and heartwood [11].
The phenolic richness of the Q. faginea bark extracts allow to consider a valorization of this material. Plant polyphenols are important free radical scavenging antioxidants because they are able to capture free radicals and chelate metals that could be responsible for promoting lipid peroxidation, while flavonoids may act against several human diseases and as potent antioxidants depending on the molecular structure, the position of the hydroxyl group and other chemical features [46].
Antioxidant activity of ethanol-water extracts.
The antioxidant capacity of the ethanol-water extracts from Q. faginea bark was evaluated by measuring the scavenging capacity against the radical DPPH· and by the ferric reducing antioxidant power (Table 3). The bark extracts exhibited high antioxidant activity (IC of 3.01 μg extract/ml and 2.25 μg extract/ml for site 1 and 2, respectively), when compared to the antioxidant standard Trolox (3.81 μg Trolox/ml).
The reducing ability of the extracts by the FRAP assay was 3.85 mM Trolox/ g extract (0.29 mM Trolox/ g bark) and 5.03 mM Trolox/ g extract (0.26 mM Trolox/ g extract). As expected the reducing ability was higher in the extracts with higher polyphenolic content given their redox properties and so their ability to act as reducing agents, hydrogen donor, singlet oxygen quenchers or metal chelators.
The comparison of the results with literature data must be done cautiously due to differences in methods and calculations. However, it is clear that the extracts of Q. faginea bark show a very high antioxidant capacity when compared to other extracts: reported by that the IC value for Q. suber cork is 2.79 (water extract), 3.58 (methanol extract) and 5.84 (methanol-water extract) (compared with 2.12 μg/ml for ascorbic acid in methanol and 2.46 μg/ml for ascorbic acid in water [47]. This antioxidant activity is
50
similar than that reported for Eucalyptus sideroxylon bark ethanol:H O extract in which the IC value was 2.25 μg/ml, as compared to Trolox (IC of 2.90 μg/ml) [48]. The scanvenging activity of the hydroalcoholic extract of E. grandis, E. urograndis and E.
maidenii barks was also determined and showed comparatively less antioxidant activity, with an IC values of, respectively, 6.26 μg/ml, 6.14 μg/ml and 8.24 μg/ml compared with 2.17 μg/ml for ascorbic acid [49].
In general, the chemical characteristics of the ethanol-water extracts of bark from Q. faginea allow considering its use a source of antioxidants in food or cosmetics industries.
Lipophilic extracts composition
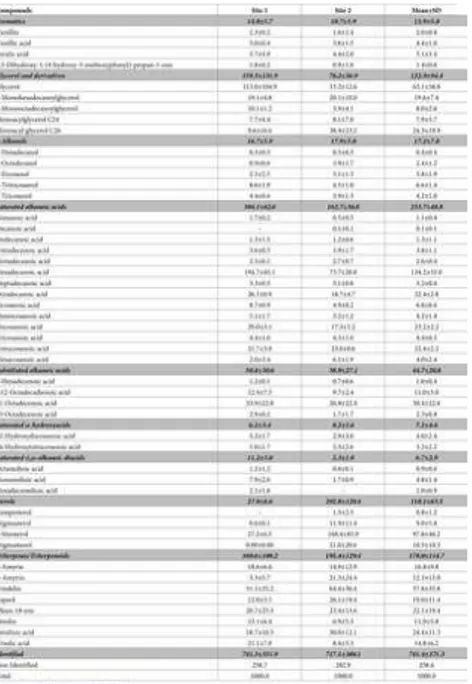
The results of the GC-MS analysis of the non-polar dichloromethane bark extracts of Q. faginea are summarized in Table 4.
Table 4. Composition of dichloromethane extracts of Quercus faginea bark, in % of the normalized chromatographic peak areas in TIC of the compounds detected by GC-MS.
https://doi.org/10.1371/journal.pone.0197135.t004
Triterpenes constitute one of the most abundant class of compounds (16.1% and 19.5% of all compounds, respectively for site 1 and site 2). Among triterpenes, friedelin (5.1–6.4% of all compounds), olean-18-ene (2.1–2.3%) and betulinic acid (1.9–3.0%) constitute 90.1% of all the identified triterpenes/triterpenoids. β-Amyrin, ɑ-amyrin, betulin and ursolic acid) were also identified in smaller amounts.
Several authors have reported the presence of betulin, betulinic acid, lupeol and oleanolic acid in birch bark species [50, 51] and of friedelin, cerin, lupeol, ursolic acids in oak barks [49–54]. Barks from Eucalyptus species are also very rich in triterpenic compounds as ɑ-amyrin, β-amyrin, betulonic and betulinic acids, oleanolic and ursolic acids [55, 15].
Saturated alkanoic acids constitute also one abundant group of compounds (30.4% and 16.3% of all compounds for site 1 and site 2 respectively). They are the major compounds identified in the lipophilic bark extracts from the trees from site 1, namely
hexadecanoic, octadecanoc and docosanoic acids, corresponding to 19.5%, 2.6% and 2.9%, respectively. In site 2, saturated alkanoic acids were also found in considerable amounts, with hexadecanoic, octadecanoic and docosanoic acids also as the most representative (7.4%, 1.9% and 1.7%, respectively). Substituted alkanoic acids, saturated ω-hydroxyacids and ɑ,ω-diacids were also found in the lipophilic extracts from trees from both sites, but in smaller amounts (5.1%, 0.6% and 1.1% for site 1, respectively, and 3.9%, 0.8% and 0.2% for site 2, respectively). Alkanols comprise only 1.7–1.8% of all compounds, with eicosanol and
tricosanol as major compounds. Chain lengths vary from C9 to C26, but C16 is the most abundant, corresponding to 53.6% and 45.1% of the total fatty acids, in the lipophilic extracts from sites 1 and 2, respectively.
The same pattern of composition was found for other lipophilic hardwood bark extracts like birch trees [23, 56] or Populus
balsamifera [57].
Glycerol and glycerol derivatives constituted 16.0% of all compounds in the bark lipophilic extracts from site 1, with glycerol representing 11.3%. In site 2, the amount of glycerol and its derivatives was considerably lower (8.6%).
Sterols were identified in high amounts but only in trees from site 2, constituting 20.3% of all compounds, almost tenfold the amount found in site 1 (2.8%). β-sitosterol was the major sterol (16.8% of all compounds); stigmasterol, stigmastanol and campesterol were also identified in smaller amounts.
Aromatics were present (1.5–1.1% of all compounds) including ferulic acid although in small amounts (<1%).
There are some clear differences in the composition of the bark lipophilic extracts from both sites: in extracts from site 1, the saturated alkanoic acids are clearly the most abundant group (30.9% vs. 16.3%), while for site 2, the major group is the sterols (20.3% vs. 2.8%).
Lipophilic bark extracts from Q. faginea trees are different from those reported for the wood of the same trees [11]. The composition
2 50
50
was not influenced by the geographical location. Aromatics are the major class of compounds in sapwood (22.8%) and also saturated alkanoic acids (15.7%) and sterols (10.6%); in heartwood, saturated alkanoic acids represent the major class of identified compounds (25.8%), accompanied by triterpenes (13.0%), sterols (12.8%) and substituted alkanoic acids (10.4%).
Suberin composition
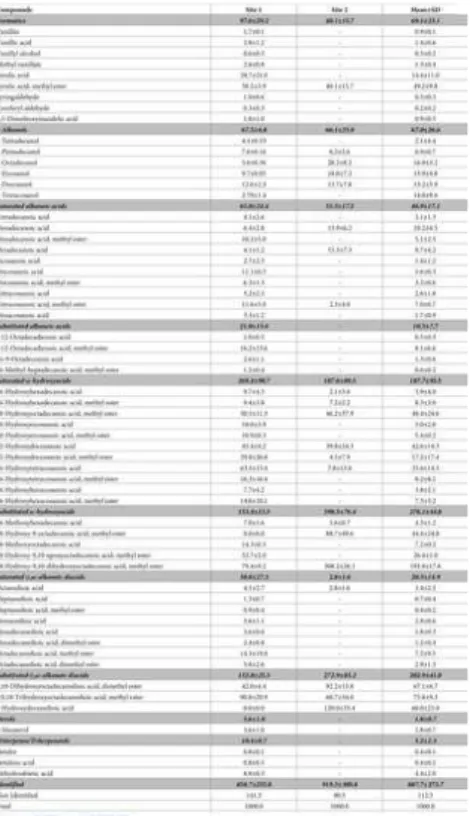
The results for the suberin composition obtained by GC-MS analysis are summarized in Table 5, given in mg of compound per kg of dry mass. This is the most commonly used quantification of suberin monomers in the depolymerized mixtures [58]. The mixtures contain the compounds that are soluble in the low polarity organic solvent used for the recovery of the suberin monomers after depolymerization by partition between water and an organic phase after acidification of the reaction mixture; water soluble monomers, namely glycerol are removed in the aqueous phase [25].
Table 5. Composition of suberin extracts of Quercus faginea bark, in % of the normalized chromatographic peak areas in TIC of the compounds detected by GC-MS.
https://doi.org/10.1371/journal.pone.0197135.t005
The main constituents found in suberin from Q. faginea bark are fatty acids (70.7–88.3% of all compounds): substituted ω-hydroxyacids (15.3% in site 1 and 40.2% in site 2), saturated ω-hydroxyacids (26.8% in site 1 and 10.8% in site 2), and
substituted ɑ,ω-alkanoic diacids (13.3%in site 1 and 27.3%in site 2). The differences between the barks from both sites are evident: in site 1 the ω-hydroxyacids correspond to 60.5% of total fatty acids and in site 2 substituted ω-hydroxyacids and ɑ,ω-diacids constitute 80.1% of total fatty acids.
Factors such as the local geoclimate, seasonal changes, external conditions such as light, temperature and humidity may affect the composition of secondary metabolites [59] and contribute to the differences on the chemical composition of the barks from the two sites.
In the barks of site 1, suberin is mainly constituted by saturated ω-hydroxyacids including namely 24-hydroxytetracosanoic acid and its methyl ester (10.3%), 22-hydroxydocosanoic acid (6.2%) and the methyl ester of 18-hydroxyoctadecanoic acid (5.0%). saturated and substituted alkanoic acids represented 6.5% and 2.1% of identified compounds (namely docosanoic acid and the methyl esters of hexadecanoic, tetracosanoic and 9,12-octadecanedioic acids). Substituted ω-hydroxyacids and substituted ɑ,ω-diacids were also found in high amounts (15,3% and 13.3%, respectively) where the major compound identified was the methyl esters of 18-hydroxy-9,10-dihydroxyoctadecanoic (7.9%) and 18-hydroxy-9,10-epoxyoctadecanoic acid (5.3%). Alkanols represented 6.8% of all compounds, Saturated ɑ,ω-diacids corresponded to 3.8% (where the methyl ester of octadecanedioic acid exist in 1.4%),
Aromatics represent 9.8% (mainly ferulic acid and its methyl ester). Sterols and triterpenes were present in minor amounts. In the barks of site 2, suberin is richer in substituted ω-hydroxyacids (39.8%) and substituted ɑ,ω-diacids (27.3%), mainly the methyl esters of 18-hydroxy-9,10-dihydroxyoctadecanoic acid (30.8%), 18-hydroxy-9-octadecanoic acid (8.9%),
2-hydroxydecanedioic acid (12.0%) and the methyl esters of 9,10-dihydroxyoctadecanedioic (9.2%) and
8,9,18-trihydroxyoctadecanedioic acids (6.1%). Saturated ω-hydroxyacids were also found in considerable amounts (10.8%), and the methyl ester of 18-hydroxyoctadecanoic acid and 22-hydroxydocosanoic acid are the major identified compounds. Alkanols represented 6.6% of all compounds (namely 1-octadecanol with 2.8%), saturated alkanoic acids 3.2% (mainly hexadecanoic and octadecanoic acids). The methyl ester of ferulic acid was the only aromatic found representing 4.0% of the compounds. Chain lengths ranged from C14 to C26, but C18 was the most relevant, representing 52.2% and 73.1% of the total fatty acids identified in site 1 and 2, respectively.
1.
View Article Google Scholar
2.
View Article Google Scholar
3.
View Article Google Scholar
4.
View Article Google Scholar
5.
View Article Google Scholar
6.
View Article Google Scholar
7.
View Article Google Scholar
8.
View Article Google Scholar
9.
ω-hydroxyacids (46.3% of total compounds) and of ɑ,ω-alkanoic diacids (22.3%). This composition is quite different from that of cork from Q. suber in which the most important monomers are substituted ɑ,ω- diacids with mid-chain epoxy or diol substitutions [56]. Differences also occur with the suberin of Q. cerris cork where the ω-hydroxyacids represent 90% of the long chain monomers [37]. A more similar compositional pattern is found with the suberins of Pseudotsuga menziesii cork [22] or Plathymenia coriacea [60].
It is worth noticing that the contents in saturated fatty acids such as ω-hydroxyacids and alkanoic acids amounts are over twofold in site 1 (younger trees) than in site 2 (older trees), while ɑ,ω-alkanoic diacids and ω-hydroxyacids are the most representative in site 2.
Triterpenes and sterols are absent in site 2. Although the number of samples used in these studies is small and general conclusions have to be made cautiously, the results suggest a possible relation between tree age and suberin chemical
composition: in older trees suberin is constituted by higher content of mid-chain substituted fatty acids, leading to a spatially less-compact macromolecular structure [61].
Conclusions
The barks from Quercus faginea mature trees from two sites were chemically characterized for the first time, showing a high content of extractives, constituted mainly by polar compounds extractable with ethanol and water that include high contents of phenolics and polyphenolics, including of flavonoids. The ethanol-water extracts showed a very high antioxidant capacity, well above most reports on other materials.
The bark of Q. faginea contains a high amount of inorganic material and of lignin. In accordance with its structural composition the bark has a small amount of suberin. Suberin composition is dominated by ω–hydroxyacids (saturated and substituted) and to a lesser extent extent by ɑ,ω-diacids.
In an integrated valorization strategy, Quercus faginea barks are interesting sources of polar compounds including phenols and polyphenols with possible interesting bioactivities. The lipophilic extracts contained sterols and triterpenes that are also valuable bioactive compounds or chemical intermediates for the synthesis of new valuable compounds with specific properties.
Acknowledgments
The sampling was supported by the project OAKWOODS (PTDC/AGR-AAM/69077/2006) funded by Fundação para a Ciência e a Tecnologia (FCT). We thank José L. Louzada for providing the samples from Site 1 and Sofia Knapic for project management. We also thank Joaquina Silva and Lidia Silva for help with the chemical analysis. This work was supported by the Strategic Project (UID/AGR/00239/2013) of Centro de Estudos Florestais, by the national funding from FCT. The third author acknowledges a post-doc scholarship by FCT (SFRH /BPD/ 97970/2013).
References
Fabião A, Silva I. Effect of individual tree shelters on early survival and growth of a Quercus faginea plantation. Ann. Ist. Sper. Selvic. 1996;27: 77–82. http://hdl.handle.net/10400.5/1334
Cotillas M, Sabate S, Gracia C, Espelta JM. Growth response of mixed Mediterranean oak coppices to rainfall reduction. Could selective thinning have any influence on it? For. Ecol. Manage. 2009;258: 1677–1683.
Corcuera L, Camarero JJ, Gil-Pelegrí E. Effects of a severe drought on growth and wood anatomical properties of Quercus faginea. IAWA J. 2004;25: 185–204.
Montserrat-Marti G, Camarero JJ, Palacio S, Pérez-Rontome C, Milla R, Albuixech J, Maestro M. Summer-drought constrains the phenology and growth of two coexisting mediterranean oaks with contrasting leaf habit: implications for their persistence and reproduction. Trees. 2009;23: 787–799.
Reboredo F, Pais J. Evolution of forest cover in Portugal: A review of the 12th –20th centuries. J. Forest. Res. 2014;25: 249–256.
Knapic S, Louzada JL., Leal S, Pereira H. Radial variation of wood density components and ring width in cork oak trees. Ann. For Sci. 2007;64: 211–218.
Knapic S, Louzada JL, Pereira H. Variation of wood density components within and between Quercus faginea trees. Can. J. For. Res. 2011;41: 1212–1219.
Sousa VB, Louzada JL, Pereira H. Age trends and within-site effects in wood density and radial growth in Quercus faginea mature trees. Forest Systems 2016;25: e053, 9 pages.
View Article Google Scholar
10.
View Article Google Scholar
11.
View Article PubMed/NCBI Google Scholar
12.
View Article Google Scholar
13.
View Article Google Scholar
14.
15.
View Article Google Scholar
16.
View Article Google Scholar
17.
View Article Google Scholar
18.
View Article Google Scholar
19.
View Article Google Scholar
20.
View Article Google Scholar
21.
View Article Google Scholar
22.
View Article Google Scholar
23.
View Article Google Scholar
24.
View Article Google Scholar
25.
View Article Google Scholar
26.
View Article Google Scholar
27.
View Article Google Scholar
Sousa VB, Cardoso S, Pereira H. Age trends in the wood anatomy of Quercus faginea. IAWA J. 2014;35: 293–306.
Miranda I, Sousa V, Ferreira J, Pereira H. Chemical characterization and extractives composition of heartwood and sapwood from Quercus faginea. PLoS ONE. 2017;12: 1–14. pmid:28614371
Quilhó T, Sousa V, Tavares F, Pereira H. Bark anatomy and cell size variation in Quercus faginea. Turk. J. Bot. 2013;37: 561–570.
Barij N, Cermak J, Stokes A. Azimuthal variations in xylem structure and water relations in cork oak (Quercus suber). IAWA J. 2011;32: 25–40.
Dickison WC. Integrative Plant Anatomy. 2000. USA. Academic Press, Elsevier Publishers. ISBN: 978-0-12-215170-5
Sartori C, Mota GS, Ferreira J, Miranda I, Mori FA, Pereira H. Chemical characterization of the bark of Eucalyptus urophylla hybrids in view of their valorization in biorefineries. Holzforschung 2016;70: 819–828.
Menon V, Rao M. Trends in bioconversion of lignocellulose: Biofuels, platform chemicals & biorefinery concept. Prog. Energy Combust. Sci. 2012;38: 522–550.
Villaverde JJ, Sandín-Espana P, Sevilla-Morán B, López-Goti C, Alonso-Prados JL. Biospesticides from Natural Products: Current Development, Legislative Framework, and Future Trends. 2016;11: 5618–5640.
Şen A, Quilhó T, Pereira H. The cellular structure of cork from Quercus cerris var. cerris bark in a materials’ perspective. Ind. Crops Prod. 2011;34: 929–936.
Miranda I, Gominho J, Pereira H. Cellular structure and chemical composition of cork from the Chinese cork oak (Quercus variabilis). J. Wood Sci. 2012a;59: 1–9.
Miranda I, Gominho J, Mirra I, Pereira H. Chemical characterization of barks from Picea abies and Pinus sylvestris after fractioning into different particle sizes. Ind. Crops Prod. 2012b;36: 395–400.
Miranda I, Gominho J, Mirra I, Pereira H. Fractioning and chemical characterization of barks of Betula pendula and Eucalyptus globulus. Ind. Crops Prod. 2013;41: 299–305.
Ferreira J, Miranda I, Gominho J, Pereira H. Selective fractioning of Pseudotsuga menziesii bark and chemical characterization in view of an integrated valorization. Ind. Crops Prod. 2015;74: 998–1007.
Ferreira J, Quilhó T, Pereira H. Characterization of Betula pendula Outer Bark Regarding Cork and Phloem Components at Chemical and Structural Levels in View of Biorefinery Integration. J. Wood Chem. Technol. 2016a;0: 1–16.
Ferreira J, Miranda I, Şen U, Pereira H. Chemical and cellular features of virgin and reproduction cork from Quercus variabilis. Ind. Crops Prod. 2016b;94: 638–648.
Pereira H. Chemical composition and variability of cork form Quercus suber L. Wood Sci. Technol. 1988;22: 211–218.
Singleton VL, Rossi JA. Colorimetry of total phenolics with phosphomolybdic phosphotungstic acid reagents. Am. J. Enol. Vitic. 1965;16: 144–158.
Abdalla S, Pizzi A, Ayed N, Bouthoury FC, Charrier B, Bahabri F, Ganash A. MALDI-TOF analysis of Aleppo pine (Pinus halepensis) bark tannin. BioResource. 2014;9: 3396–3406.
28.
View Article Google Scholar
29.
View Article PubMed/NCBI Google Scholar
30.
View Article Google Scholar
31.
View Article Google Scholar
32.
View Article Google Scholar
33.
34.
35.
View Article Google Scholar
36.
37.
View Article Google Scholar
38.
View Article PubMed/NCBI Google Scholar
39.
View Article Google Scholar
40.
View Article Google Scholar
41.
View Article Google Scholar
42.
View Article Google Scholar
43.
View Article Google Scholar
44.
View Article Google Scholar
45.
View Article Google Scholar
46.
View Article Google Scholar
47.
Sharma OP, Bhat TK. DPPH antioxidant assay revisited. Food Chem. 2009;113: 1202–442.
Benzie IF, Strain J. The Ferric Reducing Ability of Plasma (FRAP) as a measure of ‘‘Antioxidant power”: the FRAP assay. Anal. Biochem. 1996;239: 70–76. pmid:8660627
Gan RY, Xu XR, Song FL, Kuang L, Li HB. Antioxidant activity and total phenolic content of medicinal plants associated with prevention and treatment of cardiovascular and cerebrovascular diseases. J. Med. Plants Res. 2010;4: 2438–2444.
Eglinton G, Hunneman D. Gas chromatographic-mass spectrometric studies of long-chain hydroxy acids-I. Phytochemistry 1968;7: 313–322.
Kolattukudy P, Agrawal V. Structure and composition of aliphatic constituents of potato tuber skin. Lipids. 1974;9: 682–691.
Wagenfuhr R, Schreiber C. Holzatlas, V.E.B. 1974.Fachbuchverlag, Leipzig.ok
Puech J-L Vieillissement des eaux-de-vie en fûts de chêne. Extraction de la lignine et de ses produits de degradation. PhD Thesis, 1978, University of Paul Sabatier, Tolouse, France.
Balaban M, Uçar G. Extractives and structural components in wood and bark of endemic oak Quercus vulcanica Boiss. Holzforschung 2001;55: 478–486.
Pettersen RC. The chemical composition of wood. In: The Chemistry of Solid Wood. Rowell R. (ed.). Am. Chem. Soc. 1984; Washington D.C., pp. 57–127.
Şen A, Miranda I, Santos S, Graça J, Pereira H. The chemical composition of cork and phloem in the rhytidome of Quercus cerris bark. Ind. Crop. Prod. 2010;31: 417–422.
Lourenço A, Rencoret J, Chemetova C, Gominho J, Gutierrez A, del Rio JC, Pereira H. Lignin composition and structure differs between xylem, phloem and phellem in Quercus suber. Front. Plant Sci. 2016;7: 1612. pmid:27833631
Pereira H, Graça J, Baptista C. The effect of growth rate on the structure and compressive properties of cork from Quercus suber L. IAWA Bull. 1992;13: 389–396.
Graça J, Pereira H. The periderm development in Quercus suber. IAWA Bull. 2004;25: 325–335.
Nunes E, Quilhó T, Pereira H. Anatomy and chemical composition of Pinus pinea L. bark. Ann. Forest Sci. 1999;56: 479–484.
Baptista I, Miranda I, Quilhó T, Gominho J, Pereira H. Characterisation and fractioning of Tectona grandis bark in view of its valorisation as a biorefinery raw-material. Ind. Crops Prod. 2013;50: 166–175.
Dedrie M, Jacquet N, Bombecka P-L, Héberta J, Richel A. Oak barks as raw materials for the extraction of polyphenols for the chemical and pharmaceutical sectors: A regional case study. Ind. Crop Prod. 2015;70: 316–321.
Touati R, Santos SAO, Rocha SM, Belhamel K, Silvestre AJD. The potential of cork from Quercus suber L. grown in Algeria as a source of bioactive lipophilic and polar compounds. Ind. Crops Prod. 2015;76: 936–945.
Miller DP, Howell GS, Michaelis CS, Dickmann DL. The content of phenolic acids and aldehyde flavor components of white oak as affected by site and species. Am. J. Enol. Vitic. 1992;43: 333–338.
Iqbal E, Salim KA, Lim LB. Phytochemical screening, total phenolics and antioxidant activities of bark and leaf extracts of Goniothalamus velutinus (Airy Shaw) from Brunei Darussalam. J. King Saud Univ. Sci. 2015;27: 224–232.
Santos SAO, Pinto PCRO, Silvestre AJD, Neto CP. Chemical composition and antioxidant activity of phenolic extracts of cork from Quercus suber L. Ind. Crops Prod. 2010;31: 521–526.
View Article Google Scholar
48.
View Article Google Scholar
49.
View Article Google Scholar
50.
View Article Google Scholar
51.
View Article Google Scholar
52.
View Article Google Scholar
53.
54.
View Article Google Scholar
55.
View Article Google Scholar
56.
View Article Google Scholar
57.
View Article Google Scholar
58.
View Article PubMed/NCBI Google Scholar
59.
View Article Google Scholar
60.
View Article Google Scholar
61.
View Article Google Scholar
Miranda I, Lima L, Quilhó T, Knapic S, Pereira H. The bark of Eucalyptus sideroxylon as a source of phenolic extracts with anti-oxidant properties. Ind. Crops Prod. 2016;82: 81–87.
Santos SAO, Villaverde JJ, Freire CSR, Domingues MR, Neto CP, Silvestre AJD. Phenolic composition and antioxidant activity of Eucalyptus grandis, E. urograndis (E. grandis×E. urophylla) and E. maidenii bark extracts. Ind. Crops Prod. 2012;39:120–127.
Seshadri TR, Vedantham TNC. Chemical examination of the barks and heartwoods of Betula species of American origin. Phytochemistry 1971;10: 897–898.
Pazhe A, Zandersons J, Rizhikovs J, Dobele G, Spince B, Jurkjane V, Tardenaka A. Obtaining Pentacyclic Triterpenes from Outer Birch Bark. Latvian Journal of Chemistry. The Journal of Riga Technical University. 2012;51: 415–420.
Chu J-H, Hung S-H, Wang Y-H. Glucosides of the Chinese drug, Chen-Pi-Ying (lIex). Hua Hsueh Hsueh Pao 1958;22: 128–132.
Guenther E. The essential oils. D. Van Nostrand Company, Inc. 1952; New York 5: 254.
Şen A, Melo MMR, Silvestre AJD, Silva CM. Prospective pathway for a green and enhanced friedelin production through supercritical fluid extraction of Quercus cerris cork. J. Supercrit. Fluids 2015;97: 247–255.
Domingues RMA, Sousa GDA, Silva CM, Freire CSR, Silvestre AJD, Neto CP. High value triterpenic compounds from the outer barks of several Eucalyptus species cultivated in Brazil and in Portugal. Ind. Crops Prod. 2011;33: 158–164.
Clermont LP. The fatty acids of aspen, poplar, basswood, yellow birch, and white birch. Pulp Paper Mag. Can. 1961;62: 511–514.
Kull U, Jeremias K. Fatty acid composition of saponifiable lipids from barks of Populus balsamifera during the course of a year. Z. Pflanzenphysiol. 1972;68: 55–62.
Graça J, Pereira H. Suberin structure in potato periderm: glycerol, long-chain monomers, and glyceryl and feruloyl dimers. J. Agric. Food Chem. 2000;48: 5476–5483. pmid:11087505
Morison JIL, Lawlor DW. Interactions between increasing CO concentration and temperature on plant growth. Plant Cell. Environ. 1999;22: 659–682.
Mota GS, Sartori C, Ferreira J, Miranda I, Mori FA, Pereira H. Cellular structure and chemical composition of cork from Plathymenia reticulata occurring in the Brazilian Cerrado. Ind. Crops Prod. 2016;90: 65–75.
Pereira H. The rationale behind cork properties: a review of the structure and chemistry. BioRes. 2015;10: 6207–6229.