Seasonal effects and antifungal activity from bark
chemical constituents of
Sterculia apetala
(Malvaceae)
at Pantanal of Miranda, Mato Grosso do Sul, Brazil
Fernanda Mussi FONTOURA1,2*; Rosemary MATIAS1; Juliane LUDWIG3; Ademir Kleber Morbeck de OLIVEIRA1;
José Antonio Maior BONO1; Pedro de Figueiredo Rocha Barbosa MARTINS4; Joaquim CORSINO5;
Neiva Maria Robaldo GUEDES1,2
1 Universidade Anhanguera - Uniderp, Programa de Pós Graduação em Meio Ambiente e Desenvolvimento Regional, Rua Alexandre Herculano, 1400, Bairro Jardim Veraneio,
79037-280, Campo Grande, Brasil.
2 Instituto Arara Azul, Pesquisa em Conservação, Rua Klaus Sthurk, 106, Jardim Mansur, 79051-660, Campo Grande, Brasil.
3 Universidade Federal da Fronteira Sul, Curso de Agronomia, Campus Cerro Largo, Rua Jacob Reinaldo Haupenthal, 1580, Bloco A, 89812-000, Chapecó, Brasil. 4 Universidade Estadual Paulista Júlio de Mesquita Filho, Laboratório de Plantas Daninhas, Via de Acesso Prof. Paulo Donato Castellane s/n, 14884-900, Jaboticabal, Brasil. 5 Universidade Federal de Mato Grosso do Sul, Laboratório de Química, Cidade Universitária, Universitário, 79070-900, Campo Grande, Brasil.
* Corresponding author: font.fm@gmail.com
ABSTRACT
In the Southern Pantanal, the hyacinth macaw (Anodorhynchus hyacinthinus), an endangered species, often chooses the manduvi tree (Sterculia apetala) as a nesting site, because of its physical properties. In addition, the chemical composition of the wood may also contribute to a nesting selection by the hyacinth macaws. The objective of this study was to determine the main chemical components of S. apetala bark for two seasons, and evaluate its fungicidal potential. Bark samples from S. apetala trees with and without nests of A. hyacinthinus were collected in January (wet season) and August (dry season) of 2012. The inhibition of mycelium growth (MGI) from tree samples with and without nests were assessed using a phytochemical analysis to evaluate their antifungal activity against Trichoderma sp. Phytochemical analysis confirmed the presence of phenolic compounds and flavonoids. In both seasons, samples obtained from nested trees had higher content of total phenols than those collected from non-nested trees. The average content of total flavonoids was higher in January for samples with nest and in August for samples without nest. All selected samples showed antifungal activity, and those with nest collected in August (peak of hyacinth macaw breeding) resulted in an MGI of 51.3%. Therefore, this percentage, related to the content of flavonoids and the presence of coumarins, may influence the reproductive success of hyacinth macaws and other species of birds, in this region. This is the first chemical study report with the stem bark of S. apetala.
KEYWORDS: Manduvi, Anodorhynchus hyacinthinus, Trichoderma sp., secondary metabolites, flavonoids.
Efeitos sazonais e atividade antifúngica dos constituintes químicos das cascas de
Sterculia apetala (Malvaceae) no Pantanal de Miranda, Mato Grosso do Sul, Brasil
RESUMO
No Pantanal Sul, as araras-azuis (Anodorhynchus hyacinthinus), espécie em extinção, escolhem preferencialmente o manduvi (Sterculia apetala) como local de nidificação devido principalmente às características físicas da árvore. Porém, a composição química da madeira também pode interferir nesta seleção. Os objetivos deste trabalho foram determinar as principais classes de substâncias químicas presentes nas cascas de S. apetala em duas épocas do ano e seu potencial antifúngico. As cascas de árvores, com e sem a presença de ninhos de A. hyacinthinus, foram coletadas em janeiro (período de chuvas) e agosto (período de seca) de 2012. Por meio das análises fitoquímicas e quantificação de flavonóides, foram selecionadas amostras de uma árvore com ninho e outra sem ninho para determinar seu potencial antifúngico frente à Trichoderma sp. através da porcentagem de inibição do crescimento micelial (PIC). A investigação fitoquímica do extrato etanólico das cascas revelou a predominância de compostos fenólicos e flavonóides. O teor médio de fenóis totais foi superior para as amostras com ninho, em relação às sem ninho, nos dois períodos de coleta e, para flavonóides, os valores foram superiores em janeiro para a amostra com ninho e em agosto, para sem ninho. As amostras selecionadas apresentaram potencial antifúngico, sendo que com ninho, coletada em agosto (auge do período de reprodução das araras-azuis), resultou em um PIC de 51,3%, valor relacionado aos flavonóides e as cumarinas, fator que pode influenciar o sucesso reprodutivo da arara azul e outras espécies de aves nesta região. Este trabalho foi o primeiro a identificar os componentes químicos da casca do tronco de S. apetala.
INTRODUCTION
The “manduvi” tree or “amendoim-de-bugre” tree (Sterculia apetala), can be found in Central and South American tropical forests, and its population in Brazil occurs in the Pantanal and the Amazon rainforest (Marinho et al. 2010; Santos Jr. et al. 2007). Adult specimens are rare, with a density less than one specimen per hectare (Pinto and Hay 2005), reaching heights of 20-30 meters. The manduvi heartwood is soft and susceptible to branch breakage and decomposition by microorganisms, and consequently causes the formation of cavities used as shelter and/or nest for more than 20 species of animals, such as the endangered hyacinth macaw (Anodorhynchus hyacinthinus Latham) (Santos Jr. et al. 2007; Guedes and Candisani 2011).
In the Pantanal of Miranda - MS, more than 90% of hyacinth macaw nests are found in S. apetala’s cavities, and the availability of the tree can be a limiting resource for their reproduction (Santos Jr. et al. 2007). The choice of manduvi by A. hyacinthinus is mainly due to physical characteristics of the tree (Guedes and Candisani 2011), but other factors can be considered, such as the chemical composition of the wood itself, which, depending on its nature, may act as a biocide, making it naturally more resistant to pathogenic activities.
Studies with other Sterculia species report a diversified chemical profile, with the presence of steroids, triterpenes, flavonoids, alkaloids, phenolic compounds (Costa et al. 2010) and fatty acids (Aued-Pimentel et al. 2004); there are reports of antifungal activity in other species of the same genus (Fenner et al. 2006; Tania et al. 2013).
Some wood-inhabiting fungi are able to infect bark wounds of living trees, causing structural damages to the trees (Meysami and Baheri 2003). Trichoderma genus is an example of a rapid growing fungus species that occurs in all climate zones (Kubicek et al. 2003) that can cause tree damage.
Considering the importance of the manduvi tree for hyacinth macaw conservation as well as for maintenance of biodiversity in the Pantanal (Santos Jr. et al. 2007), the aim of this study was to determine the main classes of chemical compounds present in the Sterculia apetala bark, comparing them in the dry and wet seasons, and evaluate the fungicidal potential on mycelial growth of Trichoderma sp.
MATERIALS AND METHODS
Plant material
The bark samples of Sterculia apetala Jaqc. Karst (Malvaceae) were collected (one meter from the ground) in January (wet season) and August (dry season), 2012, at Fazenda Caiman (19º51´to 19º58´S and 56º17´to 56º 24´W), in Miranda city, Mato Grosso do Sul, Brazil. The area
is situated between the southeastern limit of the Pantanal and the Aquidauna River, Aquidauana sub region. The average annual temperature is 25 ºC with two well defined seasons: the dry winter and the rainy summer. The rainy period occurs from November to April. This region includes deciduous and semi-deciduous forests, wet grasslands, elongated strands of forest (“Cordilheiras”), forest islands (“Capões”), riparian forest, temporary rivers (“Vazantes”), scattered pools (“Baías”) and grasslands with exotic grass (Silva et al. 2000).
Bark samples were removed with a chisel, from 16 trees in January, and again from the same trees, in August. Eight of these 16 trees were used for nesting by hyacinth macaws (marked by the Hyacinth Macaw Project – “Projeto Arara-Azul”). Trees were considered nests when at least one egg was present in the previous breeding season (2011). The chisel wounds were sealed with solid vaseline to prevent pathogen development. The samples were named SN1 to SN8 for trees without nest and CN1 to CN8 for trees with nest. The samples were oven-dried at 45 °C (MA35, Marconi, Piracicaba, SP, Brazil) for 14 days and grinded with a milling machine (MA048, Marconi, Piracicaba, SP, Brazil) into a uniform powder. Exsiccates were deposited in the herbarium of the “Universidade Anhanguera-Uniderp” (n° 7946, n° 7947).
The calculation of ethanolic yield from the extracts is important information for species that have no phytochemical studies. In order to do this, an ethanol filtrate with 50 g of dried sample (60 mesh particle size) at room temperature for 5 days was made by maceration, and then the filtrates were evaporated in a rotary evaporator (MA120, Tecnal, Piracicaba, SP, Brazil). The yield percentage of the ethanolic extract obtained was calculated using the relations: Yield (%) = (weight of dried extract / weight of oven dried specimen) x 100 (Alves et al. 2012).
Phytochemical analysis
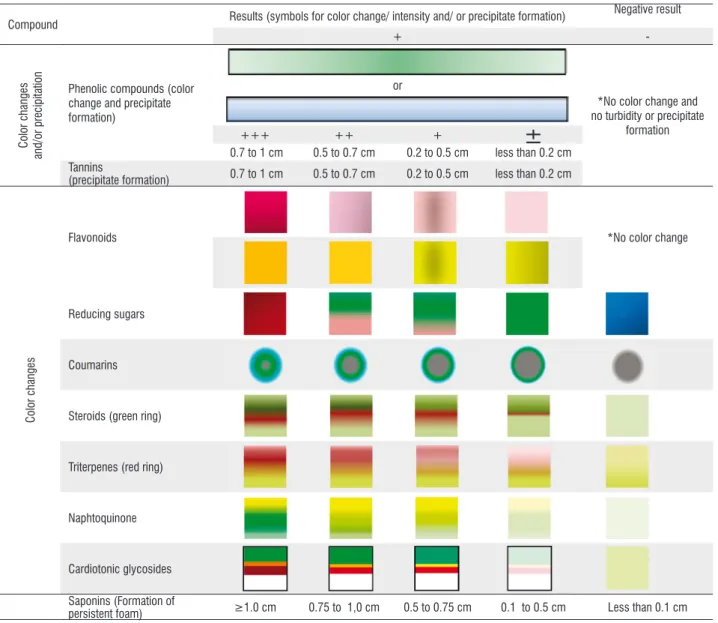
The bark samples were analyzed three times and compared to the control sample (ethanolic extract - 20 g of dried plant in 100 mL of ethanol), by observing the color alteration and precipitation of the filtrate (Costa 2002). Changes in color, for each test, were classified as being of partial (±), low (+), moderate (++), high intensity (+++) and negative (-). The tests with precipitate formation (phenolic compounds and tannins) were carried out in graduate tubes (No.8080, Pyrex®) and considered as being of partial (less than 0.2 cm), low (0.2 to 0.5 cm), moderate (0.5 to 0.7 cm) and high intensity (0.7 to 1 cm) (Table 1).
The frequency for the classes of secondary metabolites was determined for the two sampling periods (January and August 2012). A frequency of 100% was considered for samples where a secondary metabolite class was present in all samples and periods.
Total phenols
Phenols were determined by Folin-Ciocalteu’s method, by using 100 mg of ethanolic crude extract. The absorbance of each sample was measured using a spectrophotometer (7000S, Femto, São Paulo, SP, Brazil) at 750 nm (Sousa et al. 2007),
Table 1. Scale of color and precipitation intensity in ethanolic extracts obtained from barks of Sterculia apetala. Test description (Matos 2009): Phenolic compounds: 2% ferric-chloride, 10% lead acetate and 4% copper acetate. Tannins: iron salt reaction and protein precipitation, B-I and B-II. Flavonoids: cyanidin reaction and sulphuric acid, A-I and A-II. Coumarins: analysis under UV light. Naphthoquinone: acid/base reaction. Steroids and triterpens: Liebermann-Burchard reaction. Cardiotonic glycosides: Keller-Killiani and Pesez tests. Saponin: Lieberman-Buchard reaction and foaming index. Reducing sugars: Benedict. *Corresponding to the color of the etanolic extract. This table is in color in the electronic version.
Compound Results (symbols for color change/ intensity and/ or precipitate formation)
Negative result
+
-Color changes
and/or precipitation
Phenolic compounds (color change and precipitate formation)
or
*No color change and no turbidity or precipitate
formation
+++ ++ +
±
0.7 to 1 cm 0.5 to 0.7 cm 0.2 to 0.5 cm less than 0.2 cm Tannins
(precipitate formation) 0.7 to 1 cm 0.5 to 0.7 cm 0.2 to 0.5 cm less than 0.2 cm
Color changes
Flavonoids *No color change
Reducing sugars
Coumarins
Steroids (green ring)
Triterpenes (red ring)
Naphtoquinone
Cardiotonic glycosides
Saponins (Formation of
with a quartz cuvette. The total phenols was calculated by interpolating absorbance values against a calibration curve [standard curve equation: y = 0.0021x + 0.6691; r² = 0.9978], built by using the gallic acid standard (gallic acid equivalent – GAE, 10 to 300 μg mL-1).
Determination of total flavonoids
The method of Sobrinho et al. (2008) was used to quantify flavonoids in crude ethanolic extracts (100 mg). Quercetin (QE = 0.5 mg mL-1) was used for the standard
calibration curve at 0.04; 0.2; 0.4; 2; 4; 8; 12; 16; 20 μg mL-1
concentrations, and a standard curve was obtained using the formula: y= 0.0465x + 0.0213; r²= 0.9993. The absorbance was measured using a spectrophotometer at 420 nm and a quartz cuvette.
The tests for phenols and flavonoids were made with three replications for each concentration and the mean and the standard deviation values were calculated. The data were submitted to ANOVA (α ≤ 5%) using BioEstat 5.3 software (Ayres et al. 2007).
Antifungal activity bioassays
For the antifungal activity bioassays, the samples with the highest flavonoids rate (SN2 and CN4) were selected. To acquire the UV-visible spectra, an aliquots (10 mg mL-1)
of given crude ethanolic extracts was used. The absorbance spectra was determined at 200 to 600 nm wavelengths and they were characterized through the FTIR spectra (MB Series, BOMEM 157 FT-IR spectrometry, Canada) of either KBr pellets or CHCl3 films, in the frequency range 4000-400 cm-1
(Silverstein and Webster 2000).
Mycelial growth essay
The fungus (Trichoderma sp.) colonies used for the antifungal bioassays were preserved in PDA (potato-dextrose-agar) growth medium, in tubes under low temperature (5 °C). Seven days before the bioassays, the fungus was replicated into Petri dishes containing sterile growth medium (PDA) and incubated in a BOD (Biochemical oxygen demand) at a temperature of 22 ± 2 °C.
For each bark, ethanolic extract, a main solution (200 mg 100 mL-1), was prepared, in a 100 mL volumetric flask, using
0.2 g of crude ethanolic extract with 5 μL of DMSO (dymethyl sulfoxide), completing the volume with hydro-ethanolic solution at 20%. Thereafter, the solution was added to sterilized PDA at the fusion point (± 45 °C), at 200, 400, 800, 1600 and 2000 μg mL-1. Two control treatments were used in the bioassays:
one containing only PDA and another containing DMSO + 20% hydro-ethanolic solution diluted in the PDA. Then, 10 mL of each were poured into sterilized Petri dishes and a 0.5 cm diameter disc containing mycelia and spores of Trichoderma sp. was placed in the center of the dish. The Petri dishes were sealed
with parafilm and stored in a BOD chamber (CE-300/350-F, CIENLAB, Campinas, Brazil) at 25 °C. Mycelial growth was measured daily using a ruler to determine the diameter of the colonies (mean value of two perpendicular measurements) until the control treatment colony reached the border of the dish. From mycelial growth data, the percentage of growth inhibition was calculated based on the control sample (Menten et al. 1976).
PGI (%) = 100 x [(diameter of sample control – diameter of sample treated)] / diameter of sample control
Complete randomized experimental design was used with four replications and, for analysis of variance, F test was applied (α ≤ 5%). When the results were significant, non-linear regression analysis (α ≤ 1%) was applied for doses at each collecting site (CN or SN), for both seasons. This research was carried out observing all legal formalities required for this kind of investigation, no conflict of interest.
RESULTS
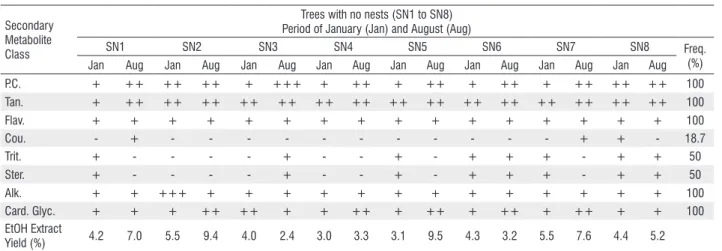
The phytochemical analysis indicated the presence of phenolic compounds, flavonoids, tannins, alkaloids and cardiotonic glycosides, changing only in the intensity, except for coumarins, which showed a frequency of 18.7% and 37.5% and steroids and triterpenes, with a frequency of 50% and 43.7%, for SN and CN samples, respectively (Tables 2 and 3). This is the first work to report a chemical study with the stem bark of S. apetala.
With respect to the intensity of analyzed substances from samples in both seasons, the phenolic compounds had the highest values during August (moderate intensity). Tannins and alkaloids were constant in both seasons (moderate and low intensity, respectively). For trees without nests, the intensity of flavonoids was the same in both seasons (low intensity), and for CN samples, there were variations, with higher intensities in January. The cardiotonic glycosides ranged between seasons, with more intensely in August.
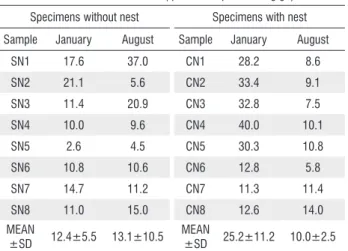
In both seasons, the average values of total phenol were different and higher for trees with nests (CN1 to CN8) when compared to those without nests (SN1 to SN8); seasonal effects on the average value of total phenols were observed only for specimens without nests, differing statistically between January and August (Table 4).
Table 2. Results of phytochemical analysis and extraction yield of S. apetala barks from specimens without nests (SN) collected in January (Jan) and August (Aug), 2012, at the Pantanal of Miranda – MS
Secondary Metabolite Class
Trees with no nests (SN1 to SN8) Period of January (Jan) and August (Aug)
SN1 SN2 SN3 SN4 SN5 SN6 SN7 SN8 Freq.
(%) Jan Aug Jan Aug Jan Aug Jan Aug Jan Aug Jan Aug Jan Aug Jan Aug
P.C. + ++ ++ ++ + +++ + ++ + ++ + ++ + ++ ++ ++ 100
Tan. + ++ ++ ++ ++ ++ ++ ++ ++ ++ ++ ++ ++ ++ ++ ++ 100
Flav. + + + + + + + + + + + + + + + + 100
Cou. - + - - - + + - 18.7
Trit. + - - - - + - - + - + + + - + + 50
Ster. + - - - - + - - + - + + + - + + 50
Alk. + + +++ + + + + + + + + + + + + + 100
Card. Glyc. + + + ++ ++ + + ++ + ++ + ++ + ++ + + 100
EtOH Extract
Yield (%) 4.2 7.0 5.5 9.4 4.0 2.4 3.0 3.3 3.1 9.5 4.3 3.2 5.5 7.6 4.4 5.2
P.C.= Phenolic Compounds, Tan.= Tannins, Flav.= Flavonoids, Cou.= Coumarins, Trit.= Triterpenes, Str.= Steroids, Alk.= Alkaloids, Card. Glyc. = Cardiotonic Glycosides, (+) low intensity, (++) medium intensity, (+++) high intensity, (+/-) partial, (-) negative, Freq.= frequency of secondary metabolites.
Table 3. Results of phytochemical analysis and extraction yield of S. apetala barks from specimens with nests (CN) collected in January (Jan) and August (Aug), 2012, at the Pantanal of Miranda – MS
Secondary Metabolite Class
Trees with nests (CN1 to CN8) Period of January (Jan) and August (Aug)
CN1 CN2 CN3 CN4 CN5 CN6 CN7 CN8 Freq.
(%) Jan Aug Jan Aug Jan Aug Jan Aug Jan Aug Jan Aug Jan Aug Jan Aug
P.C. + ++ + ++ +++ ++ + ++ ++ ++ ++ ++ ++ +++ ++ ++ 100
Tan. ± ++ ++ ++ ++ ++ ++ ++ ++ ++ ++ ++ ++ ++ ++ ++ 100
Flav. + + ++ + +++ + ++ + ++ + ++ + + + + + 100
Cou. - + - - - + - + - + - - - + - + 37.5
Trit. +++ - - + - - - - + - + - + + + - 43.7
Ster. +++ - - + - - - - + - + - + + + - 43.7
Alk. ++ ± + ± + + + + + + + + + + + + 100
Card. Glyc. ++ +++ + ++ + + + ++ + + + + + + + + 100
EtOH Extract
Yield (%) 3.7 10.0 3.9 2.1 3.4 7.3 3.9 3.8 2.3 4.8 5.1 6.2 5.1 6.4 3.8 2.9 P.C.= Phenolic Compounds, Tan.= Tannins, Flav.= Flavonoids, Cou.= Coumarins, Trit.= Triterpenes, Str.= Steroids, Alk.= Alkaloids, Card. Glyc. = Cardiotonic Glycosides, (+) low intensity, (++) medium intensity, (+++) high intensity, (+/-) partial, (-) negative, Freq.= frequency of secondary metabolites
Thus, the average for total phenols and flavonoids of the ethanolic extracts from the bark of S. apetala were more representative for CN samples in August. As mentioned before, the flavonoids have a diversity of bioactivities, such as the antifungal potential. Therefore, based on these results (highest total flavonoids rates), SN2 and CN4 samples were chosen for phytochemical and fungicidal assays.
For the selected samples SN2 and CN4, the results of phytochemical analysis indicate the presence of phenolic compounds, flavonoids, hydrolysable and condensed tannins, alkaloids and cardiotonic glycosides, independently of collection season (Tables 2 and 3). These results also differ regarding their intensities, indicating that environmental
factors are influencing the biosynthesis of secondary metabolites. Only CN4 extracts, from August, indicated the presence of coumarins in low intensity.
Every sample showed significant difference (α=5%) for flavonoids rates, both among the samples themselves or in relation to the collection season of the same sample (Table 5). Overall, results obtained from the visible-UV spectra scanning on SN2 and CN4, from either season, indicated that both samples had maximum absorption (λmáx.MeOH) between 280
Figure 1. Historical mean values of temperature (A), relative humidity (B) and pluviosity (C) from 2008 to 2011, compared to 2012, at the municipality of Miranda – MS. Source: Centro de Monitoramento de Tempo, do Clima e dos Recursos Hídricos de MS - CEMTEC (AGRAER 2010). Data were collected on 2013.
Table 4. Total phenol content from specimens of S. apetala with nests (CN1 to CN8) and without nests (SN1 to SN8) in January and August, 2012, collected from the Pantanal of Miranda - MS
Total phenol content (gallic acid equivalent mg g-1)
Specimens without nests Specimens with nests
Sample January August Sample January August
SN1 103.2 65.5 CN1 88.6 80.2
SN2 48.7 46.6 CN2 46.6 52.9
SN3 63.4 46.6 CN3 73.9 52.9
SN4 44.5 44.5 CN4 46.6 40.3
SN5 44.5 46.6 CN5 50.8 50.8
SN6 42.4 42.4 CN6 14.2 55.0
SN7 57.1 52.8 CN7 82.3 76.0
SN8 57.6 71.8 CN8 69.7 69.7
MEAN/
SD 57.7 ±19.9 44.1±10.8 MEAN/
SD 59.1±24.3 59.7±13.9
Table 5. Total flavonoids content from specimens of S. apetala with nests (CN1 to CN8) and without nests (SN1 to SN8)in January and August, 2012, collected from Pantanal of Miranda - MS
Total flavonoids content (quercetin equivalent mg g-1)
Specimens without nest Specimens with nest
Sample January August Sample January August
SN1 17.6 37.0 CN1 28.2 8.6
SN2 21.1 5.6 CN2 33.4 9.1
SN3 11.4 20.9 CN3 32.8 7.5
SN4 10.0 9.6 CN4 40.0 10.1
SN5 2.6 4.5 CN5 30.3 10.8
SN6 10.8 10.6 CN6 12.8 5.8
SN7 14.7 11.2 CN7 11.3 11.4
SN8 11.0 15.0 CN8 12.6 14.0
MEAN
±SD 12.4±5.5 13.1±10.5 MEAN
±SD 25.2±11.2 10.0±2.5
In both seasons, the infrared (IR) spectra of SN2 and CN4 showed a broad band at 3410 cm-1, suggesting hydroxyl
group, the phenolic OH and/or alcohol. Two bands at 2959 and 2846 cm-1 refers to CH stretching of methyl groups and/
or methylene. Absorptions for axial deformation of aromatic carbon, C-C double bond was observed between 1606 and 1472 cm-1 revealing the aromatic character of the samples.
Comparing these values with infrared spectrum (IR) of flavonoids this spectral analysis corroborated with the results for this class of metabolite in all samples (Silva et al. 2005).
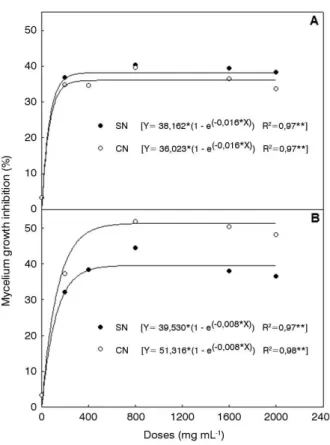
Regarding the statistical analysis from the antifungical activity against Trichoderma sp., there was a triple interaction between dose, season and place of collection, for the inhibition of mycelial growth (Figure 2). All the ethanolic extracts of S. apetala inhibited fungal development beginning with the dose of 200 μg mL-1, following a constant pattern for subsequent
concentrations. The inhibition effect was significant regardless of the dose applied.
In January, the SN2 sample inhibited the fungal growth by 38.1%, and the CN4 sample, by 36%; these results were statistically different between them. As for the August sampling, SN2 inhibited the fungus by 39.5%, and CN4, by 51.3%, indicating a significant increase on the inhibitory effects when compared to the samples collected in January.
DISCUSSION
The phytochemical analysis indicated that samples from trees with nests have a higher variability of compounds than trees without nests, regarding coumarins, triterpenes, and steroids. There are many f-actors capable of altering the synthesis of plant secondary metabolites including, temporal and spatial variation. These factors result from biochemical, physiological, ecological and adaptive processes (Gouvea et al. 2012). Bark samples of trees with and without nests were acquired from specimens in the same region (Pantanal of Miranda). Therefore, spatial variation is not probably a factor determining secondary metabolites changes; but seasonal effects most likely cause some variation. Gouvea et al. (2012) indicate strong correlations between the sampling period and the metabolite concentration patterns, because the kind of compound and its quantity are inconsistent throughout the year.
When comparing S. apetala yield extracts from specimens with and without nests, collected in January and in August, it was possible to detect variations between different samples (SN and CN) and the highest yields were obtained in samples collected in August, the dry season.
In the dry season, most extracts of plants from the Cerrado biome show a higher alcoholic yield, for example, Croton urucurana Baill has hydroalcoholic extracts. However, some species show an opposite behavior to C. urucurana and others do not show fluctuation in the mean alcoholic extract yield (Alves et al. 2012).
These results indicate that plants respond differently to environmental stimulus, changing from different species or even between the same species (Verpoorte and Memelink 2002), as observed in this study. As for other Sterculia species, no studies about alcoholic extract yields regarding seasonal aspects have been found.
Average rates of total phenols found in this study for S. apetala barks were lower than S. striata ethanolic extracts (63.9 mg GAE g of sample) (Costa et al. 2010), S. setigera methanolic extracts (61.3 mg GAE 100 mg) (Konaté et al. 2011), and S. rhynopetala extracts(100 mg g-1) (Huang et al.
2009). For S. setigera leaves collected on the Western Africa region, total phenols from hydroacetonic extract and its fractions varied between 13.2 and 30.0 mg GAE g of sample (Ouédraogo et al. 2013).
The amount of phenols from trees with nests (CN1 to CN8) during the sampling months demonstrated that these trees invest in synthesizing these compounds which may act in defense against herbivore or pathogen attacks, especially when the trees are sheltering eggs and/or hyacinth macaws chicks, at the peak of the reproductive season (August).
The group of phenolic compounds is diversified in relation to its chemical composition and biological activity. Phenol production may be linked to carbon metabolism, varying with climate and the photosynthetic efficiency of each season (Taiz and Zeiger 2004).
Seasonal effects such as photoperiod, light intensity and temperature, may interfere in the production of secondary metabolites as a plant strategy defense (Gobbo-Neto and Lopes 2007). Phenols act as defense agents against different kind of stress such as pathogen attacks or adverse environmental conditions (Amaral et al. 2004), and they may cause alterations in their content when monitored throughout an entire year (Yao et al. 2005). For example, Monteiro et al. (2006) observed that tannin content of leaves and barks from Caatinga species has different adaptive strategies to face dry and wet seasons, showing a strong relationship to seasonality.
The average flavonoids content from barks of S. apetala found in this experiment (Table 5) was higher than those described for the methanolic extracts of S. setigera (0.515 ± 0.005 mg GAE 100 mg) collected in Africa (Konaté et al. 2011). Studies conducted with hydroacetonic extract from the leaves of the same S. setigera describe a flavonoids content variation of 3.6 to 8.2 mg quercetin eq. g (Ouédraogo et al. 2013).
Figure 2. Effect of Sterculia apetala barks ethanolic extracts from specimens with nests (CN) and without nests (SN), 2012, against mycelial growth of
Flavonoids are known for their antioxidant properties and for defense against bugs, fungi, viruses and bacteria. It has been reported that flavonoids synthesized in plants tend to increase in periods with high light incidence, due to the protecting function of these compounds against ultraviolet radiation (Taiz and Zeiger 2004). Irradiance can be associated with the high rate of flavonoids found in S. apetala barks collected in January, when days are warmer and irradiance is higher. Borella et al. (2001) showed that flavonoids rates in Baccharis trimera Less collected in the summer have 72% more flavonoids than samples collected in other seasons. Similar results were found for ethanolic extracts from the bark of S. striata, S. urens and S. rhynopetala (Costa et al. 2010; Ogundare and Olajuyigbe et al. 2012) for the class of secondary metabolites found in SN2 and CN4 samples. Souza et al. (2003), evaluating qualitatively secondary metabolites in Vanillomopsis erythropappa for 12 months, stated that flavonoids, tannins, triterpenes, steroids and saponins underwent fluctuations over time.
The values of total flavonoids are affected by seasonality for SN and CN, with CN samples having higher rates compared to the others. Generally, January (flooding season) showed the highest flavonoids rates, when compared to August (dry season), for both samples. That might be explained by the protective function of flavonoids against UV rays, which are more intense during the summer (January).
In the analysis of the absorption spectrum in the UV-visible region it was evident that for the SN2 samples, the amount of flavonoids during the wet season (January) was higher than in the dry season (August). The wet season is characterized by higher temperatures, relative humidity and rainfall, when compared to the dry season. CN4 samples followed the same pattern for the analyzed periods.
Secondary metabolites are compounds characterized by their great structural diversity, but restricted to certain families. Such chemical diversity makes those compounds fundamental traits of adaptive and coevolutionary processes of plants, as the phytochemical profile of a certain species, and even individuals among the same species, might be influenced by the environment (Gobbo-Neto and Lopes 2007). Inhibition of mycelial growth of Trichoderma sp. in the concentrations studied support the use of S. apetala barks in folk medicine for treatment against skin diseases (Morton 1981). Those properties are also reported for many species belonging to the same genus that show similar properties in different plant parts (Naik et al. 2004; Tania et al. 2013).
Phenolic compounds, particularly flavonoids and tannins, are within the chemical group that play a role in plant resistance to fungi attacks (Agrios 2005). Walker (2006) cites terpenes and their derivates, tropolones and phenolic compounds, such as: flavonoids, stilbenes, quinines, lignans
and tannins as the main cause for hindering the development of wood-decay fungi.
Nsolomo et al. (2000) identified Trichoderma spp. on the stems and trunks of live Ocotea usambarensis, indicating that they are the pioneer colonizers responsible for heartwood decay in this species. The species S. apetalus is more susceptible to fungus attacks when there are broken twigs and when they are used as nests, because chipped parts of the tree are used by hyacinth macaws in building their nests (Oliveira et al 2008). Consequently, this exposure of the manduvi heartwood may provide an entrance for opportunistic fungi. In this region, growth conditions for microorganisms are even more favorable during the wet season because of the higher temperatures and relative humidity.
In the Southern Pantanal, the mating season of hyacinth macaws lasts from July to January (Guedes and Candisani 2011). For this reason, sampling for this study was carried out to include the end (January – flooding season) and the peak (August – dry season) of A. hyacinthinus mating season. TheCN4 sample collected during these peaks had the highest antifungal potential, proportional to the flavonoids rate and the detection of coumarins. As mentioned before, it is possible that these two metabolites are responsible for inhibiting fungal growth.
Flavonoids can be found in many plant organs, acting on defense mechanisms or as molecular signals in symbiotic systems (Shaw et al. 2006). In the fungus-plant relationships, they may act as phytoalexins in pathogenic systems, on chemotaxis and spore germination and as antifungal substances (Taiz and Zeiger 2004).
Coumarins are known for their antifungal activity and are mostly present in Apiace (Umbeliferae), Rutaceae, Fabaceae (Leguminosae) and Asteraceae (Compositae), also showing anticoagulant, antibacterial, anticarcinogenic, anti-inflammatory, antioxidant, lipolytic and antiallergenic potentials (Chaves et al. 2010). Furthermore, there are studies that report the presence of coumarins in Malvaceae resulting in antifungal activities (Abad et al. 2007).
The phytochemical and UV and IR spectroscopy investigation of ethanolic extracts from Sterculia apetala barks collected in the Pantanal of Miranda show that chemical compounds are affected by seasonality, with a predominance of phenolic compounds and their derivatives (flavonoids and coumarins), indicating that environmental characteristics can affect metabolic responses and to be important for the species.
CONCLUSIONS
promoting the highest inhibition on the fungus mycelium. A strong correlation was found between the highest rates of phenolic compound and antifungical activity during the wet season (January) and highest rates of total flavonoids and presence of coumarin during the dry season (August). The results of this study indicate that seasonal variation in the amount of total phenols and flavonoids in bark samples of Sterculia apetala suggests the action of these substances in the chemical defense against possible pathogens.
ACKNOWLEDGMENTS
The authors are grateful to the Conselho Nacional de Desenvolvimento Científico e Tecnológico (CNPq), Coordenação de Aperfeiçoamento de Pessoal de Nível Superior (CAPES), Instituto Nacional de Áreas Úmidas (INAU) and Centro de Pesquisa do Pantanal (CPP) for financial support; to Hyacinth Macaw Project, Refúgio Ecológico Caiman and Fundação Toyota do Brasil for the logistic support; to CAPES for scholarship to FM Fontoura.
REFERENCES
Aued-Pimentel, S.; Lago, J.H.G.; Chaves, M.H.; Kumagai, E.E. 2004. Evaluation of a methylation procedure to determine cyclopropenoids fatty acids from Sterculia striata St. Hil. Et Nauds seed oil. Journal of Chromatography A, 1054: 235-239. Abad, M.J.; Ansuategui, M.; Bermejo, P. 2007. Active antifungal
substances from natural sources. Arkivoc, 7: 116-145.
Agrios, G.N. 2005. Plant Pathology. 5ed. Academic press, San Diego. 803p.
AGRAER (Agência de Desenvolvimento Agrário e Extensão Rural). 2010. Boletins meteorológicos (www.agraer.ms.gov.br/cemtec). Accessed on 26/08/2013.
Alves, M.M.; Soares Pereira, A.M.; Pereira, P.S.; Castro França, S.; Bertoni, B.W. 2012. Caracterização química qualitativa de tinturas e extratos secos de plantas medicinais do Cerrado por cromatografia em camada delgada comparativa. Scientia Plena, 12: 2-8. Amaral, J.S.; Seabra, R.M.; Andrade, P.B.; Valentão, P.; Pereira,
J.A.; Ferreres, F. 2004. Phenolic profile in the quality control of walnut (Juglans regia L.) leaves. Food Chemistry, 88: 373-379. Ayres, M.; Ayres Júnior, M.; Ayres, D.L.; Santos, A.S. 2007. BioEstat
5.0 – aplicações estatísticas nas áreas das ciências biológicas e médicas. Sociedade Civil Mamirauá, Belém, 364p.
Borella, J.C.; Fontoura, A.; Menezes Jr, A.; França, S.C. 2001. Influência da adubação mineral (NPK) e sazonalidade no rendimento e teor de flavonóides em indivíduos masculinos de
Baccharis trimera (Asteraceae)-Carqueja. Revista Brasileira de Plantas Medicinais, 4: 101-104.
Chaves, D.S.A.; Costa, S.S.; de Almeida, A.P.; Frattani, F.; Assafim, M.; Zingali, R.B. 2010. Metabólitos secundários de origem vegetal: uma fonte potencial de fármacos antitrombóticos.
Química Nova, 33: 172-180.
Costa, A.F. 2002. Farmacognosia. 6ed. Calouste Gulbenkian, Lisboa, 824p.
Costa, D.A.; Chaves, M.H.; Silva, W.C.S.; Cost, C.L.S. 2010. Constituintes químicos, fenóis totais e atividade antioxidante de
Sterculia striata St. Hil. et Naudin. Acta Amazonica, 40: 207-212. Fenner, R.; Betti, A.H.; Mentz, L.A.; Rates, S.M.K. 2006. Plantas
utilizadas na medicina popular brasileira com potencial atividade antifúngica. Brazilian Journal of Pharmaceutical Sciences, 42: 369-394.
Gobbo-Neto, L.; Lopes, N.P. 2007. Plantas medicinais: fatores de influência no conteúdo de metabólitos secundários. Química Nova, 30: 374-381.
Gouvea, D.R.; Gobbo-Neto, L.; Sakamoto, H.T.; Lopes, N.P.; Lopes, J.L.C.; Meloni, F.; et al. 2012. Seasonal variation of the major secondary metabolites present in the extract of Eremanthus mattogrossensis Less (Asteraceae: Vernonieae) leaves. Química Nova, 35: 2139-2145.
Guedes, N.M.R.; Candisani, L. 2011. Joias azuis no céu do Pantanal - A história do Projeto Arara Azul que está ajudando na conservação da biodiversidade. DBA Editora, São Paulo, 128p.
Huang, Z.; Hashida, K.; Makino, R.; Kawamura, F.; Shimizu, K.; Kondo, R.; et al. 2009. Evaluation of biological activities of extracts from 22 African tropical wood species. Journal of Wood Science, 55: 225-229.
Konaté, K.; Kiendrébéogo, M.; Ouattara, M.B.; Souza, A.; Lamien-Meda, A.; Nongasida, Y. 2011. Antibacterial potential of aqueous acetone extracts from five medicinal plants used traditionally to treat infectious diseases in Burkina Faso. Current Research Journal of Biological Sciences, 3: 435-442.
Kubicek, C.P.; Bissett, J.; Druzhinina, I.; Kullnig-Gradinger, C.; Szakacs, G. 2003. Genetic and metabolic diversity of
Trichoderma: a case study on South-East Asian isolates. Fungal Genetics and Biology, 38: 310-319.
Marinho, T.A.S.; Piedade, M.T.; Wittmann, F. 2010. Distribution and population structure of four Central Amazonian high-várzea timber species. Wetlands Ecology and Management, 18: 665-677. Matos, J.F.A. 2009. Introdução a fitoquímica experimental. UFC,
Fortaleza. 150p.
Menten, J.O.M.; Machado, C.C.; Minussi, E. 1976. Efeito de alguns fungicidas no crescimento micelial de Macrophomina phaseolina (Tass.) Goid. “in vitro”. Fitopatologia Brasileira, 1: 57-66. Meysami, P.; Baheri, H. 2003. Pre-screening of fungi and bulking
agents for contaminated soil bioremediation. Advances in Environmental Research, 4: 881-887.
Monteiro, J.M.; Albuquerque, U.P.; Lins Neto, E.M.; Araújo, E.L.; Albuquerque, M. M.; Amorim, E.L. 2006. The effects of seasonal climate changes in the Caatinga on tannin levels in Myracrodruon urundeuva (Engl.) Fr. All. and Anadenanthera colubrina (Vell.) Brenan. Revista Brasileira de Farmacognosia, 16: 338-344. Morton, J.F. 1981. Atlas of Medicinal Plants of Middle America. C.C.
Thomas Ed., Springfield, 1448p.
Nsolomo, V.R.; Solheim, H.; Venn, K. 2000. In vitro effects of oxygen stress on fungi growing in wood of Ocotea usambarensis.
Mycological Research, 104: 1480-1484.
Ogundare, A.O.; Olajuyigbe, A.O. 2012. Bioactivity guided isolation of the antifungal components in sawdust extracts of
Piptadeniatrum africanum, and Terminalia ivorensis. Malaysian Journal of Microbiology, 8: 34-41.
Oliveira, A.K.M.; Barbosa, L.A.; Favero, S. 2008. Entomofauna encontrada em ninhos de arara-azul (Anadorhynchus Hyacinthinus) no Pantanal Sul. In: Oliveira, A.K.M.; Garnés, S.J.A.; Figueiredo, R.S. (Org.). Meio Ambiente e Produção Interdisciplinar: Sociedade, Natureza e Desenvolvimento - Volume II. 1ed. Campo Grande: UNIDERP. p. 138-150.
Ouédraogo, M.; Konaté, K.; Zerbo, P.; Barro, N.; Sawadogo, L.L. 2013. Phytochemical analysis and in vitro antifungal profile of bioactive fractions from Sterculia setigera (Sterculiaceae). Current Research Journal of Biological Sciences,5: 75-80.
Pinto, J.R.R.; Hay, J.D.V. 2005. Mudanças florísticas e estruturais na comunidade arbórea de uma floresta de vale no Parque Nacional da Chapada dos Guimarães, Mato Grosso, Brasil.
Revista Brasileira de Botânica, 28: 523-539.
Santos Jr, A.; Tomas, W.M.; Ishii, I.H.; Guedes, N.M.R.; Hay, J.D. 2007. Occurrence of Hyacinth Macaw nesting sites in Sterculia apetala in the Pantanal Wetland, Brazil. Gaia Scientia, 1: 127-130. Shaw, L.J.; Morris, P.; Hooker, J.E. 2006. Perception and modification of plant flavonoid signals by rhizosphere microorganisms.
Environmental Microbiology, 11: 1867-1880.
Silva, D.A.; Costa, D.A.; Silva, D.F.; Souza, M.F.V.; Agra, M.F.; Medeiros, I.A.; et al. 2005. Flavonóides glicosilados de Herissantia tiubae (K. Schum) Brizicky (Malvaceae) e testes farmacológicos preliminares do canferol 3,7-di-O-α-L-ramnopiranosídeo.
Revista Brasileira de Farmacognosia, 15: 23-29.
Silva, M.D.; Mauro, R.; Mourao, G.; Coutinho, M. 2000. Distribuição e quantificação de classes de vegetação do Pantanal através de levantamento aéreo. Revista Brasileira de Botânica, 23: 143-152.
Silverstein, R.M.; Webster, F.X. (editors). 2000. Identificação espectrométrica de compostos orgânicos. 6ed. LTC, Rio de Janeiro. 460p.
Sobrinho, T.J.S.P.; Silva, C.H.T.P.; Nascimento, J.E.; Monteiro J.M.; Albuquerque, U.P.; Amorim, E.L.C. 2008. Validação de metodologia espectrofotométrica para quantificação dos flavonóides de Bauhinia cheilantha (Bongard) Steudel. Revista Brasileira de Ciências Farmacêuticas,44: 683-689.
Sousa, C.M.; Silva, H.R.E.; Vieira-Jr, G.M.; Ayres, M.C.C.; Costa, C.L.S.; Araújo, D.S.; et al. 2007. Fenóis totais e atividade antioxidante de cinco plantas medicinais. Química Nova, 30: 351-355.
Souza, O.V.S.; Oliveira, M.S.; Rabello, S.V.; Cunha, R.O.; Costa, B.L.S.; Leite, M.N. 2003. Estudo farmacognóstico de galhos de Vanillosmopsis erythropappa Schult. Bip.-Asteraceae. Revista Brasileira de Farmacognosia, 13: 50-55.
Taiz, L.; Zeiger, E. 2004. Fisiologia Vegetal. Artmed, Porto Alegre. 719p. Tania, K.N.; Islam, M.T.; Mahmood, A.; Ibrahim, M.; Chowdhury,
M.M.U.M.; Kuddus, R.; et al. 2013. Pharmacological and phytochemical screenings of ethanol extract of Sterculia villosa
Roxb. Journal of Biomedical and Pharmaceutical Research, 2: 09-14. Verpoorte, R.; Memelink, J. 2002. Engineering secondary metabolite production in plants. Current Opinion in Biotechnology, 13:181–187.
Yao, L.; Caffin, N.; D’arcy, B.; Jiang, Y.; Shi, J.; Singanusong, R.;
et al. 2005. Seasonal variations of phenolic compounds in Australia-grown tea (Camellia sinensis). Journal of Agricultural and food Chemistry, 53: 6477-6483.
Walker, J.C.F. 2006. Basic wood chemistry and cell wall ultrastructure. In: Walker, J.C.F. (Ed.). Primary wood processing: principles and practice. 2ed. Springer Dordrecht, The Netherlands. p.23-67.