MODELING THE SOUTH ATLANTIC OCEAN FROM MEDIUM TO HIGH-RESOLUTION
Mariela Gabioux
1, Vladimir Santos da Costa
1, Jo˜ao Marcos Azevedo Correia de Souza
2,
Bruna Faria de Oliveira
1and Afonso de Moraes Paiva
1ABSTRACT.The standard REMO (a Brazilian approach towards operational oceanography) model configuration is tested, and results of two numerical simulations with HYCOM are presented and discussed. This configuration consists basically of a high-resolution eddy-resolving, 1/12 degree model for the Metarea V (latitudes from 7◦N to 35◦50’S, and longitudes between 20◦W and the Brazilian coast), nested in a medium-resolution eddy-permitting, 1/4 degree model of the Atlantic Ocean.
These simulations aim for: a) creating a basic set-up for implementation of assimilation techniques leading to ocean prediction; b) the development of hydrodynamic bases for environmental studies; and c) providing boundary conditions for regional domains with increased resolution. This is the first time HYCOM is applied in high-resolution and particularly tailored for this region of the ocean. The 1/4 degree simulation was able to simulate realistic Equatorial and South Atlantic large scale circulation, both the wind-driven and the thermohaline components. The high-resolution introduces realistic mesoscale activity, in particular that associated with the dynamics of western boundary currents, and captures also both the continental shelf and the upper-ocean modes of variability associated with atmospheric synoptic forcing. Important issues for the simulation of the South Atlantic with high-resolution are discussed, like the ideal place for boundaries, improvements in the bathymetric representation, and the control of SST bias by the introduction of surface relaxation. In order to make a preliminary assessment of the model behavior when submitted to data assimilation, the Cooper & Haines (1996) method was used to extrapolate SSH anomalies fields to deeper layers every 7 days, with encouraging results.
Keywords: numerical simulation, nesting, southwest Atlantic, Brazil Current.
RESUMO.Neste trabalho s˜ao apresentados e discutidos resultados de duas simulac¸˜oes num´ericas realizadas com o model HYCOM e que representam a configurac¸˜ao padr˜ao do projeto REMO (Rede de Modelagem e Observac¸˜ao Oceanogr´afica), uma abordagem brasileira para a oceanografia operacional. Esta configurac¸˜ao consiste em um modelo em alta resoluc¸˜ao (1/12 de grau, que resolve a mesoescala) da regi˜ao denominada de Metarea V (latitudes de 7◦N a 35◦50’S e longitudes desde
20◦W at´e a costa brasileira), aninhado em um modelo em m´edia-resoluc¸˜ao (1/4 de grau, que resolve apenas parcialmente a mesoescala) do oceano Atlˆantico. Estas
simulac¸˜oes tem como objetivos: a) a gerac¸˜ao de umset-upb´asico para implementac¸˜ao de t´ecnicas de assimilac¸˜ao visando a previs˜ao oceˆanica; b) o desenvolvimento de bases hidrodinˆamicas para estudos ambientais; e c) a gerac¸˜ao de condic¸˜oes de contorno para dom´ınios regionais com maior resoluc¸˜ao. Esta ´e a primeira vez que o HYCOM ´e aplicado em alta resoluc¸˜ao e especialmente configurado para esta regi˜ao do oceano. A simulac¸˜ao em 1/4 de grau simulou de forma realista a circulac¸˜ao de larga escala no Atlˆantico Sul e Equatorial, tanto a componente e´olica quanto a termohalina. A simulac¸˜ao em alta resoluc¸˜ao foi capaz de introduzir tamb´em de forma realista a mesoescala, em particular aquela associada `a dinˆamica das correntes de contorno oeste, e de capturar a variabilidade da porc¸˜ao superior do oceano e da plataforma continental associada `a forc¸ante atmosf´erica em escala sin´otica. Aspectos importantes para a simulac¸˜ao do Atlˆantico Sul em alta resoluc¸˜ao s˜ao discutidos, como o posicionamento dos contornos, a representac¸˜ao da batimetria e o controle de poss´ıveis tendˆencias na TSM pela introduc¸˜ao de um termo de relaxamento para climatologia em superf´ıcie. Uma avaliac¸˜ao preliminar do comportamento do modelo submetido `a assimilac¸˜ao de dados foi realizada com o m´etodo de Cooper & Haines (1996), capaz de extrapolar campos de anomalias de elevac¸˜ao da superf´ıcie para camadas mais profundas a cada 7 dias, com resultados promissores.
Palavras-chave: simulac¸˜ao num´erica, aninhamento, Atlˆantico sudoeste, Corrente do Brasil.
1Programa de Engenharia Oceˆanica – COPPE/UFRJ, Av. Hor´acio Macedo, 2030/ Bloco C/ sala 203, Centro de Tecnologia, Cidade Universit´aria, Ilha do Fund˜ao, Cx. Postal: 68.508, Rio de Janeiro, RJ, Brazil. Phone: +55(21) 2562-8750 – E-mails: [email protected]; [email protected]; [email protected], [email protected]
2Department of Ocenography, School of Ocean and Earth Science and Technology, University of Hawaii – 1000 Pope Road, MSB – 96822 Honolulu, Hawaii, USA. Phone: 1-808-236-0225 E-mail: [email protected]
INTRODUCTION
During the last decade, advances in computer power allowed for the development of numerical modeling studies focused on mesoscale (spatial scales of hundreds of kilometers) and syn-optic (time scales of days to weeks) features for large ocean do-mains. Simulating such scales in the ocean, however, still poses strong challenges particularly in applications related to opera-tional oceanography, in which high degree of realism is expected for the various aspects of the region being simulated. It was within this context that the REMO (Brazilian Network for Ocean Model-ing and Observations) project was proposed (Lima et al., 2013). REMO promotes research leading to the implementation of an operational oceanographic system for the Brazilian waters, based primarily in ocean circulation modeling with data assimilation. This system will support the oil and gas industry, the demands of the Brazilian Navy, and the need for national scientific devel-opment in oceanography. The main region of interest for REMO is the so called Metarea V, from latitudes 7◦N to 35◦50’S, and
longitudes between 20◦W and the Brazilian coast (Fig. 1, area
delimited in blue).
The Metarea V is a domain of great interest for Brazilian oceanographic research, both from scientific and political/eco-nomic perspectives. The ocean circulation within this region is associated with the complex dynamics of western boundary cur-rents in the slope waters, including the Brazil Current – Interme-diate Counter Current (BC-ICC) system, and the North Brazil Cur-rent (NBC), which present intense mesoscale activity with me-andering and eddy/ring formation (Campos et al., 1995, 1996; Stramma & England, 1999; Silveira et al., 2000). These bound-ary currents dominate the dynamics of the main regions of oil and gas exploitation, including the Esp´ırito Santo, Campos and Santos basins (and the newly discovered pre-salt), and also areas of near-future increasing offshore activities. Metarea V is also under Brazilian responsibility before the World Meteorolog-ical Organization (WMO) for bad weather warnings and meteo-rological forecasts.
A first step in the REMO development was the creation of a modeling setup both computational-efficient, and capable of providing high-resolution hydrodynamic and thermohaline fields within the Metarea V domain, with realistic representation of the regional mesoscale activity, and of the synoptic variability. This setup would serve environmental studies, provide initial and boundary conditions for higher resolution regional models and after implementation of data assimilation techniques and opera-tionalization, forecasts of surface and deep ocean currents. The chosen strategy was to apply nesting techniques, beginning with a medium-resolution (1/4 degree) eddy-permitting configuration
for the North, Equatorial and South Atlantic oceans, plus the austral region, which provides boundary conditions for a high-resolution (1/12 degree) eddy-resolving model of the Metarea V domain. Both domains are simulated under synoptic scale at-mospheric forcing using the Hybrid Coordinate Ocean Model – HYCOM (Bleck, 2002). The purpose of the present paper is to present the REMO model configuration, and to discuss the re-sults obtained before implementation of assimilation techniques (for a discussion about the implementation of data assimilation within the scope of REMO see Lima & Tanajura, 2013; Tanajura et al., 2013).
This paper is organized as follows. In Section 2, model char-acteristics and configurations for the different simulations are presented. In Section 3, results regarding the representativity of the circulation pattern and thermohaline structure of southwest-ern South Atlantic Ocean, the Brazil Current transports, and the mesoscale and synoptic variability in the Metarea V region are analyzed. In Section 4 the main results of this study are summa-rized and discussed.
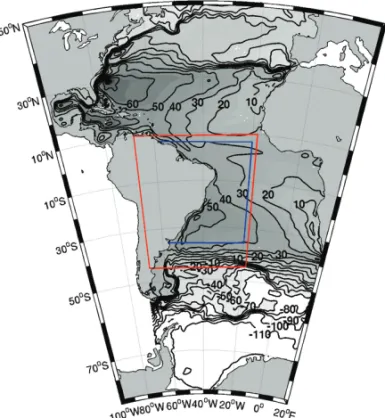
Figure 1 – Model domain for the medium-resolution (1/4 degree) simulation.
The red rectangle highlights the computational domain for the high-resolution (1/12 degree) simulation, and the blue rectangle the Metarea V domain. Contours represent the mean (from 2004 to 2009) sea surface height (SSH), in meters, from the medium-resolution simulation.
METHODOLOGY The HYCOM model
The Hybrid Coordinate Ocean Model – HYCOM (Bleck, 2002) is a generalized-coordinate mass-conserving ocean numerical model
developed from the Miami Isopycnic Coordinate Ocean Model – MICOM (Bleck & Boudra, 1981; Bleck & Smith, 1990; Bleck et al., 1992). Like its predecessor HYCOM uses finite-difference horizontal discretization, but instead of being purely isopycnal it has a generalized vertical coordinate system, based on Bleck & Boudra (1981) and Bleck & Benjamin (1993) studies. This gener-alized coordinate system allows the transition between isopycnal, depth (z or geopotential), and terrain-following sigma coordinates within the model domain. Although HYCOM allows the use of different vertical coordinates, it is still basically an isopycnic layer model in most of the domain, which uses the potential density as vertical coordinate.
The HYCOM ability to change vertical coordinate becomes important in the simulation of some oceanographic processes like water masses distribution and thermohaline circulation (Chas-signet et al., 2003). Because HYCOM combines the best qual-ities of the different types of coordinates, it is considered a tool applicable to any region of the ocean. The model preserves water mass properties for long integration time and provides high vertical resolution in strong current with significant verti-cal shear, which are important characteristics of isopycnal coor-dinates. In regions with little or no stratification, like the mixed layer, HYCOM provides high vertical resolution, a characteristic of depth coordinates, and in coastal areas it allows for high ver-tical resolution, a feature of terrain-following coordinates. Taking these characteristics into account, the standard vertical coordi-nates configuration is the following: isopycnal coordicoordi-nates inside the ocean, which is stratified, making smooth transition to sigma coordinates in shallow regions of the domain (coastal areas) and toz coordinates in the mixed layer and/or in non-stratified regions (Bleck, 2002).
Model configurations
In the REMO basic set-up two model simulations were performed applying nesting techniques: a medium-resolution (1/4 degree) eddy-permitting configuration for the North, Equatorial and South Atlantic oceans (Fig. 1, full domain) and a high-resolution (1/12 degree) eddy-resolving model of the Metarea V (Fig. 1, high-lighted by a red rectangle), nested in the 1/4 degree simulation. Both model simulations were configured in σθ layers, aiming
for improved representation of near surface fields, at the cost of not simulating Antarctic Bottom Water (Chassignet et al., 2003). Vertical discretization has 21 σθ layers, with 18 selected as
hy-brid, 8 of which may become sigma levels. Inclusion of sigma levels improve simulation of the shallow continental shelf region, aiming the future development of higher resolution nested simu-lations in smaller domains inside Metarea V.
The experiment were configured to horizontally advect and diffuse salinity and density, with temperature being diagnosed from the equation of state. Bathymetry for the 1/4 degree experi-ment was interpolated from the “General Bathymetric Chart of the Oceans” GEBCO (Carpine-Lancre et al., 2003), that consists of a global set of digital bathymetric contours at a two minute interval grid (∼3,7 km at Equator). Bathymetry for the 1/12 degree exper-iment was interpolated from Etopo 2 dataset (ETOPO2v2 Global Gridded 2-minute Database, National Geophysical Data Center, National Oceanic and Atmospheric Administration, U.S. Dept. of Commerce, http://www.ngdc.noaa.gov/mgg/global/etopo2.html). We choose Etopo 2 instead of GEBCO (which used in the medium-resolution run) based on a comparative study between both data sets that showed that the Brazilian continental slope bathymetric gradients are better represented (less smoothed) by Etopo 2.
Surface forcing was synoptic atmospheric information from NCEP/NCAR Reanalysis Subset Grid (Kalnay et al., 1996), with 6 hours interval. This information includes wind stress, ther-mal radiation, air temperature and specific humidity, and pre-cipitation. Turbulent surface heat flux and evaporation mass flux are calculated by bulk parameterization with standard constant bulk coefficients. Surface mass flux (evaporation minus precip-itation) is implemented as a virtual salt flux, following a stan-dard procedure in ocean modeling (Bryan & Lewis, 1979, Hol-land & Bryan, 1994). In order to minimize the deviation of the model sea surface temperature (SST) and sea surface salinity (SSS) from observation, which was observed to occur in prelim-inary runs, further relaxation of these fields to the World Ocean Atlas 2001 climatology – WOA01 (Conkright et al., 2002) was included in the surface forcing, following Paiva & Chassignet (2001). The restoring time-scales for SST and SSS were, in the 1/4 degree simulation, 30 days in both cases and in the 1/12 degree simulation 90 and 30 days, respectively. Momentum flux was calculated from the latitudinal and longitudinal com-ponents of wind stress. Rivers discharge were obtained from http://hycom.org/hycom/source-code, and were implemented as an extra precipitation flux distributed in a few grid points near the mouths of the principal rivers.
Vertical mixing parameterization was provided by the semi-implicit KPP “nonlocal K-profile parameterization” closure scheme (Large et al., 1994), widely used in large-scale ocean simulations. The horizontal mixing parameterization was calcu-lated internally by the model, being proportional to the grid size (Smagorinsky, 1963), using a combination of laplacian and biharmonic operators.
The computational domain of the 1/4 degree simulation is the Atlantic Ocean between 50◦N and 78◦S latitudes, and between
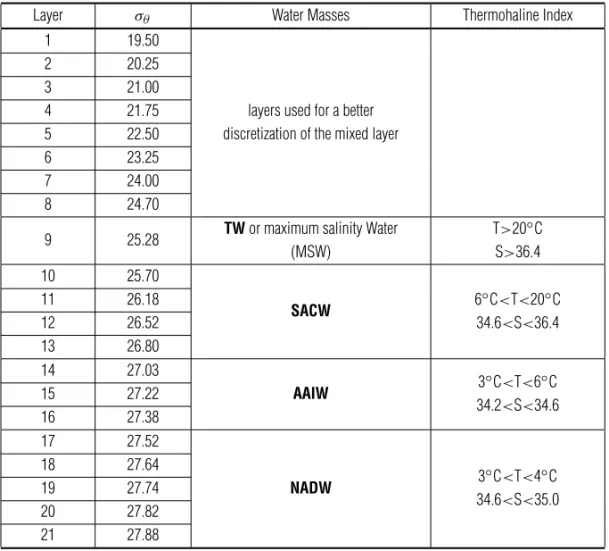
Table 1 – Vertical discretization in σθ layers for both the 1/4 and the 1/12 degree simulations. Column 3 indicates the
water masses that are represented by each model layer (TW – Tropical Water; SACW – South Atlantic Central Water; AAIW – Antarctic Intermediate Water; NADW – North Atlantic Deep Water), and column 4 the thermohaline index for each water mass.
Layer σθ Water Masses Thermohaline Index
1 19.50
2 20.25
3 21.00
4 21.75 layers used for a better
5 22.50 discretization of the mixed layer
6 23.25
7 24.00
8 24.70
9 25.28 TW or maximum salinity Water T>20◦C
(MSW) S>36.4 10 25.70 11 26.18 SACW 6◦C<T<20◦C 12 26.52 34.6<S<36.4 13 26.80 14 27.03 AAIW 3◦C<T<6◦C 15 27.22 34.2<S<34.6 16 27.38 17 27.52 18 27.64 3◦C<T<4◦C 19 27.74 NADW 34.6<S<35.0 20 27.82 21 27.88
98◦W and 21◦E longitudes (Fig. 1). This domain comprises the
South and Equatorial Atlantic and part of North Atlantic Ocean, including the Caribbean sea and Gulf of Mexico. The part of the Pacific Ocean within this longitude range was not considered and the open western boundary was located at 70◦W at the Drake
Passage. The Northern boundary, located in a regional of primar-ily zonal currents, is treated as closed and outfitted with a 3 de-gree wide buffer zone in which temperature and salinity are re-laxed toward monthly values (Bryan & Holland, 1989, Holland & Bryan, 1994) based on the WOA01 climatology. This approach preserves climatological shear through geostrophic adjustment, and has been proven to work particularly well with isopycnal models (Paiva & Chassignet, 2001). Another relaxation zone was included in the Gulf of Cadiz in order to simulated the Mediter-ranean inflow into the Atlantic Ocean (Paiva et al., 2000). In the Drake Passage and South African boundaries barotropic inflows were implemented in addition to temperature and salinity relax-ation to climatology, in order to account for the transports of the
Antarctic Circumpolar Current – ACC (110Sv, following Peterson & Stramma, 1991), and the Agulhas Current (10Sv at the northern part of the boundary, following Gordon, 1985). In the rest of the South African boundary a barotropic outflow of 120Sv (ACC + Agulhas) was implemented.
The model domain for the high-resolution (1/12 degree) nested simulation covers the southwestern South Atlantic plus the Equatorial region, from 10◦N to 45◦S latitudes, and 68◦W
to 18◦W (region delimited by the red rectangle in Fig. 1). This
includes the Metarea V, located between 7◦N and 35◦50’S
lati-tudes, and between longitude 20◦W and the coast (region
delim-ited by the blue rectangle in Fig. 1). Since oceanic open bound-ary conditions represent an ill-posed mathematical problem, we follow the general practice in ocean modeling of making the com-putational domain larger than the domain of interest (in this case the Metarea V). Therefore we place the computational boundaries far away enough from the Metarea V limits, in order to minimized contour-related problems within this region. There is no general
way of defining how far away the two boundary domains should be, since this is a case-specific problem, and one must rely on previous experience.
The 1/4 degree simulation under synoptic atmospheric forc-ing was initialized from the results of a 30-year run with the same model configuration, but under climatological surface forcing. The model was integrated from 2003 to 2009, providing bound-ary conditions for the high-resolution 1/12 degree run, which was integrated for the same time period. Results were stored once every day of simulation, for the entire run, and are analyzed in the following.
RESULTS
The main results are presented in the following, with emphasis on the Metarea V region. Aspects outside this region, including parts of the model domain in both the 1/4 and 1/12 simulations are considered so far as they might impact the nesting approach or the results within the Metarea V.
The spin-up within Metarea V
The 30-year long 1/4 degree simulation under climatological forcing reaches an equilibrium in terms of domain-averaged ki-netic energy in approximately one year (not shown). Domain-averaged temperature and salinity, on the other hand, are not fully equilibrated after three decades, and a small trend remains for both variables. This trend in the 7-year long runs in both the medium and the high-resolution configurations, is ∼0.002 per year for salinity and ∼0.02 per year for temperature for the Metarea V domain (Fig. 2). This behavior is expected in basin scale simulations, in which the model has to adjust to different and not necessarily totally compatible forcing fields derived from dif-ferent data sets. While the model averaged kinetic energy reaches an equilibrium in a relatively short time, through geostrophic adjustment to the initial mass field, the advective time scale for the adjustment of the mass field itself is generally much longer.
The emergence of mesoscale variability with increased reso-lution, associated with an intensification of the mean flows due to the reduction of viscosity coefficients, leads to a considerable increase in the model kinetic energy. This can be observed in the time evolution of mean kinetic energy (averaged over the Meta-rea V domain) presented for both runs in Figure 3 (upper panel). An increase of ∼100% in the mean kinetic energy, going from ∼7,250 J/m2to ∼14,900 J/m2, is observed to occur from the 1/4 to the 1/12 degree simulation. A compartmental study shows that most of this behavior is concentrated in the upper ocean. At the surface (Fig. 3, middle panel), for the total integration
period, the mean kinetic energy grew ∼1100% (from 690 J/m2 to 8500 J/m2), while at 200 meters (Fig. 3, lower panel) it was even higher, reaching ∼1900% (from 130 J/m2to 2600 J/m2). Although this paper is not a model inter-comparison study, it is worth noting how the energy in the REMO configuration compares well with the state of the art global simulation performed by the HYCOM Consortium (Chassignet et al., 2009), available over the Internet and also shown in Figure 3 (middle and lower panels). It is important to take into consideration that the two model con-figurations are different in many aspects, including the data as-similation performed in the global HYCOM, so a perfect match is not to be expected in this comparison.
The mean flow and mass structure
The mean upper-ocean circulation pattern is represented in a re-alistic way, as compared for instance to Peterson & Stramma (1991), in the medium-resolution 1/4 degree simulation. The 7-years mean sea surface height – SSH (Fig. 1) shows a clear sig-nature of the subtropical and tropical wind-driven gyres in both hemispheres, and of the Antarctic Circumpolar Current. In the high-resolution limited area 1/12 degree run, the wind-driven cir-culation is forced both by the wind stress over the model do-main, and by the lateral boundary conditions. The SSH mean pat-tern presented in Figure 4 illustrates how the nesting approach works appropriately for this configuration. The principal current systems in the Metarea V domain are represented, in particular the North Brazil Current – NBC (the western boundary current closing the clockwise equatorial gyre), and the Brazil Current – BC (the western boundary current closing the counterclockwise subtropical gyre), in agreement with the literature. The principal differences between the two runs, within the Metarea V domain, are the intensification of the ocean currents and the appearance of mesoscale features with increased model resolution. One signa-ture of the mesoscale variability in the mean SSH field of Fig-ure 4 is the emergence of three recirculation cells associated with the BC, located at approximately 21◦S and 30’W, 25◦S and
43◦W, and 33◦S and 48◦W. Recirculation cells analogous to the
first two have been described by Vianna & Menezes (2011) and reviewed by Belo (2011), while the southernmost one appears to be a spurious, or at least an over intensified feature of the 1/12 degree model run. Preliminary analysis suggests that it is asso-ciated with the local bathymetry, and further studies are needed in order to understand its dynamics in the model.
The mean thermohaline structure presented in climatological data sets and imposed as initial condition for the 30-year clima-tological simulation is preserved along this run, and also during
Figure 2 – Time series of daily mean temperature (upper panel) and salinity (lower panel), integrated over
the Metarea V domain: thick solid line (1/12 degree simulation), and dashed line (1/4 degree simulation).
Figure 3 – Time series of daily domain-integrated kinetic energy for the Metarea V, considering
three-dimensional velocity fields (upper panel), surface velocities (middle panel), and velocities at 200 m deep (lower panel): black thick solid line (1/12 degree simulation), dashed line (1/4 degree simulation), and gray solid line (results from the 1/12 degree global simulation HYCOM+NCODA).
the medium (1/4 degree) and high (1/12 degree) resolution 7-year long integrations, as illustrated in Figures 5 and 6 for a merid-ional (25◦W) and a zonal (30◦S) salinity section, respectively.
A distinctive feature of the South Atlantic ocean is the tongue of low salinity water representative of AAIW moving equatorward in
sub-pycnocline levels, with a core located at ∼1000 m depth. This intrusion of AAIW is captured by both the medium and the high-resolution simulations. The model mean fields compare well with the WOA01 climatology, also shown in Figure 5, while the
in-stantaneous model field (the 1/12 run in this case) show perhaps less structure than a hydrographical section from WOCE (Fig. 6). There are, however, no significant changes in the mean struc-ture associated with the increase in spatial resolution, or with the nesting approach.
Figure 6 also highlights two deficiencies in this model con-figuration. The first one is a decrease in the salinity of the upper layers, what becomes more evident towards the eastern part of the domain, which needs further investigation for identifying its
causes. The second one, observed below ∼2000 m, is the simu-lation of a North Atlantic Deep Water (NADW) that is slightly more saline than observations, and the absence of a signature from the Antarctic Bottom Water (AABW). This behavior is expected in the present configuration, since the vertical density structure is rep-resented in the model in σθ coordinates, which are optimal for
the upper ocean but deficient in representing the deep ocean.
Figure 4 – Mean (from 2004 to 2009) SSH (in meters) for the high-resolution
1/12 degree simulation.
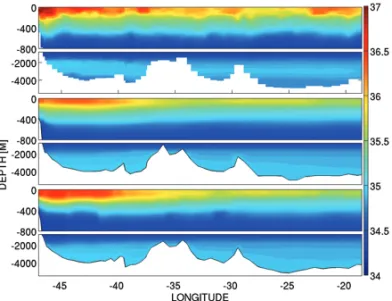
Figure 5 – Mean salinity (from 2004 to 2009) along meridional section at
25◦W: upper panel (WOA01 climatology); middle panel (1/4 degree simulation);
lower panel (1/12 degree simulation). The 34.3 isoline (in white) represents the low salinity core of AAWI.
Figure 6 – Salinity section along 30◦S: upper panel (WOCE cruise line A10 –
Sep/Oct, 2011); lower panel (1/12 degree simulation, snapshot at 10/15/2010).
The Brazil current transport
The BC originates in the model near 15◦S, in accordance with
the literature (Stramma et al., 1990, Peterson & Stramma, 1991), becoming a relatively well defined poleward flow over the slope waters and the shelf break after negotiating its way through the channels of the Vit´oria-Trindade mountain chain. The mesoscale variability associated with meandering and eddy formation with-in the Esp´ırito Santo, Campos and Santos baswith-ins is with-intense, making the definition of the main flow difficult at many instants. Maximum flow velocity in this region varies along the year from approximately 0.1 to 1.0 ms-1, characterizing a strong current in the model simulations. Pick velocities of 1.2 ms-1near 24◦S have been recently reported based on direct field observations (Guerra, 2011), however, suggesting that the BC may, in fact, be stronger than previously thought. Seasonal variability of the current speed and transport are also simulated, with stronger flows during sum-mer, a behavior similar to that observed in other boundary currents (Niiler & Richardson, 1973; Ridgway & Godfrey, 1997; Baringer & Larsen, 2001).
Mean BC transports plus standard deviations, from 2004 to 2009 and along different latitudes within the Esp´ırito Santo, Cam-pos and Santos basins are presented in Figure 7 for the 1/12 degree simulation, and compared to the literature reviewed by Silveira et al. (2000). This comparison is made difficult, regard-ing at one hand the field observations, by the variety of methods employed (direct near-synoptic measurements with different in-struments, and geostrophic calculations with diverse assump-tions on the reference level), and regarding the model simulation at the other hand, by the difficulty in defining the current flow in the daily model outputs, due to the intense mesoscale and also
synoptic (at surface levels) variability. We adopt a practical defini-tion of the current transport as the integral of the negative (south-ward) normal flow across sections perpendicular to the mean surface current, taken at different latitudes. The vertical and lat-eral extension of these sections were defined based on a visual inspection of all velocity plots, in order to capture most of the current variability without including much contamination from peripheral flows and recirculations. Lateral extension goes from the coastline to 125 km beyond the mean current axis, from 15 to 21◦S, and to 135 km from 23 to 29◦S; vertical extension goes
to 500 m from 15 to 21◦S, increasing progressively to 1300 m
at 29◦S in order to take into consideration the deepening of the
BC flow. Overall, and taking into consideration the limitations of these inter-comparisons, there is reasonable agreement between model and observations.
Figure 7 – Simulated BC mean (from 2004 to 2009) transport (in Sv) plus
one standard deviation at several latitudes. The method for computing the model transports is described in the text. The symbols represent transport values de-scribed in the literature (according to the figure labels).
Larger discrepancies occur at 15◦S, in which the model mean
flow is weaker than that suggested by geotrophic calculations per-formed by Stramma et al. (1990), based on historical data. This is however an area of intense eddy activity in which a stable south-ward flow is only an artifact of the averaging procedure and is sel-dom seen in instantaneous plots. From this latitude until 22◦S the
model agrees well with observations, indicating a week BC with a mean flow that does not exceed 4Sv. Different authors (Signorini, 1978; Miranda & Castro, 1981; Evans et al., 1983, Stramma et al., 1990) have computed geostrophic transports from 19 to 22◦S
varying from approximately 2 to 6Sv, what is within the model range considering instantaneous transports. Near 23-25◦S, the
model captures the increase in transport variability presented in
the data, showing larger standard deviation. Geostrophic calcu-lations (Fisher, 1964; Signorini, 1978; Miranda & Castro, 1979; Evans et al., 1983; Stramma, 1989; Campos et al., 1995), and
in situmeasurements (Evans & Signorini, 1985; Garfield, 1990; Souza, 2000) indicate that the current transport varies within the range of 2 to 13Sv, values that are also within the range of the model transports along the 7-year run. The model mean trans-port, and also the variability, increases from 25S to 29S. The model transport of ∼9.7±6.3Sv at 29S compares well with the estimate of 11.4Sv presented by Fisher (1964) for a section lo-cated between 28◦S and 30◦S.
The Mesoscale variability
One of the most important features in western South and Equa-torial Atlantic ocean circulation is the presence of intense meso-scale activity (meandering and eddy/ring formation) associated with the BC (Mascarenhas et al., 1971; Campos et al., 1995; As-sireu et al., 2003), the NBC (Johns et al., 1990; Fratantoni et al., 1995; Schott et al., 1998), and with the Brazil-Malvinas Conflu-ence (Garzoli & Garraffo 1989; Lentini et al., 2002, 2006). In order to represent the spatial distribution of the mesoscale ac-tivity over the Metarea V domain, and as a proxy for identifying regions of intense surface turbulent kinetic energy (TKE), maps of rms computed from sea surface height anomalies (SLA) from the model and from althymetry are compared in Figure 8. The observed SLA (Mapped SLA Delayed Time Updated) 1/3◦spatial
resolution, from 2004 to 2009, is provided by Archiving Valida-tion and InterpretaValida-tion of Satellite Data in Oceanography – AVISO – (Le Traon et al., 1998, 2003; Ducet et al., 2000).
Figure 8 – SLA root mean square (RMS) from 2004 to 2009 (in meters), for
AVISO SLA Delayed Time Updated data (left panel) and the 1/12 degree nested simulation (right panel). No smoothing was performed with the model fields in order to downgrade resolution to that of the AVISO.
Similar to the data, the most energetic regions in the model are located over the western boundary current (both the BC and
the NBC). The area of maximum variability in the southern part of the domain spreads to the east, reflecting the influence of the high mesoscale activity associated with the Brazil-Malvinas Confluence. This important feature of the South Atlantic ocean is reasonably well represented by the 1/12 degree simulation, both in terms of locations and variability, despite the fact that TKE is somewhat constrained by the proximity of the model southern boundary in which velocities from the non-eddy resolving 1/4 degree simulation are imposed. Most of the mesoscale variabil-ity associated with the confluence is generated within the model domain of the high-resolution configuration. This result is, there-fore reassuring regarding the nesting approach in such a complex region. Near the easternmost part of the domain, on the other hand, lower levels of model variability reflect the fact that, in the real ocean a significant part of the mesoscale activity is recircu-lating in the subtropical gyre and reentering the Metarea V do-main, what cannot be represented by the 1/4 degree simulation. This illustrates a drawback inherent to the nesting approach.
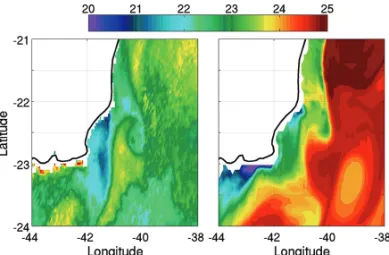
One sub-region within the Metarea V of particular importance is that which includes the Esp´ırito Santo, Campos and Santos basins, and variability seems to be overestimated there (Fig. 8). An inspection of snapshots of surface variables (such as veloci-ties, sea surface height anomalies or temperature), however, in-dicates that the model represents in a quite realistic way the pro-cess associated with eddy formation and shedding which happens preferentially at Cabo de S˜ao Tom´e and Cabo Frio (Lima, 2011; Silveira et al., 2000; Silveira et al., 2008). These phenomena, which is generally clearly seen in SST images, is illustrated in Figure 9 for the model and the data. Both represent the clear SST signature of a well developed eddy at Cape S˜ao Tom´e, and an indication of the formation of a Cabo Frio eddy as well. Note en passant that the image and the model dates in Figure 9 are dif-ferent. Since the process is chaotic and the model has no data assimilation at the moment, it can only be expected to represent realistic features, but not to form these eddies at the same instant they will happen in reality.
The synoptic scale variability
Another mode of variability which is important to be well sim-ulated is the high frequency variability associated with the syn-optic atmospheric forcing. The assessment of the quality of the model response to this forcing is even more relevant in the present configuration since both simulations, in medium and high spatial resolution, have a relaxation term for the climatolog-ical SST (see Model Configuration in the Methodology section).
This relaxation, which has to be strong enough in order to con-trol the surface warm bias observed to occur in free simulations, cannot be so strong as to damp the emergence of synoptic vari-ability in the model surface fields. Most of the model response to the atmospheric forcing will be integrated within the surface mixed layer, and an analysis within Metarea V showed that both the medium and the high-resolution runs represented in a realis-tic way the behavior of the mixed layer thickness, both its mean spatial pattern and its synoptic variability (not shown).
Figure 9 – Sea surface temperature (SST) maps for GOES satellite (Paes et al.,
2005) at 07/29/2006 (left) and the 1/12 degree simulation at 08/20/2006 (right).
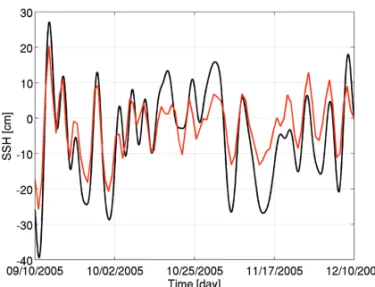
The model synoptic variability is actually not significantly damped, what will be illustrated through the comparison with observed time series of sea level at the coast, and of SST at a PIRATA (“Prediction and Research Moored Array in the Tropical Atlantic” Project buoy http://goosbrasil.org/pirata/). Coastal sea level (Fig. 10), for model and data time series from a station lo-cated at Rio de Janeiro (22◦56’S 43◦08’W) indicated the
pas-sage through the observational point of equatorward moving con-tinental shelf waves, which are very well represented by the model with slightly less energy than in the data. This waves, which are generated by atmospheric synoptic perturbations somewhere in the Argentinean and the Uruguayan shelves, are captured by both the medium and the high-resolution runs. Their dynamics will be the subject of a forthcoming paper. SST variability at the Pirata buoy (located at 19◦S 34◦W e 14◦S 32◦W), which has been
fil-tered to remove periods longer than 30 days, indicate primarily direct atmospheric forcing. This variability, with a range of about 0.4 degrees at this site (much lower than the seasonal cycle which varies approximately by 4 to 5 degrees along the year), is reason-ably well captured by the model with no significant damping, as illustrated in Figure 11. Comparisons with subsurface data (not shown) indicate that the synoptic signal is captured by the model until at least 140 m deep.
Figure 10 – Sea level at the coast from 09/10/2005 to 12/10/2005, at 22◦56’S
43◦08’W filtered to maintain only periods larger than 3 days: black line (data),
and red line (1/12 degree simulation).
Figure 11 – SST at 19◦S and 34◦W, from December 2005 to October 2006,
fil-tered to maintain only periods lower than 30 days: black line (data a Pirata Buoy), and red line (1/12 degree simulation).
SUMMARY AND DISCUSSION
Results of the model configuration of the REMO project, a Brazil-ian approach towards operational oceanography, were presented and discussed in the present paper. This configuration consists basically of a high-resolution eddy-resolving, 1/12 degree model for the Metarea V, nested in a medium-resolution eddy-permitting, 1/4 degree model of the North, Equatorial and South Atlantic. These simulations aim for: a) creating a basic set-up for imple-mentation of assimilation techniques leading to ocean predic-tion; b) the development of hydrodynamic bases (which in the future should include tides) for environmental studies; c) pro-viding boundary conditions for regional domains with increased resolution.
The model was the Hybrid Coordinate Ocean Model – HYCOM, which due to its hybrid vertical coordinate system
pre-serve the conservative properties of isopycnal models, but al-low for improved discretization of upper ocean (mixed layer) and shallow waters. This is an important aspect for REMO whose em-phasis are in simulating surface currents and the interaction be-tween the oceanic circulation associated with the Brazil Current and the continental shelf. HYCOM was configured in σθ
coordi-nates (which is a choice among different possible reference lev-els) in order to keep with the focus on the upper ocean dynamics. The nesting approach was justified since, for instance, 5 years of simulation of the 1/12 degree configuration in the HPC (High Per-formance Computing) cluster maintained at the Federal Univer-sity of Rio de Janeiro take near one month of computer time. One should take into account also that generally several runs were nec-essary in order to test and develop the optimal model configura-tion. This is the first time HYCOM is applied in high-resolution and particularly tailored for the Metarea V, and we expect that this initiative will contribute to the dissemination of this important numerical tool within the Brazilian oceanographic community.
The larger domain, 1/4 degree simulation, was able to simu-late realistic Equatorial and South Atlantic large scale circulation, both the wind-driven and the thermohaline components. The lo-cation of the northern and southern boundaries were chosen so that boundary conditions issues would not interfere directly in the area of interest (the Metarea V). This choice, however, give extra degrees of freedom to the model solution and created extra issues to be dealt with. In the North Atlantic our simplified approach to create a Mediterranean outflow via relaxation at the Gulf of Cadiz was successful, although in very long simulations a more care-ful considerations of the salt input by the Mediterranean would probably be needed in order to maintain salt conservation within the model domain. In the southern ocean, the simplified version of the ice model was only partially successful in creating the sea-sonal cycle of ice formation, and this should be an issue to be faced in further development of this configuration. The west and east boundary conditions, on the other hand, were able to provide a realistic simulation of the Antarctic Circumpolar Current flow.
Mesoscale features are absent or limited in the 1/4 gree run but were generated by the high-resolution 1/12 de-gree run within the Metarea V domain. An important aspect of the nesting approach was to place the boundaries of the 1/12 run far from the boundaries of the Metarea V region, since the boundary conditions supplied by the non-eddy resolving 1/4 de-gree run inhibit the development of mesoscale near the bound-aries. Another important issue in the high-resolution run was the choice of the bathimetry data basis. Etopo2 improved represen-tation on slope regions over GEBCO, which was sufficient for the
medium-resolution run but smoother than etopo2. Further anal-ysis, however, not discussed here, shows that use of ETOPO1 edited for special regions with local data may be necessary for a correct representation of important areas, in particular the Vit´oria-Trindade mountain chain.
An important issue observed in both simulations was a model bias towards increased SST. It is not clear at this point if this is related to atmospheric forcing, to vertical resolution or to some more specific problem with temperature advection. The problem is more intense near the equator. The chosen approach to cope with this problem was to introduce, together with the synoptic atmospheric forcing, a small relaxation of surface temperature towards climatological SST. While keeping model SST from in-creasing too much, this approach did not create any problems to the development of surface synoptic structures. This should not be necessary, however, when data assimilation is implemented in the future.
Data assimilation is the natural next step in the REMO devel-opment. In general data assimilation is applied either to correct model bias or to create initial conditions of chaotic fields allow-ing for ocean forecasts. One should not expect, however, that data assimilation alone can correct all kind of model errors, or impose observed structures that a particular model has difficulties in sim-ulating. The more representative of the real circulation the non-assimilative simulation results are, the better the results obtained after data assimilation. There lies, in part, the importance and the value of all the efforts needed in order to create a configuration that is both computational efficient and realistic from an oceano-graphic point of view.
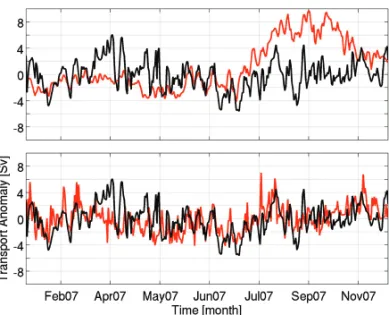
In order to make a preliminary assessment of the model be-havior when submitted to data assimilation, sea surface height anomalies from a global run carried on by the HYCOM Consor-tium were assimilated into this configuration. This is similar to a twin experiment since model-model assimilation is performed, and since we have the global model results to test our model performance. The two runs, however, although performed with the same model have very different configurations in this case. Analysis performed with this global run showed that the results are very realistic for several features of the South Atlantic circu-lation. This approach, however, is partially independent of the quality of the global run and we test primarily the capacity of our simulation to respond to an simple assimilation technique. The Cooper & Haines (1996) method was used to extrapolate the surface fields to deeper layers and SSH anomalies are incorpo-rated in the model every 7 days. The example presented in Fig-ure 12 show how the model converges towards the imposed
“re-ality” of the global run, even for a field not directly assimilated like Brazil Current transport, an indicate that we are progressing in the right direction towards having a model setup appropriated for the development of operational oceanography in Brazil.
Figure 12 – BC transport anomaly for 2007. Upper panel: HYCOM+NCODA
(black line) and 1/12 degree simulation without C&H (red line); lower panel: HY-COM+NCODA (black line) and 1/12 degree simulation with C&H (red line).
ACKNOWLEDGMENTS
The authors wish to thank all the students of GruPO (Grupo de Estudos de Processos Oceˆanicos, from COPPE/UFRJ) for a con-tinuous and stimulating discussion. This research was supported by PETROBRAS and approved by the Brazilian oil regulatory agency ANP (Agˆencia Nacional de Petr´oleo, G´as Natural e Bio-combust´ıveis), within the special participation research project Oceanographic Modeling and Observation Network (REMO).
REFERENCES
ASSIREU AT, STEVENSON MR & STECH JL. 2003. Surface Circulation and Kinetic Energy in the SW Atlantic Obtained by Drifters. Continental Shelf Research, 23(2): 145–157.
BARINGER MON & LARSEN JC. 2001. Sixteen years of Florida Current Transport at 27◦N. Geophysical Research Letters, 28(16): 3179–3182. BELO WC. 2011. A Recirculac¸˜ao Interna do Giro Subtropical do Atlˆantico Sul e a Circulac¸˜ao Oceˆanica na Regi˜ao do P´olo Pr´e-sal da Bacia de San-tos. Ph.D. Thesis – Instituto Oceanogr´afico, Universidade de S˜ao Paulo. 389 pp.
BLECK R. 2002. An Oceanic General Circulation Model Framed in Hybrid Isopycnic – Cartesian Coordinates. Ocean Modelling, 37: 55–88. BLECK R & BENJAMIN S. 1993. Regional Weather Prediction with a Model Combining Terrain-following and Isentropic Coordinates. Part I: model description. Monthly Weather Review, 121: 1770–1785.
BLECK R & BOUDRA DB. 1981. Initial Testing of a Numerical Ocean Circulation Model using a Hybrid (Quasi-Isopycnic) Vertical Coordinate. Journal of Physical Oceanography, 11: 755–769.
BLECK R, ROOTH C & HU D. 1992. Salinity-driven Thermocline Tran-sients in a Wind- and Thermohaline-driven Isopycnic Coordinate Model of the North Atlantic. Journal of Physical Oceanography, 22: 1486–1505. BLECK R & SMITH L. 1990. A Wind-driven Isopycnic Coordinate Model of the North and Equatorial Atlantic Ocean 1. Model development and supporting experiments. Journal of Geophysical Research, 95: 3273– 3285.
BRYAN F & HOLLAND WR. 1989. A high-resolution simulation of the wind and thermohaline-driven circulation in the North Atlantic Ocean. In: Parameterization of Small-Scale Processes. MULLER P & HENDERSON D (Eds.) Proceedings ‘Aha Huliko’a Hawaiian Winter Workshop, U. of Hawaii. 99–116 p.
BRYAN F & LEWIS LJ. 1979. A water mass model of the world ocean. Journal of Geophysical Research, 84, 2503–2517.
CAMPOS EJD, GONC¸ALES JE & IKEDA Y. 1995. Water Mass Character-istics and Geostrophic Circulation in the South Brazil Bight: Summer of 1991. Journal of Geophysical Research, 100(C9): 18537–18550. CAMPOS EJD, IKEDAY & CASTRO BM. 1996. Experiment Studies Cir-culation in the Western South Atlantic. EOS, 77(22): 253–259. CARPINE-LANCRE J, FISHER R, HARPER B, HUNTER P, JONES M, KERR A, LAUGHTON A, RITCHIE S, SCOTT D & WHITMARSH M. 2003. The History of GEBCO 1903-2003: the 100-year story of the General Bathy-metric Chart of the Oceans, Lemmer, Netherlands, GITC bv, 140 pp. CHASSIGNET EP, SMITH LT & HALLIWEL GR. 2003. North Atlantic Sim-ulations with the HYbrid Coordinate Ocean Model (HYCOM): Impact of the vertical coordinate choice, reference pressure, and termobaricity. Journal Physical Oceanography, 33: 2504–2526.
CHASSIGNET EP, HURLBURT HE, METZGER EJ, SMEDSTAD OM, CUM-MINGS J, HALLIWELL GR, BLECK R, BARAILLE R, WALLCRAFT AJ, LOZANO C, TOLMAN HL, SRINIVASAN A, HANKIN S, CORNILLON P, WISBERG R, BARTH A, HE R, WERNER F & WILKIN J. 2009. U.S. GO-DAE: Global Ocean Prediction with the HYbrid Coordinate Ocean Model (HYCOM). Oceanography, 22(2): 64–75.
CONKRIGHT ME, LOCARNINI RA, GARCIA HE, O’BRIEN TD, BOYER TP, STEPHENS C & ANTONOV JI. 2002. World Ocean Atlas 2001: Objective Analyses, Data Statistics, and Figures, CD-ROM. Documentation. Na-tional Oceanographic Data Center. Silver Spring, MD, 17 pp
COOPER M & HAINES K. 1996. Altimetric assimilation with water prop-erty conservation. Journal of Geophysical Research, 101(CI): 1059– 1077.
DUCET N, LE TRAON P & REVERDIN G. 2000. Global high-resolution mapping of ocean circulation from topex/poseidon and ers-1 and -2. Journal of Geophysical Research. 105(19): 477–498.
EVANS, DL & SIGNORINI, SR. 1985. Vertical structure of the Brazil Cur-rent. Nature, 315: 48–50.
EVANS DL, SIGNORINI SR & MIRANDA LB. 1983. A Note on the Trans-port of the Brazil Current. Journal of Physical Oceanography. 13: 1732– 1738.
FISHER A. 1964. The Circulation and Stratification of Brazil Current. M.Sc. Dissertation, New York University. 86 pp.
FRATANTONI DM, JOHNS WE & TOWNSEND TL. 1995. Rings of the North Brazil Current: Their structures and behavior inferred from obser-vations and a numerical simulation. Journal of Geophysical Research, 100(10): 633–654.
GARFIELD III N. 1990. The Brazil Current at Subtropical Latitudes. D.Sc. These, University of Rhode Island. 129 pp.
GARZOLI SL & GARRAFFO ZS. 1989. Transports, frontal motions and eddies at the Brazil-Malvinas Currents Confluence. Deep Sea Research, 36: 681–703.
GORDON AL. 1985. Indian-Atlantic transfer of termocline water at the Agulhas retroflection. Science, 227: 1030–1033.
GUERRA LA. 2011. V´ortices das Agulhas colidem com a Corrente do Brasil? Ph.D. Thesis – Programa de Engenharia Oceˆanica, Universidade Federal do Rio de Janeiro, 88 pp.
HOLLAND WR & BRYAN FO. 1994. Sensitivity studies on the role of the ocean in climate change. Ocean Processes in Climate Dynamics: Global and Mediterranean Examples. MALANOTTE-RIZZOLI P & ROBINSON AR (Eds.), NATO ASI Series, Kluwer Academic Publishers, Dordrecht, 111–134.
JOHNS WE, LEE TN, SCHOTT FA, ZANTOPP RJ & EVANS RH. 1990. The North Brazil Current Retroflection: Seasonal Structure and Eddy Variabil-ity. Journal of Geophysical Research, 95(C12): 22103–22120. KALNAY E, KANAMITSU M, KISTLER R, COLLINS W, DEAVEN D, GANDIN L, IREDELL M, SAHA S, WHITE G, WOOLLEN J, ZHU Y, CHEL-LIAH M, EBISUZAKI W, HIGGINS W, JANOWIAK J, MO KC, ROPELEWSKI C, WANG J, LEETMAA A, REYNOLDS R, JENNE R & JOSEPH D. 1996. The NCEP/NCAR 40-year Reanalysis Project. Bull. Amer. Meteor. Soc., 77: 437–470.
LARGE WG, McWILLIAMS JC & DONEY SC. 1994. Oceanic Vertical Mixing: A review and a model with a nonlocal boundary layer param-eterization. Reviews of Geophysics, 32(2): 363–403.
LENTINI CAD, OLSON DB & PODESTA GP. 2002. Statistics of Brazil Current rings observed from AVHRR: 1993 to 1998. Geophysical Re-search Letters, 29(16), doi: 10.1029/2002/GL015221.
LENTINI CAD, GONI GJ & OLSON DB. 2006. Investigation of Brazil Current rings in the confluence region. Journal of Geophysical Research, vol. 111, C06013, doi: 10.1029/2005JC002988.
LE TRAON, P, NADAL F & DUCET N. 1998. An improved mapping method of multisatellite altimeter data. Journal of Atmospheric and Oceanic Tech-nology, 15: 522–534.
LE TRAON P, FAUG`ERE Y, HERNANDEZ F, DORANDEU J, MERTZ F & ABLAIN M. 2003. Can we merge geosat follow-on with topex/poseidon and ers-2 for an improved description of the ocean circulation? Journal of Atmospheric and Oceanic Technology, 20: 889–895.
LIMA JAM. 1997. Oceanic circulation on the Brazilian shelf break and continental slope at 22◦S. Ph.D. Thesis, University of New South Wales. 164 p.
LIMA JAM, MARTINS RP, TANAJURA CAS, PAIVA AM, CAMPOS E, SOARES ID, CIRANO M, FRANC¸A GB & OBINO RS. 2013. Design and implementation of the oceanographic modeling and observation network (REMO) for physical oceanography studies and ocean forecasting. Re-vista Brasileira de Geof´ısica, 31(2): 209–228.
LIMA NDA. 2011. A estrutura vertical do sistema corrente do Brasil – cor-rente de contorno intermedi´aria ao largo do Cabo de S˜ao Tom´e. Master’s dissertation – Programa de Engenharia Oceanica, Universidade Federal do Rio de Janeiro, 89 pp.
LIMA LN & TANAJURA CAS. 2013. Estudo do impacto da assimilac¸˜ao de dados altim´etricos na previsibilidade de curto-prazo do modelo oceˆanico Hycom sobre a Metarea V do Oceano Atlˆantico. Revista Brasileira de Geof´ısica, 31(2): 271–288.
MASCARENHAS AS Jr. MIRANDA LB & ROCK NJ. 1971. A Study of Oceanographic Conditions in the Region of Cabo Frio. Fertility of the Sea. Gordon and Breach Science Publishers, 1: 285–308.
MIRANDA LB & CASTRO BM. 1979. Condic¸˜oes de Movimento Geos-tr´ofico das ´Aguas Adjacentes a Cabo Frio (RJ). Bol. Inst. Oceanogr., 28(2): 79–93.
MIRANDA LB & CASTRO BM. 1981. Geostrophic Flow Conditions of the Brazil Current at 19◦S. Ciencia Interamericana, 22(1-2): 44–48. NIILER, PP & RICHARDSON WS. 1973. Seasonal variability of the Florida Current. Journal of Marine Research, 31: 144–167.
PAES RCOV, OLIVEIRA AN, FRANCA GB & SARTORI NA. 2005. Com-posic¸˜ao de temperatura da superf´ıcie do mar (tsm) para assimilac¸˜ao em modelos num´ericos de circulac¸˜ao oceˆanica. In: Proceedings XIV Simp´osio Brasileiro de Sensoriamento Remoto, Natal, Brasil, INPE. p. 7031–7038.
PAIVA AM & CHASSIGNET EP. 2001. The Impact of Surface Flux Para-meterizations on the Modeling of the North Atlantic Ocean. Journal of Physical Oceanography, 31: 1860–1879.
PAIVA AM, CHASSIGNET EP & MARIANO A. 2000. Numerical simula-tions of the North Atlantic Subtropical Gyre: Sensitivity to boundary con-ditions. Dynamics of Atmosphere and Oceans, 32: 209–238.
PETERSON RG & STRAMMA L. 1991. Upper-level circulation in the South Atlantic Ocean. Progress in Oceanography, 26: 1–73.
RIDGWAY KR & GODFREY J.S. 1997. Seasonal cycle of the East Australian Current. Journal of Geophysical Research, 102(C10): 22921– 22936.
SCHOTT FA, FISCHER J & STRAMMA L. 1998. A Transports and Path-ways of the Upper-Layer Circulation in the Western Tropical Atlantic, Journal of Physical Oceanography, 28: 1904–1928.
SIGNORINI SR. 1978. On the Circulation and the Volume Transport of the Brazil Current between The Cape of S˜ao Tom´e and Guanabara Bay. Deep Sea Research. 25: 481–490.
SILVEIRA ICA, SCHMIDT AK & CAMPOS EJD. 2000. A Corrente do Brasil ao Largo da Costa Leste Brasileira. Brazilian Journal of Oceanog-raphy, 48(2): 171–183.
SILVEIRA ICA, LIMA JAM, SCHMIDT ACK, CECCOPIERI W, SARTORI A, FRANCISCO CPF & FONTES RFC. 2008. Is the meander growth in the Brazil current system off Southeast Brazil due to baroclinic instability? Dynamics of Atmospheres and Oceans, 45(3-4): 187–207.
SMAGORINSKY JS. 1963. General circulation experiments with the primitive equations. I: The basic experiments. Monthly Weather Review, 91: 99–164.
SOUZA MCA. 2000. A Corrente do Brasil ao Largo de Santos: Medic¸˜oes Diretas. Master dissertation. Universidade de S˜ao Paulo. 169 pp. STRAMMA L. 1989. The Brazil Current Transport South of 23◦S. Deep Sea Research, 36: 639–646.
STRAMMA L & ENGLAND M. 1999. On the Water Masses and Mean Cir-culation of the South Atlantic Ocean. Journal of Geophysical Research, 104(C9): 20863–20883.
STRAMMA L, IKEDA Y & PETERSON RG. 1990. Geostrophic Transport in the Brazil Current Region North of 20◦S. Deep Sea Research Part A. Oceanographic Research Papers, 37(12): 1875–1886.
TANAJURA CAS, COSTA FB, SILVA RRD, RUGGIERO GA & CORREIO VBD. 2013. Assimilation of Sea Surface Height Anomalies into Hycom with an Optimal Interpolation Scheme Over the Atlantic Ocean Metarea V. Revista Brasileira de Geof´ısica, 31(2): 257–270.
VIANNA ML & MENEZES VV. 2011. Double-celled subtropical gyre in the South Atlantic Ocean: Means, trends, and interannual changes. Journal of Geophysical Research, 116(C3).
Recebido em 16 abril, 2012 / Aceito em 23 julho, 2013 Received on April 16, 2012 / Accepted on July 23, 2013
NOTES ABOUT THE AUTHORS
Mariela Gabioux. Graduated in Water Engineering from the National University of Litoral, Argentina (1999). M.Sc. in Civil Engineering and D.Sc. in Ocean Engineering,
from COPPE – Universidade Federal do Rio de Janeiro, Brasil, in 2002 and 2008, respectively. Currently is a researcher at Programa de Engenharia Oceˆanica of COPPE. Currently research interests include numerical modeling, with focus in hydrodynamics and ocean circulation.
Vladimir Santos da Costa. Graduated in Physics from the Universidade Federal Rural do Rio de Janeiro (2005), and M.Sc. in Ocean Engineering from the Federal
University of Rio de Janeiro – UFRJ (2008). Currently is a doctoral student at Program of Ocean Engineering of COPPE/UFRJ, developing studies on air-sea interaction, mesoscale variability in the ocean, and data assimilation in ocean models.
Jo˜ao Marcos Azevedo Correia de Souza. Graduated in Oceanography at the Universidade do Estado do Rio de Janeiro (1999), M.Sc. in Energy Planning (2003)
and Ph.D. in Ocean Engineering (2008), from COPPE – Universidade Federal do Rio de Janeiro. Currently is a post-doctoral fellow at the School of Ocean and Earth Sciences and Technology - University of Hawaii, working with the operational ocean forecast system for the US Pacific Islands using IS4DVar data assimilation. Currently research interests are also the hole of oceanic mesoscale processes in the ocean climate and interconnections between the ocean and the atmosphere.
Bruna Faria de Oliveira. Graduated in Oceanography from the Universidade do Estado do Rio de Janeiro (2010). Currently a M.Sc. student at Programa de Engenharia
Oceˆanica of COPPE/UFRJ. Currently research interests are: numerical modeling of large and mesoscales in the ocean, and dynamics of Agulhas rings.
Afonso de Moraes Paiva. Graduated in Oceanography by the Universidade do Estado do Rio de Janeiro (1985), M.Sc. Ocean Engineering from COPPE – Universidade
Federal do Rio de Janeiro (1992), and Ph.D. in Physical Oceanography by the Rosenstiel School of Marine and Atmospheric Sciences of the University of Miami (1999). Currently is a Professor at the Program of Ocean Engineering of COPPE/UFRJ. Main research interests are: geophysical fluid dynamics, thermodynamic processes in the oceans and ocean-atmosphere interaction, meso and large scale ocean circulation, climate variability, and numerical modeling of ocean circulation.