Adv. Sci. Res., 12, 69–72, 2015 www.adv-sci-res.net/12/69/2015/ doi:10.5194/asr-12-69-2015
© Author(s) 2015. CC Attribution 3.0 License.
14th
EMS
Ann
ual
Meeting
&
10th
European
Conf
erence
on
Applied
Climatology
(ECA
C)
Evaluation of WRF model seasonal forecasts for tropical
region of Singapore
J. Singh1, K. Yeo2, X. Liu1, R. Hosseini1, and J. R. Kalagnanam1,2
1IBM Research Singapore, 9 Changi Business Park Central 1, The IBM Place, 468048, Singapore 2IBM Thomas J. Watson Research Center, 1101 Kitchawan Rd, Yorktown Heights, New York, NY 10598, USA
Correspondence to:J. Singh (jsingh@sg.ibm.com)
Received: 15 January 2015 – Revised: 2 April 2015 – Accepted: 9 April 2015 – Published: 27 April 2015
Abstract. The Weather and Research Forecast (WRF) model is evaluated for the monsoon and inter-monsoon seasons over the tropical region of Singapore. The model configuration, physical parameterizations and perfor-mance results are described in this paper. In addition to the ready-to-use data available with the WRF model, the model configuration includes high resolution MODIS land use (500 m horizontal resolution) and JPL-NASA sea surface temperature (1 km horizontal resolution) data. The model evaluation is performed against near sur-face observations for temperature, relative humidity, wind speed and direction, available from a dense network of weather monitoring stations across Singapore. It is found that the high resolution data sets bring significant improvement in the model forecasts. The results also indicate that the model forecasts are more accurate in the monsoon seasons compared to the inter-monsoon seasons.
1 Introduction
The high resolution meteorological outputs from a numeri-cal weather prediction (NWP) model provide valuable inputs to derive a variety of air quality models and other urban ap-plications. In this context, we are customizing the commu-nity based WRF-ARW model for Singapore. Undoubtedly, a thorough evaluation of the model forecasts is an important exercise for better understanding of the performance of such models and applications.
The WRF model is a community based mesoscale NWP model supported and maintained by NCAR (Skamarock et al., 2008). The WRF model is in principle suitable for a broad spectrum of applications across scales ranging from meters to thousands of kilometers. The model consists of advanced numerical and data-assimilation techniques, multi-ple domain nesting capability, and numerous state-of-the-art physical parameterization schemes.
In this study, we investigate the performance of the WRF model over Singapore region during the monsoon and inter-monsoon seasons. The usage of WRF model for a tropical city appears to be few, cf. Li et al. (2013) and He et al. (2013) for studies related to Singapore. Singapore is
situ-ated at the southern tip of the Malay peninsula with surface area of 700 km2and has a population of 6 million. There are two monsoon seasons: North-East (December–March) and South-West (June–September) monsoon each separated by a two months inter-monsoon period. The weather of Singapore is impacted by the coastal breezes and due to small and short lived convective processes that are frequent in tropics. Due to availability of the observations from a dense observation network, Singapore represents a suitable geography for per-formance evaluation of the WRF model.
In the following sections we describe the model configu-ration and performance results from our current WRF mod-eling framework.
2 Model configuration
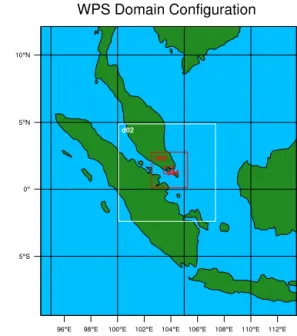
The WRF-ARW model version 3.5 is used in this study (Ska-marock et al., 2008). The model is configured with four two-way nested domains of 27-9-3-1 km horizontal resolution, shown in Fig. 1. The innermost domain encompasses Sin-gapore and surrounding areas of Malaysia and Indonesia. A total number of 43 vertical sigma layers are used, with first 15 layers below 1 km to better resolve the boundary layer.
70 J. Singh et al.: Evaluation of WRF model seasonal forecasts
Table 1.Comparison of simulated temperatures using 500 m and 1 km MODIS land use data against the observations. Observed mean temperature is 28.58◦C.
NObs.=343 Mean MB MGE RMSE HR
MODIS 1 km 27.41 −1.16 1.34 1.75 0.76 MODIS 500 m 27.57 −1.00 1.16 1.56 0.81
Table 2.Same as Table 1 but for relative humidity. Observed mean relative humidity is 75.98 %.
NObs.=335 Mean MB MGE RMSE HR
MODIS 1 km 85.19 9.20 10.58 12.62 0.33 MODIS 500 m 82.70 6.71 8.64 10.73 0.45
In improvement efforts the 500-m resolution land use data from MODIS (UMD scheme) for all the domains is ingested in the model. The dominant land use categories in this data are shown in Fig. 2. This data consists of fewer categories in comparison to the 1 km MODIS data, but have an updated representation of the urban category. This is useful as Singa-pore has seen a rapid urbanization and land reclaimation in the past few decades. Other static data sets used are SRTM 90 m terrain height, vegetation data from MODIS and variety of data included in the WRF model.
The initial and boundary conditions are derived from the NCEP’s Global Forecast System (GFS) data with 0.5◦×0.5◦
spatial and 3 h temporal resolution, respectively. Soil mois-ture and temperamois-ture are also initialized from the same GFS data. The sea surface temperature is initialized from JPL-NASA with spatial resolution of 1 km. No data-assimilation is carried out for the results presented in this paper.
The physical parameterization schemes selected for all the experiments are as follows: New Thompson scheme for mi-crophysics, MM5 similarity for surface layer physics, Noah LSM for surface physics, Kain-Fritsch cumulus scheme in the first three domains, New Goddard scheme for long and short radiation and Yonsei University scheme for PBL.
3 Model evaluation
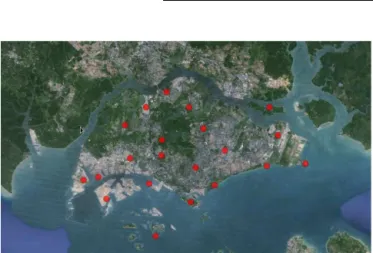
The WRF model performance is evaluated against near sur-face observations for temperature, relative humidity and wind field (both speed and direction). These observations are available from a dense network of monitoring stations across Singapore operated by the National Environment Agency Singapore, see Fig. 3 for layout of the stations. The observa-tion data are available at 1 minute temporal resoluobserva-tion for all the fields. Whereas, the model gridded output frequency is 30 minutes. Thus, the observations are averaged over one hour for evaluation purpose. Moreover, we select the nearest grid point to the station’s location for a point-wise comparison.
Figure 1.Nested computational domains for the WRF model set-up. d04 encompasses Singapore and surrounding areas of Malaysia and Indonesia.
Figure 2.Dominant land use categories in the MODIS 500 m res-olution data. The left and right figures correspond to the innermost (d01) and outermost (d04) computational domain, respectively.
For temperature and humidity the WRF simulated outputs at 2 m height are used and the wind components are compared with the model output at 10 m height.
The statistical measures considered are mean bias (MB), mean gross error (MGE), root mean square error (RMSE) and hit rate. The hit rate is defined as:
Hit Rate (HR)= 1
N N X
i=1 ni,
ni = (
1, if |Oi−Mi| ≤A
0, if |Oi−Mi|> A
(1)
whereN is number of observations,Oi andMi are the
ob-served and model output values, respectively. The parame-terA corresponds to the desired accuracy. In this studyA
J. Singh et al.: Evaluation of WRF model seasonal forecasts 71
Table 3.Same as Table 1 but for wind speed (ms−1) and direction (◦).
Speed (ms−1) Direction (◦)
NObs.=375 MB MGE RMSE MB MGE RMSE
MODIS 1 km 0.64 1.03 1.34 −8.07 46.71 63.96 MODIS 500 m 0.41 0.91 1.19 −4.37 47.27 64.25
Table 4.Comparison between the hourly average observed and simulated temperatures for a period of one week in each monsoon and inter-monsoon seasons.
Period NObs. Mean (Obs.) Mean MB MGE RMSE HR
NE 2005 27.35 26.76 −0.58 0.82 1.06 0.94
IM 2059 28.40 28.42 0.01 1.33 1.67 0.76
SW 3035 28.15 28.41 0.25 1.13 1.48 0.83
Figure 3.Weather monitoring station operated by the National En-vironment Agency of Singapore.
Figure 4.Time series plot of the hourly observed and model simu-lated temperatures at the Changi meteorological station during 21– 27 February 2014.
is set to 2◦C for temperature and 7 % for relative humidity.
The negative/positive bias in wind direction implies that the model produced wind direction is anti-clockwise/clockwise with respect to the observed wind direction.
3.1 Impact of high resolution land use data
First, we evaluate the impact of ingesting high resolution land use data in the model. For this purpose we perform two simulations, one with MODIS 500 m data and second using
Figure 5.Same as Fig. 4 but for relative humidity.
Figure 6.Same as Fig. 4 but for wind speed.
MODIS 1 km data (1 km land use data is readily available with the WRF model). In both simulations the model is inte-grated for 36 h started at 12:00 UTC, 14 April 2014. The first 12 h of the simulations were discarded as the model spin-up time.
The results are summarized in Table 1 for temperature, in Table 2 for relative humidity and in Table 3 for wind field. As expected, the use of high resolution land use data results in a significant accuracy improvement.
3.2 Evaluation for monsoon and inter-monsoon seasons
To have a better understanding of the model performance, we evaluate the model results for different seasons prevail-ing in the region. A period of continuous seven days is cho-sen in each of the North-East (21–27 February 2014), the South-West (7–13 July 2014) and the Inter-Monsoon (21– 27 April 2014) seasons. The observation data are available from 21 stations during the South-West monsoon period and
72 J. Singh et al.: Evaluation of WRF model seasonal forecasts
Table 5.Same as Table 4 but for relative humidity.
Period NObs. Mean (Obs.) Mean MB MGE RMSE HR
NE 2005 68.80 76.10 7.33 8.40 10.32 0.46
IM 2059 79.95 82.47 2.51 8.27 10.52 0.51
SW 3032 80.25 80.97 0.71 8.59 10.84 0.48
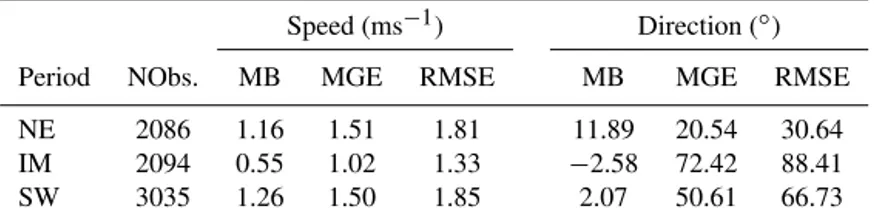
Table 6.Same as Table 4 but for wind speed and direction.
Speed (ms−1) Direction (◦)
Period NObs. MB MGE RMSE MB MGE RMSE
NE 2086 1.16 1.51 1.81 11.89 20.54 30.64
IM 2094 0.55 1.02 1.33 −2.58 72.42 88.41
SW 3035 1.26 1.50 1.85 2.07 50.61 66.73
from 16 stations during the North-East and Inter-Monsoon periods. For each day 36 h simulation starting at 12:00 UTC is performed and first 12 h are considered as spin-up time. The model set-up and configurations are same as described in Sect. 2.
The results for temperature for the periods mentioned above are summarized in Table 4. It can be noticed that tem-perature is under (over) predicted in NE (SW) monsoon. The performance in IM period is less accurate than that of the monsoon periods.
The evaluation results for surface humidity for the three chosen periods are summarized in Table 5. The model over-estimates relative humidity for all periods. However, the ac-curacy is slightly better in the IM period than in the monsoon periods.
The evaluation results for surface wind and direction are summarized in Table 6. The most accurate results for wind are for NE monsoon season. This is because the wind in NE monsoon season is predominant in NE direction. In IM pe-riod the wind is slow but it is highly variable. This is also reflected in the model results. The wind direction in the IM period is less accurate compared to the monsoon periods.
The time series of the observations at the Changi airport station and the model simulated fields are plotted in Figs. 4, 5 and 6 for NE monsoon period. It can be observed that the WRF model is able to capture the diurnal variability.
4 Conclusions
In the present study, the WRF model is evaluated over the tropical region of Singapore. The model accuracy is signifi-cantly enhanced (approximately by 10 %) by the high resolu-tion land use and sea surface temperature data. The over all performance of the model is evaluated for the monsoon and inter-monsoon seasons prevailing in the region. In each sea-son the evaluation is performed for a period of one week. The results suggest that the WRF model with our current
configuration and parameterizations performs better for the monsoon seasons. This can be attributed to the fact that the weather patterns are more dominant in the monsoon seasons in comparison to the inter-monsoon periods. Furthermore, our model performance is comparable to the results reported in the literature for other geographies. For inter-monsoon season, the model performs reasonably well for temperature and relative humidity. However, the wind direction, due to high variability in inter-monsoon season, has significant ab-solute errors though its biases are small. It can be mentioned that wind direction is an important input for simulating the pollutant dispersion phenomena in an urban area. The results presented in this paper would hopefully serve as an indica-tion or benchmark for WRF studies in other tropical regions. The current model configuration is operated in an opera-tional setting to generate 24 h forecast to derive the air qual-ity models. An advanced Urban Canopy Model is planned for the future.
References
He, S., Raghavan, S. V., Nguyen, N. S., and Liong, S.-Y.: En-semble rainfall forecasting with numerical weather prediction and radar-based nowcasting models, Hydrol. Process., 27, 1560– 1571, 2013.
Li, X.-X., Koh, T.-Y., Entekhabi, D., Roth, M., Panda, J., and Nor-ford, L. K.: A multi-resolution ensemble 125 study of a tropical urban environment and its interactions with the background re-gional atmosphere, J. Geophys. Res.-Atmos., 118, 9804–9818, 2013.
Skamarock, W., Klemp, J., Dudhia, J., Gill, D., Barker, D., Duda, M., Huang, X., Wang, W., and Powers, J.: A Description of the Advanced Research WRF Version 3 (2008) NCAR Technical Note, Boulder, CO, 2008.