Abstract— This article discusses the benefit cost analysis aspects of millimetre wavebands (mmWaves) and Super High Frequency (SHF). The devaluation along the distance of the carrier-to-noise-plus-interference ratio with the coverage distance is assessed by considering two different path loss models, the two-slope urban micro Line-of-Sight (UMiLoS) for the SHF band (from the ITU-R 2135 Report) and the modified Friis propagation model, for frequencies above 24 GHz. The equivalent supported throughput is estimated at the 5.62, 28, 38, 60 and 73 GHz frequency bands and the influence of carrier-to-noise-plus-interference ratio in the radio and network optimization process is explored. Mostly owing to the lessening caused by the behaviour of the two-slope propagation model for SHF band, the supported throughput at this band is higher than at the millimetre wavebands only for the longest cell lengths. The benefit cost analysis of these pico-cellular networks was analysed for regular pico-cellular topologies, by considering unlicensed spectrum. For shortest distances we can distinguish an optimal of the revenue in percentage terms for values of the cell length, R ≈ 10 m for the millimitre wavebands and for longest distances an optimal of the revenue can be observed at R ≈ 550 m for the 5.62 GHz. It is possible to observe that, for the 5.62 GHz band, the profit is slightly inferior than for millimetre wavebands, for the shortest Rs, and starts to increase for cell lengths approximately equal to the ratio between the break-point distance and the co-channel reuse factor, achieving a maximum for values of R approximately equal to 550 m.
Keywords—5G, Millimetre Wavebands, SHF band, SINR, Cost Benefit Analysis.
I. INTRODUCTION
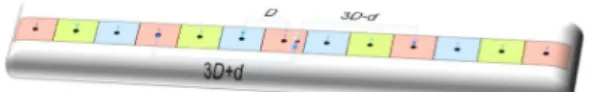
ELLULAR planning can be optimized by studying the system’s performance in relation to its fundamental parameters. This work compares the carrier-to-noise-plus-interference (SINR or CNIR) and the supported throughput for millimetre wavebands (mmWaves) and Super High Frequency band (SHF) within the framework of 5G New Radio (NR) mobile networks while considering the linear and Manhattan grid topologies as in [1], as shown in Figure 1, where reuse pattern K = 3 is assumed.
In this work, aiming at evaluating the proposed deployments, two propagation models are considered, namely the two-slope propagation model, for the SHF band [2], and the modified Friis propagation, at mmWaves.
1,2,3,4 Instituto das Telecomunicações and DEM, Universidade da Beira Interior,
Faculdade de Engenharia, 6201-001 Covilhã, Portugal, (e-mail: [email protected] 1, [email protected] 4).
Fig. 1. Linear topology with cigar-shaped cells (downlink), and reuse pattern 3. The general description of 5G NR was given by Rel. 15 of the Third Generation Partnership Project (3GPP) and allows for the deployment of a complete commercial network with a service based architecture employing the concept of modularity [3], with the elements of the architecture, called network functions (NFs), offering their services via a common framework that will allow communications with speeds up to 2 Gbps, in both downlink and uplink directions.
Rel. 15 has also established two sets of frequencies identified as frequency range 1 (FR1) and frequency range 2 (FR2). FR1 comprises the sub-6GHz frequency range (450-6000 MHz) while FR2 is the mmWaves (24250-52600 MHz). In this work, one considers carrier frequencies in both ranges, and a bandwidth of 100 MHz that allows for a total of 270 physical resource blocks (PRBs) with 60 kHz sub-carrier spacing. Besides, in order to map the minimum CNIR, CNIRmin, into the
supported throughput, Rb, we have considered the values for
CNIRmin from 3GPP [4].
After obtaining the results for the system capacity of small cells, we study the benefit cost analysis aspects. It is possible to classify the system’s cost into two parts, i.e., capital costs and operating costs. The first category considers fixed expenses such as spectrum auctions (where costs are null for unlicensed spectrum) and the number of Base Stations (BS) and transceivers per unit of area, while the second class considers the expenses to operate and maintain the system. Revenues depend on the price per MB and on the supported throughput. The remainder of the paper is organized as follows. Section II starts by presenting a general description non-standalone 5G NR. Section III describes the path loss models for millimetre wavebands and SHF band. In Section IV, the CNIR is analysed. Section V addresses system capacity by studying the variation of CNIR and supported throughput with the cell length. In Section VI, the capacity/cost trade-off is addressed. Finally, conclusions are drawn in Section VII.
5 Dept. of Electrical and Computer Engineering, Dept. of Engineering & Public
Policy, Carnegie Mellon, University, Pittsburgh, PA 15213-3890, USA, (e-mail: [email protected])
Emanuel Teixeira
1, Anderson Ramos
2, Marisa Lourenço
3, Fernando J. Velez
4, Jon M. Peha
5Cost Benefit Analysis: Evaluation Among the
Millimetre Wavebands and SHF Bands of Small Cell
5G Networks
II. 5GNEWRADIO
5G is expected to operate in backward compatibility with LTE/LTE-A in the non-standalone phase, with the cells of both technologies offering different or the same coverage. Within 5G NR deployment scenarios, among other topologies, it is possible to have a LTE/LTE-A eNB (evolved NodeB) as a master node, offering an anchor carrier that can be boosted by a NR gNB (Next-generation NodeB), with data flow aggregated by the evolved packet core (EPC) [5].
The physical layer operation of NR is based on Orthogonal Frequency Division Multiplex (OFDM) with cyclic prefix (CP) for both downlink and uplink directions. Uplink communication also supports Discrete Fourier Transform-spread-OFDM (DFT-s-OFDM) and both channels are designed to be bandwidth agnostics [6], with their capacity being determined by the number of allocated Physical Resource Blocks (PRBs), which is a function of the operating bandwidth and the sub-carrier spacing (SCS). As defined by 3GPP Rel. 15, the sub-frames of NR are composed of slots that comprise 14 OFDM symbols, with lengths of 1 ms and 15 kHz subcarrier spacing.
III. PROPAGATION MODELS
To define the behaviour associated to the path loss in Line-of-Sight (LoS), the ITU-R proposes to consider the two-slope propagation model that accounts for two-path fading, which occurs over longer distance, to optimize small cells in urban micro Line-of-Sight (UMiLoS) environments. S. Min and H. L. Bertoni identified that, as a result of the two-slope
behaviour, smaller out-of-cell interference is obtained with the two-slope model, leading to, according to [7], system designs with different optima than are obtained using the single slope model.
The UMiLoS two-slope model is specified in the frequency range from 2 GHz to 6 GHz, as follows, as in [8]:
PL UMi LoS = 22·log10(d[m])+28.0+20 log10(fc[Hz]), d< dBP (1)
PL UMi LoS = 40·log10(d[m])+7.8–18 log10(h'BS)–
18·log10(h'UT)+2 log10(fc[Hz]),d> dBP
(2)
where hBS = 10 m and street width 20 m, and the average building
height 20 m, while h’BS [m] = hBS -1 and h’UT [m] = hUT -1. The break
point distance dBP is determined by:
dBP = 4·h’BS·h’UT·fc/c (3)
where fc is the centre frequency, in hertz, c = 3.0 x 10⁸ m/s is
the propagation velocity in free space. Consequently, dBP_UMi_LoS is 351 m at 5.62 GHz.
The path loss for the millimetre wavebands is defined by the following equation [1], [8], [9], [10]:
𝑃𝐿𝐿𝑜𝑆 [𝑑𝐵 ] (𝑑) = 20log10 4𝜋
𝜆 + 10 ∙ 𝑛 ∙ log10 (𝑑) + 𝑋𝜎, 𝑑 ≥ 1 m (4)
where X is the typical log-normal random variable with 0
dB mean and standard deviation , in decibels (i.e., in reality it is a zero-mean Gaussian distributed variable), that models shadow fading. In the mmWaves, dBP is of the order of
kilometres, and is not considered for small cells.
IV. CARRIER-TO-NOISE-PLUS-INTERFERENCERATIO To understand how the service quality degrades while the user roams from the cell centre to the cell edge it is extremely important to analyse the variation of CNIR in the downlink (DL) as well as throughout the cell for different frequency bands. The implicit formulation from [10] maps the CNIR into the values of the PHY throughput, Rb, at the corresponding
MCS. Figure 2 presents the variation of CNIR with the distance, d (0 ≤ d ≤ R), for R = 400 m. Table I shows the parameters considered in the computations. At the mmWaves, the shadow fading lognormal distribution with the zero mean and the standard deviation, [dB], is 0.004 at 28 GHz and 4.4 for the 38,
60 and 73 GHz bands (N.B. the latter two go beyond FR2). The propagation exponent for the mmWaves is γ = 2.1 for the 28 GHz frequency band and γ = 2.3 for the 38, 60 and 73 GHz bands.
TABLE I. PARAMETERS CONSIDERED IN THE ANALYSIS (FROM [3].)
Band mmWaves SHF
Transmitter Power (DL) -16.9897 dBW -0.3047 dBW
Transmitter gain 5 dBi 5 dBi
Receiver gain 0 dBi 0 dBi
Bandwidth 100 MHz
Noise Figure 7 dB
Height (Base Station) 9 m Height (User Equipment) 1.5 m
Fig. 2. Variation of the CNIR with the distance d for the 5.62, 28, 38, 60 and 73 GHz frequency bands for R = 400 m.
Fig. 3. Variation of the CNIR with the distance d for the 5.62, 28, 38, 60 and 73 GHz frequency bands for R = 40 m.
In the SHF band, the UMiLoS two slope model establishes that the propagation exponent is γ = 2.2 for Rs shorter than dBP, while for Rs longer than dBP the propagation exponent is γ
= 4.
For R = 400 m, the 5.62 GHz band achieves higher CNIR, followed by the 28, 38, 73 and 60 GHz frequency bands. The 60 GHz frequency band shows worst cellular coverage owing to the O2 absorption excess. For R = 40 m, Figure 3 shows that
the SHF band performance is the worst while at 60 GHz the performance is excellent due to the reduction of interference (O2 absorption).
V. SUPPORTEDTHROUGHPUTANDSYSTEM CAPACITY
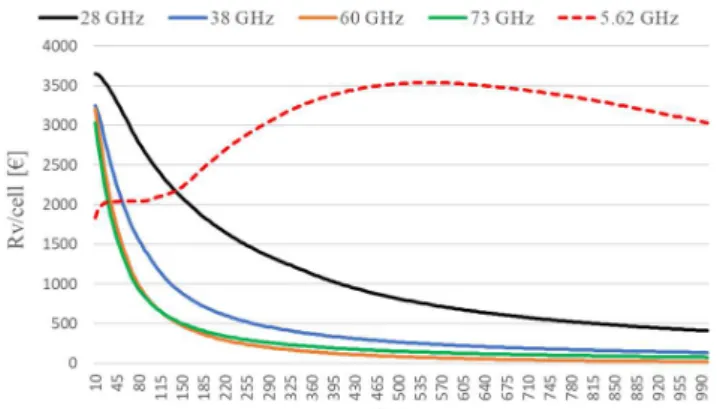
Figure 4 represents the curves for the supported throughput as a function of the coverage distance (not d), as in [1], [10], obtained for the 5.62 GHz frequency band and for 28, 38, 60 and 73 GHz mmWaves bands, where R varies up to 1000 m.
Fig. 4. Variation of the supported throughput for 5.62, 28, 38, 60 and 73 GHz frequency bands and Rmax=1000 m.
It is observed that the supported throughput is higher for the 28, 38, 60 and 73 GHz frequency band compared to the 5.62 GHz frequency band for distances up to approximately 140, 75, 50, 45 m respectively.
VI. ECONOMICTRADE-OFF
To analyse the cost/revenue trade-off, the models from [11], [12] have been considered. The revenues per cell, (Rv)cell[€], can
be achieved as a function of the throughput per Base Station, BS, thrBS[kbps], and the revenue of a channel with a data rate
Rb[kbps], Rrb[€/MB], and Tbh corresponding the equivalent duration
of busy hours per day [11], Rv cell[€] can be obtained by:
(𝑅 ) [€]=
𝑡ℎ𝑟 [ ]∙ 𝑇 ∙ 𝑅 [€/ ]
𝑅 [ ]
(5)
Revenues are considered in annual basis, where we considered six busy hours per day (saturation conditions), 240 busy days per year [10], and the price of a 144 kbps “channel” per minute (corresponding to the price of ≈ 1 MB), considering R144 kbps[€/min] =0.005, approximately 5 € per 1 GB. The revenue
per cell can be obtained by:
(𝑅 ) [€]=
𝑡ℎ𝑟 [ ]∙ 60 ∙ 6 ∙ 240 ∙ 𝑅 [€/ ]
144[ ]
(6)
Figure 5presents results for the revenue per cell per year, with Rb=144 kbps, through variation of R for Rmax = 1000 m. It
is clear that 28 GHz band shows the highest revenue per cell of all frequency band for short distances, while the 5.62 GHz frequency band shows higher revenues for long distances, above R = 150 m. At mmWaves revenue decrease as the distance increases for all frequency bands.
Fig. 5. Revenue per cell with Rb=144 kbps, 10 ≤ R ≤ 1000 m.
The overall cost of the network per unit length, per year, C0[€/ul], can be expressed by:
𝐶[€/ ]= 𝐶 [€/ ]+𝐶 ⋅ 𝑁/ (7)
here Cfi is a fixed term cost, which we consider fix null costs.
Cfb is a cost proportional to the number of BSs, and the number
of cells per unit length is given by:
𝑁/ = 1 2. 𝑅[ ]− 𝑤[ ] 2 (9)
It is worthwhile to note that the building block dimensions change with R, since the side length is (2R-w), producing a variation in the streets area, what does not occur [1]. Nevertheless, the linearized curves of costs and profits of the network, are not influenced, since only the street length is considered, instead of the area [11], [12].
We have considered the prices for the BSs operating at 60 and 73 GHz 20% higher than the prices for the ones at 28 GHz and 38 GHz, and 28/38 GHz 20% higher than the prices for the ones at 5.62 GHz due to, e.g., Si-Ge combined with CMOS (SG13C from IHP) technology can be applied for 28 GHz and 38 GHz [13], and will be cheaper.
The revenue per unit area per year, Rv, is obtained
multiplying the revenue per cell by the number of cells per unit length, as follows:
𝑅 [€/ ] = . [ ] [ ] . [ ]. . [€/ ] [ ] (11) Cfb is given by: 𝐶 [€]= 𝐶 + 𝐶 + 𝐶 𝑁 + 𝐶 & (12)
Cfbcan be obtained by the assumptions present in Table II, for
five-year project duration.
Figure 6 shows the global cost per unit length per year, C0,
and the revenue per unit length per year, considering all the parameters from Table II, and the respective price per minute considered in all calculations.
The revenues are higher than costs for 5.62, 28, and 38 GHz bands, differently from the 60 and 73 GHz bands (for the studied distances), where for the longest distances the cost becomes higher than revenue. One observes higher revenues per unit length for the mmWave bands (28 and 38 GHz) for short distances (up to 140 m in average) and higher revenues per unit length for the 5.62 GHz band for the longest distances. The profit, Pft, is a metric that needs to be optimized to
enhance the network efficiency, and is given by the difference between revenues and costs, in €/km, while the profit in percentage is given by the net revenue normalized by the cost:
𝑃 [€/ ]= ((𝑅 )[€/ ]− 𝐶[€/ ])/𝐶[€/ ] (13)
TABLE I. ASSUMPTIONS FOR BASE STATION COSTS FROM [12] TABLE
TYPE STYLES Parameters Values [€] mmWaves Values [€] SHF Initial costs: BS price, CBS Installation, CInst Backhaul, CBh 3000 /6000 200 2000 2500 200 2000 Annual Cost: Fixed, Cfi
Op. and maint., CM&O
0 250
Fig. 6. Network revenue/cost per unit length per year as a function of R, with Rmax = 1000 m.
Figure 7 shows the profit in percentage, instead of the absolute profit, because this is more relevant metric for operators and service providers [12]. If Rv[€/km]-C0[€/km] is
positive, there will be positive profit.
For the studied distances, only 5.62 frequency band is entirely profitable, whereas for 28, 38, 60 and 73 GHz
frequency bands, for distances longer than 300, 90, 33, 28 meters, respectively, the system becomes unprofitable (negative profit).
At 28 GHz, for distances up to 45 m, the profit is higher than 150%. For the 60 and 73 GHz frequency bands, the average profit is similar, while for distances longer than 115 m, the profit for the 73 GHz band is higher due to the highest system capacity (as the extra O2 absorption additionally affects
coverage at the 60 GHz frequency band), even though 60 and 73 GHz show less profit due to higher base station costs. For 5.62 GHz band, the 5G system is going to sustain its profitability for longer distances.
Fig. 7. Profit per unit length per year, Rmax = 1000 m.
The results are a key point for operators and service providers to enhance their incomes whilst improving the system for coverage distances up to 45 m for mmWaves, and longer than 150 m for 5.62 GHz frequency bands, aiming at increasing the profit in percentage.
VII. CONCLUSION
In this work, we compare the benefit cost analysis aspects between the millimetre wavebands and SHF band for mobile 5G New Radio cellular networks. 5G technical specifications are considered to perform the mapping between carrier-to-noise-plus-interference and modulation code schemes to obtain the supported throughput for both bands.
By considering reuse pattern K=3 and a linear topology as in [14], results for the SHF band show that the supported throughput increases for the longest distances, while for the millimetre wave bands, the supported throughput decreases for the longest radii, up to the maximum considered value of 1000 m, with the highest values being obtained at the 28 GHz frequency band. The 60 GHz frequency band only performs better than the 73 GHz band for Rs up to approximately 115 m, mainly due to the O2 absorption excess. Regarding to the
economic trade-off, for the mmWaves, the 5G network shows a decreasing behaviour of the profit along the distance. At the 5.62 GHz frequency band, the profit is very low for the shortest Rs, and starts to increase at a distance equal to the ratio between the break-point distance and the co-channel reuse factor, achieving maxima for R equal to circa 550 m.
Computations show that, in the future, it is possible to install these types of structure when costs of installation and maintenance of the network decreases, enabling higher system
capacity while reducing prices.
ACKNOWLEDGMENT
This work is funded by FCT/MCTES through national funds and when applicable co-funded EU funds under the project UIDB/EEA/50008/2020, COST CA 15104 IRACON, ORCIP and CONQUEST (CMU/ECE/0030/2017), TeamUp5G project has received funding from the European Union’s Horizon 2020 research and innovation programme under the Marie Skłodowska-Curie project number 813391.
REFERENCES
[1] E. Teixeira and F. J. Velez, "Cost/Revenue Trade-Off of Small Cell Networks in the Millimetre Wavebands," in Proc. of IEEE 87th Vehicular
Technology Conference: VTC2018-Spring 2018, Porto, Portugal, 3-6 June 2018.
[2] H. Xia, H. L. Bertoni, L. R. Maciel, A. Lindsay-Stewart and R. Rowe, “Radio propagation characteristics for line-of-sight microcellular and personal communications,” IEEE Transactions on Antennas and Propagation, vol. 41, no. 10, pp. 1439-1447, Oct. 1993.
[3] 3GPP, “3GPP TR 21.915, ”technical specification group services and system aspects; release 15 description; summary of Rel-15 work items (release15)”,
https://portal.3gpp.org/desktopmodules/Specifications/SpecificationDeta ils.aspx?specificationId=3389,accessed:2019-03-11.
[4] 3GPP, TS 36.212, V11.3.0. Technical Specification Group Radio Access Network; Evolved Universal Terrestrial Radio Access (E-UTRA); Multiplexing and channel coding, 3GPP Std., June 2013.
[5] C.-P. Li, J. Jiang, W. Chen, T. Jee and J. Smee, “5G ultra-reliable and low-latency systems design,” in Proc. of 2017 European Conference on Networks and Communications (EuCNC), June 2017, pp. 1–5.
[6] 3GPP, “5G; NR; Physical layer; General description (3GPP TS 38.201 version 15.0.0 Release 15)”. Available online: https://portal.3gpp.org/desktopmodules/Specifications/SpecificationDeta ils.aspx?specificationId=3211, acessed: 2019-25-04.
[7] S. Min and H. L. Bertoni, “Effect of path loss model on CDMA system design for highway microcells,” in Proc. of IEEE 48th IEEE Vehicular
Technology Conference, VTC' 98, Pathway to Global Wireless Revolution, Ottawa, Ontario, Canada, 1998, pp. 1009-1013, vol.2. [8] T.S. Rappaport, S. Sun, R. Mayzus, H. Zhao, Y. Azar, K. Wang, G. N.
Wong, J. K. Schulz, M. Samimi and F. Gutierrez, “Millimeter Wave Mobile Communications for 5G Cellular: It Will Work!” IEEE Access, vol. 1. no., pp. 335-349, 2013.
[9] M. K. Samimi, T. S. Rappaport, and G. R. MacCartney, “Probabilistic omnidirectional path loss models for millimeter-wave outdoor communications,” IEEE Wireless Communications Letters, vol. 4, no. 4, Aug. 2015, pp. 357-360.
[10] R. Prasad and F. J. Velez, WiMAX Networks: Techno-economic Vision and Challenges, Springer, Dordrecht, The Netherlands, 2010.
[11] F. J. Velez, L. M. Correia and J. M. Brázio, “Frequency Reuse and System Capacity in Mobile Broadband Systems: Comparison between the 40 and 60 GHz Bands,” Wireless Personal Communications, vol.19, no. 1, Aug. 2001, pp.1-24.
[12] F. J. Velez, O. Cabral, F. Merca and V. Vasiliou, “Service characterization for cost/benefit optimization of enhanced UMTS,” Telecommunication Systems,” Springer, vol. 50, no. 1, Apr. 2012, pp. 31-45.
[13] SENZA CONSULTING, “Report The economics of small cells and Wi-Fi offload”. (2019, April). [Online]. Available: https://docplayer.net/9842331-Report-the-economics-of-small-cells-and- wi-fi-offload-the-economics-of-small-cells-and-wi-fi-offload-by-monica-paolini-senza-consulting.html.
[14] E. Teixeira, F. J. Velez and J. M. Peha, "Economic Trade-off of Small Cell Networks: Comparison between the Millimetre Wavebands and UHF/SHF
![TABLE I. PARAMETERS CONSIDERED IN THE ANALYSIS ( FROM [3].)](https://thumb-eu.123doks.com/thumbv2/123dok_br/18140957.871074/2.892.467.809.434.926/table-i-parameters-considered-analysis.webp)
![TABLE I. A SSUMPTIONS FOR BASE STATION COSTS FROM [12] T ABLE T YPE S TYLES Parameters Values [€] mmWaves Values [€] SHF Initial costs: BS price, C BS Installation, C Inst Backhaul, C Bh 3000 /6000 200 2000 2500 200 2000 Annual Cos](https://thumb-eu.123doks.com/thumbv2/123dok_br/18140957.871074/4.892.76.421.579.965/ssumptions-station-parameters-values-mmwaves-initial-installation-backhaul.webp)