Repositório ISCTE-IUL
Deposited in Repositório ISCTE-IUL:
2019-03-26
Deposited version:
Pre-print
Peer-review status of attached file:
Unreviewed
Citation for published item:
Costa, C. J., Ferreira, E., Fernando Bento & Aparicio, M. (2016). Enterprise resource planning
adoption and satisfaction determinants. Computers in Human Behavior. 63, 659 - 671
Further information on publisher's website:
10.1016/j.chb.2016.05.090
Publisher's copyright statement:
This is the peer reviewed version of the following article: Costa, C. J., Ferreira, E., Fernando Bento &
Aparicio, M. (2016). Enterprise resource planning adoption and satisfaction determinants. Computers
in Human Behavior. 63, 659 - 671, which has been published in final form at
https://dx.doi.org/10.1016/j.chb.2016.05.090. This article may be used for non-commercial purposes
in accordance with the Publisher's Terms and Conditions for self-archiving.
Use policy
Creative Commons CC BY 4.0
The full-text may be used and/or reproduced, and given to third parties in any format or medium, without prior permission or charge, for personal research or study, educational, or not-for-profit purposes provided that:
• a full bibliographic reference is made to the original source • a link is made to the metadata record in the Repository • the full-text is not changed in any way
The full-text must not be sold in any format or medium without the formal permission of the copyright holders. Serviços de Informação e Documentação, Instituto Universitário de Lisboa (ISCTE-IUL)
Av. das Forças Armadas, Edifício II, 1649-026 Lisboa Portugal Phone: +(351) 217 903 024 | e-mail: [email protected]
UNCORRECTED
PROOF
A R T I C L E I N F O
Article history: Received 6 January 2016
Received in revised form 29 May 2016 Accepted 31 May 2016
Available online xxx Keywords:
Enterprise resource planning ERP
Adoption User satisfaction
A B S T R A C T
Enterprise Resource Planning (ERP) systems are at the core of every firm. Making people use this costly and time-con-suming investment is one of the most important issues to deal with. The main objective of the present study is to find the key determinants that open the door to user satisfaction and adoption. A theoretical model was set and an online sur-vey was conducted to understand ERP users' perspective on such matters. The outcome was the model validation and the understanding that top management support, training, and the system quality are important constructs to assess adoption and user satisfaction. In fact, the latter (system quality) has a significant influence on the behavioural intention to use and also in the overall user satisfaction. As management support is a very relevant determinant to ERP usage. Accordingly, this study enlightens theory, by contributing to a new model of ERP adoption and satisfaction. It also provides relevant evidence to companies involved in the ERP implementation process.
© 2016 Published by Elsevier Ltd. Computers in Human Behavior xxx (2016) xxx-xxx
Contents lists available at ScienceDirect
Computers in Human Behavior
journal homepage: www.elsevier.com
Full length article
Enterprise resource planning adoption and satisfaction determinants
Carlos J. Costa,
aEdgar Ferreira,
aFernando Bento,
aManuela Aparicio
a, b, c, ∗aInstituto Universitario de Lisboa (ISCTE-IUL) ISTAR-IUL, Portugal bNOVA IMS, Universidade Nova de Lisboa, Portugal
cUnidcom/IADE, Portugal
1. Introduction
In an increasingly competitive globalized market, the key to or-ganization's success is the ability to maintain and increase that com-petitive advantage (Porter, 1991).
In this new paradigm, organisations cannot compete on their own. Success can only be achieved through cooperation with other organ-isations like truly integrated and flexible supply chains (Lambert & Cooper, 2000).
Enterprise Resource Planning (ERP) is a natural evolution of the 80's manufacturing resource planning (MRP II), inheriting all the con-cepts and theories that date back to the 60's with first attempts to ra-tionalise lead times and possession stock costs. ERP rapidly became the standard enhancing operational efficiency with the integration of business processes throughout all organization (Akkermans, Bogerd, Yücesan, & van Wassenhove, 2003; Davenport, 1998).
In the past decades, ERP systems' usage numbers have increased tremendously, and the worldwide ERP market summed 22.4 billion euros by 2013. The competition is fierce, and the top five companies represent half of the market (SAP: 24%; Oracle: 12%; Sage: 6%; In-for: 6%, and Microsoft: 5%) (Pang, Dharmasthira, Eschinger, Brant, & Motoyoshi, 2014).
After first failures of enterprise resource planning (ERP) systems in mid-1990's, the IS research community became intrigued by the factors in such “productivity paradox” (Brynjolfsson, 1993). Making
∗
∗Corresponding author. Instituto Universitario de Lisboa (ISCTE-IUL) ISTAR-IUL,
Portugal.
Email addresses: [email protected] (C.J. Costa); [email protected] (E. Ferreira); [email protected] (F. Bento); [email protected] (M. Aparicio)
people adopt a new system was no easy process but is vital to the suc-cess of every organization (Basoglu, Daim, & Kerimoglu, 2007).
Various studies were developed to understand the main drivers that led users to adopt a certain ERP system (e.g., Bradley, 2008; Chien & Tsaur, 2007; Gorla, Somers, & Wong, 2010; Nwankpa & Roumani, 2014; Nwankpa, 2015; Pan & Jang, 2008; Rajan & Baral, 2015; Sternad & Bobek, 2013; Tsai, Lee, Shen, & Lin, 2012; Youngberg, Olsen, & Hauser, 2009). Although the conclusions were very signif-icant, reviewed studies are usually centred on a specific model or framework and fail to explain the relations between ERP user's adop-tion and user's satisfacadop-tion.
Hence, through the review of scoped literature in the area, the state of the art about ERP Adoption and satisfaction is assessed. Founded on this review, a model proposal is built to have a structural body for validation. A survey is conducted to gather data, which is used as a base for model validation by the quantitative statistical method of PLS-SEM.
The research contributions are threefold. Firstly, this study ex-plains the relationship between ERP adoption at an individual level and user satisfaction. Secondly, this research extends the ERP adop-tion model with the inclusion of three constructs: management sup-port, training, and system quality. Thirdly this model explains 70% of ERP usage satisfaction.
2. Literature review
2.1. Enterprise resource planning (ERP)
Enterprise resource planning (ERP) systems are defined as “com-prehensive, packaged software solutions that seek to integrate the complete range of a business's processes and functions in order to
http://dx.doi.org/10.1016/j.chb.2016.05.090 0747-5632/© 2016 Published by Elsevier Ltd.
UNCORRECTED
PROOF
present a holistic view of the business from a single information and IT architecture”(Klaus, Rosemann, & Gable, 2000, p. 141).
These systems assume a modular structure and provide informa-tion integrainforma-tion across every business area using a shared database (Davenport, 1998). ERPs started in the mid-1990´s and were used to outline and organize business processes across all the organizational groups. This integrative approach guaranteed that tasks and processes were always performed in the same way in every place the organiza-tion is (McAfee, 2009).
Traditionally oriented for capital-intensive industries ERP systems achieved a maturity state of development. Tough in recent years, ERPs are being introduced to other sectors, such as retail, education, finance, insurance, healthcare and hotel chains (Shehab, Sharp, Supramaniam, & Spedding, 2004).
ERP is a multidisciplinary, and interdisciplinary field of study and the research community contribution is diverse and comprehensive (Moon, 2007). A study by (Esteves & Bohórquez, 2007) showed that the most investigated area is the implementation phase, in which suc-cess is by far the main topic. Although system usage and evolution are also addressed, other fields of study such as adoption still need more contributions.
The term ERP was coined in 1993 by the Gartner Group based in Stamford, CT. The company started to publish regular reports on the ERP technology where the inclusion criterion was the integration ex-tent across the various functional modules (Jacobs & Weston, 2007).
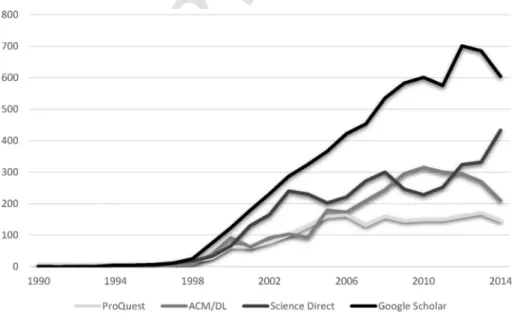
Subsequently, research in ERP increased over the past years. To acquire a general idea of the evolution of published literature about ERP, main academic databases were scanned for the term “Enterprise
Resource Planning” in the period 1990–2015. Fig. 1 summarizes the
results of ERP bibliometric research (due to figures discrepancy, and to have an easier reading from the graphic, a factor of 0,1 was applied to Google Scholar search results).
These results reveal the growing interest in ERP over the past 25 years. The first relevant increase in the number of published work about ERP was in the year of 1997 with four times more hits than the previous year. Since then, the amount of work on ERP research has increased exponentially over the first decade of the 21st century with a considerable leap of 74% in 2000 (related to 1999) and an explicit growth of 346% at the end of the first decade (2009) when compared with 2000. Consistent with this growth, the numbers also show that
ERP still is a prominent field in the research community, with about 6200 search results on average in the 2009–2014 period (Google, 2015).
2.2. Recent ERP empirical studies
As seen before, ERP research is vast and disperse. After a closer look at published literature, it is clear that the main focus has been the implementation phase success and system's technical aspects, neglect-ing themes like ERP system adoption (Esteves & Bohórquez, 2007; Moon, 2007; Pairat & Jungthirapanich, 2005; Shehab et al., 2004). This paradigm seems quite confusing when research indicates that software selection and preparation is the critical part of the implemen-tation project (Shaul & Tauber, 2013). Therefore, stakeholder's adop-tion in ERP systems implementaadop-tion can give a clearer insight on how to approach this early stages problematic (Hwang, 2005).
First, ERP adoption is mainly studied using several models and extensions mainly based on the contribution of psychology's The-ory of Planned Behaviour (TRA) (Fishbein & Ajzen, 1975) in IS technologies research (Wu & Chen, 2005). Although there are vari-ous models that explain user's adoption, the Technology Acceptance Model (TAM) (Davis, 1986, 1989) is the most referenced in\ this area of research (Basoglu et al., 2007; Lee, Kozar, & Larsen, 2003; Venkatesh & Bala, 2008; Venkatesh, Thong, & Xu, 2012). Secondly, researchers working on ERP system's success in most cases apply the DeLone & McLean (D&M) IS success model (DeLone, 1988) as the main tool to evaluate the system's implementation success (Mardiana, Tjakraatmadja, & Aprianingsih, 2015). In this case, success is under-stood as net benefits for the individual and the organization, where user satisfaction and use are the main success drivers (Delone & McLean, 2003). Finally, other findings of the critical factors were taken into consideration to uncover the main determinants of ERP suc-cess and adoption (Al-Mashari, Al-Mudimigh, & Zairi, 2003; Larsen, 2003). Accordingly, a set of papers about ERP adoption, success, and the main influencing dimensions were selected, each from a different publication to have a wider perspective on the matter (Table 1).
As seen before, investigators often tend to use the Technology Acceptance Model when studying ERP system's adoption. This
UNCORRECTED
PROOF
Table 1
Recent studies on ERP.
Author Journal Study purpose Method/Model
(Youngberg et al., 2009) International Journal of Information Management
Analyse the perceptions of selected ERP aspects on perceived usefulness and intention to use. 2 TAM adoption model extensions (Sternad & Bobek, 2013) Procedia Technology
Identify external factor that influence the ERP adoption among companies in maturity phase of the system use.
TAM adoption model adaptation (Rajan & Baral, 2015) IIMB Management Review
Determine the CSFs that influence ERP adoption.
TAM model and individual impact (Pan & Jang,
2008)
Journal Of Computer Information Systems
Examine the TOE factors that affect ERP adoption in the communication's industry. TOE adoption framework (Chien & Tsaur, 2007) Computers in Industry
Assess ERP system's success at three high-tech firms.
Revised D&M IS Success model (Gorla et al., 2010) The Journal of Strategic Information Systems
Understand the impact of three quality dimensions (information, system, and service) on enterprise systems
D&M success model. Organization impact of selected dimensions (Tsai et al., 2012) Information & Management
Understand how ERP selection criteria are linked with system and service quality influencing ERP system success.
Balanced Scorecard (SERVQUAL & D&M IS success model) (J. Nwankpa & Roumani, 2014) Computers in Human Behavior
Understand how the concept of Organizational Learning Capability (OLC) influences ERP use.
OLC/D&M success model adaptation (no net benefits were studied) (Bradley, 2008) International Journal of Accounting Information Systems
Determine how ten management based critical success factors impact in ERP system's implementation success.
Multiple case study and related organizational impact.
model for IS adoption was considered to have a good fit explaining user's adoption of IS and being a robust method for study's support (Rajan & Baral, 2015; Sternad & Bobek, 2013; Vathanophas & Stuart, 2009; Youngberg et al., 2009). Also, another approach by Pan & Jang (2008) was considered to assess the role of Technology, Organization, and Environment (TOE) in ERP adoption.
Consistent with Rajan and Baral (2015) findings, Pan & Jang's (2008) TOE study found a strong influence of top management sup-port in ERP user's adoption behaviour. Strong evidence shows that having the commitment of top management encourages the effective ERP usage and increases the perception of usefulness by the end users (Bradley, 2008; J.; Nwankpa & Roumani, 2014).
Another important aspect is system quality. Prior studies (Chien & Tsaur, 2007; Gorla et al., 2010; Rajan & Baral, 2015; Sternad & Bobek, 2013; Tsai et al., 2012) found a strong explanatory capability of system quality dimension on both ERP adoption and success. For example, Tsai et al. (2012) find that system quality has the strongest impact on user satisfaction of all studied factors. Likewise, other re-viewed researchers discovered that system quality often is among the most significant influences on behavioural intention and user's satis-faction (Chien & Tsaur, 2007; Tsai et al., 2012).
Although this dimension could not directly explain the organiza-tional impact, Gorla et al. (2010) found that it is explanatory nature is more related to the indirect effect through user's perception of how easy/difficult it is to use the ERP system. So, regardless the study ob-jective (adoption or success), this construct is found to be one of the main influencers of user's behaviour intention and perception of the
ease of use (Chien & Tsaur, 2007; Rajan & Baral, 2015; Sternad & Bobek, 2013; Tsai et al., 2012).
Both Youngberg et al. (2009) and Rajan and Baral (2015) refer the significant role that training has on ERP system's usage, underlining the critical need to educate users in system skills and communication. Training is a determinant factor for ERP system's success. Bradley (2008), in his study on how management CSFs influence ERPs system success, found that all successful projects showed that training had a higher quality. Also, an earlier study by Amoako-Gyampah and Salam (2004), showed that training had a significant effect applied to adop-tion models, either directly on perceived ease of use or indirectly on perceived usefulness through the benefits of ERP system's shared be-liefs.
According to the reviewed literature, adoption studies revealed a deeper understanding of user's IS adoption in the ERP field. Fur-thermore, when compared with the large amount of published work about ERP systems the contributions regarding ERP adoption are very scarce. Also, Wixom & Todd (2005) show that having the user satis-faction perspective in the assessment of ERP's usage helps to under-stand the direct consequence of adoption of user's perceptions.
Consequently, adoption models and user satisfaction will be ad-dressed bellow in more detail.
2.3. Adoption models
As seen above, one of the most used model to study ERP adop-tion is the Technology Acceptance Model. This model is based on the principles of the Theory of Reasoned Action to explain and pre-dict the behaviours of organization's individuals in a specific situation. According to Fishbein and Ajzen (1975), TRA identifies two major factors that explain behavioural intentions: “Attitude” and “Subjective
Norms.” This first factor is a consequence of a person's salient
be-liefs and the perceived outcome evaluation. The second-factor influ-encing behavioural intention is explained by the individual normative beliefs and the motivation to comply (Vallerand, Deshaies, Cuerrier, & Pelletier, 1992). This attitude theory from psychology (TRA) was later on successfully adapted to information systems (IS) by Davis. According to Davis (1989), many variables can explain the adoption of information technology, but previous research identified two im-portant constructs: perceived usefulness (PU) and perceived ease of use (PEOU). Therefore, in the particular case of IS, the system de-sign features (external variables) indirectly influence the attitude to-ward using the system through the direct impact on PU and PEOU.
Another theoretical model used to explain the adoption is the the-ory of planned behaviour (TPB) introduced by (Ajzen, 1991). Ajzen postulated that attitude could not totally explain one's behaviour. Therefore, based on TRA, Ajzen showed that the subjective norms (social factor) and the perceived behavioural control also had an im-portant role explaining adoption.
Even though, both TAM and TPB are solid models to assess indi-vidual's intention to use an information system, Davis' adoption model proven to be a more useful model for empirical research (Mathieson, 1991).
Due to the parsimonious nature of the Technology Acceptance Model, Venkatesh, and Davis (2000) introduced a complete model. The so-called Technology Acceptance Model 2 provides a detailed insight on how both social influence and cognitive instrumental processes influence usage intentions (up to 60%) (Venkatesh & Davis, 2000). Taking the previous model into consideration (TAM2), Venkatesh and Bala (2008) suggested an enhanced new model: TAM3. Having a more comprehensive approach, a new set of con-structs were introduced and related to PEOU (anchor and adjust
UNCORRECTED
PROOF
ment). Also, new hypotheses were considered such as the moderation effect of experience on key relationships (Venkatesh & Bala, 2008).
In an effort to integrate the most prominent eight theories (TRA; TAM/TAM2; MM; TPB/DTPB; C-TAM-TPB; MPCU; IDT; SCT) on the IS acceptance field, Venkatesh, Morris, Davis, & Davis (2003) presented a Unified Theory of Acceptance and Use of Technology (UTAUT). UTAUT postulates that there are three direct determinants of behavioural intention (performance expectancy, effort expectancy, and social influence) and two of the usage behaviour (behavioural in-tention and facilitating conditions). Also strong moderating influences were found and integrated into UTAUT model (experience, voluntari-ness, gender, and age) (Venkatesh et al., 2003). It is also important to mention that this extension was introduced to UTAUT in a consumer study context. UTAUT2 incorporates three new constructs specifically oriented to understand the consumer acceptance and use of technolo-gies: hedonic motivation, price value, and habit.
All in all, the literature review showed that Technology Accep-tance Model is the most suitable model to study adoption in IS. There-fore, numerous IS investigators apply this method to ERP research. Future research directions suggest that this model will continue to be the reference model although adjusted with particular extensions ac-cording to the technology specificity in the analysis (Mardiana et al., 2015; ,Chen et al., 2011).
2.4. User satisfaction
Another course of IS research is the investigation of user satisfac-tion. The DeLone & McLean (D&M) model for IS success is the most cited model to assess on how system's usage affects user's satisfac-tion (Lowry, Karuga, & Richardson, 2007). D&M IS Success model assumes that system and information quality indirectly affect individ-ual and organizational impact through the reciprocally independent dimensions of use and user satisfaction (DeLone & McLean, 1992). An update to the original model took place ten years after by the same authors and showed a new external construct: “Service
Qual-ity”. The authors felt the need to underline the importance of “In-tention to Use” and “Use” aspects inside the former model's “Use”
construct, creating new visible relations for research. Finally, indi-vidual and organizational impact were merged into “Net Benefits” to
have a better perspective of the final success variable (Delone & McLean, 2003). This multidimensional and interdependent model has proven to be solid when explaining various constructs, including user's satisfaction (Mardiana et al., 2015; Petter, DeLone, & McLean, 2008). Interestingly, although net benefits are directly explained by use and user satisfaction, this last construct is found to be the main driver of these same net benefits in various empirical applications of this model. Wixom & Todd (2005) found that both acceptance and user satisfac-tion theories should be considered when researching user percepsatisfac-tions on any IS. The authors empirically confirmed that user satisfaction, in both perspectives, had solid explanatory capabilities.
User satisfaction is, therefore, one of the most important factor when addressing IS success (Mardiana et al., 2015; Tsai et al., 2012).
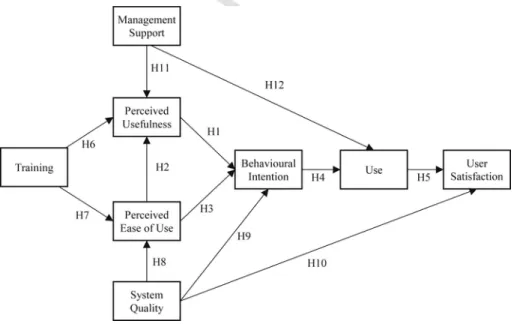
3. Model proposal
3.1. ERP adoption and satisfaction
According to the literature review, a question subsists: how do the identified three main external dimensions (System Quality (SYSQ), Management Support (MANS) and, Training (TRAI)) influence ERP system use and user satisfaction?
To address this question, and based on previous modelling research (Davis, 1989; Delone & McLean, 2003; Urbach, Smolnik, & Riempp, 2010; Venkatesh & Davis, 2000; Venkatesh et al., 2012), a theoret-ical model is presented (Fig. 2) to assess the impact of management support (MANS), training (TRAI) and system quality (SYSQ) on ERP systems use (USE) and user satisfaction (USS) through the construc-t's effect on perceived usefulness (PU), perceived ease of use (PEOU) and the behavioural intention (BI).
3.2. Model constructs
Following above literature review about ERP system's adoption and success, three relevant external factors were identified: Training (TRAI), Management Support (MANS) and System Quality (SYSQ) (Bradley, 2008; Chien & Tsaur, 2007; Gorla et al., 2010; J.; Nwankpa & Roumani, 2014; Pan & Jang, 2008; Rajan & Baral, 2015; Sternad & Bobek, 2013; Tsai et al., 2012; Youngberg et al., 2009).
UNCORRECTED
PROOF
To measure these dimension's impact on ERP adoption and suc-cess, critical constructs were included for IS adoption evaluating: Per-ceived Usefulness (PU), PerPer-ceived Ease Of Use (PEOU), Behavioural Intention (BI) and, actual Use (USE) (Davis, 1989); and User Satis-faction (USS) to weigh this adoption impact on the individual user (DeLone & McLean, 1992). Main references to these constructs are shown on Table 2.
Perceived usefulness (PU) is defined as “the extent to which a
person believes that using a particular system would enhance his or
Table 2
Constructs and main references.
Construct Concept Reference
Perceived usefulness (PU)
The extent to which a person believes that using a particular system would enhance his or her job performance (Davis, Bagozzi, & Warshaw, 1992; Venkatesh & Davis, 2000) Perceived Ease of Use (PEOU)
The extent to which a person believes that using a particular system would be free of effort
(Davis et al., 1992; Venkatesh & Davis, 2000) Behavioural Intention (BI)
The degree of evaluative affect that an individual associates with using the target system in his or her job
(Venkatesh & Davis, 2000) Use (USE) Behavioural response to an individual's
intention to use the system
(Davis et al., 1992) Training
(TRAI)
A measure of how easy it is for users to be trained on the system, to understand the content material, and to navigate through topics applied to daily tasks
(Ruivo et al., 2014) Management
Support (MANS)
The effort on encouragement to use and support for usage driven by management
(Urbach et al., 2010) System
Quality (SYSQ)
The degree on which the system is easy to use and complies with functionality, reliability, flexibility, data quality and integration needs to accomplish some task.
(Delone & McLean, 2003; Urbach et al., 2010) User Satisfaction (USS)
Recipient response to the use of the output of an information system (Delone & McLean, 2003; Urbach et al., 2010) Table 3 Sample characterization. Sample characteristics (n = 155) Gender Female 61 39% Male 94 61% Instruction level
Lower than bachelor 47 30%
Bachelor 82 53%
Master or Higher 26 17%
Organization size
Less than 20 workers 43 28%
21–100 workers 58 37%
101–500 workers 37 24%
More than 500 workers 17 11%
Used ERP functional modules
Sales 72 15% Orders 63 13% Accounting 61 13% Inventory 54 11% Treasure 52 11% Human Resources 51 11%
Customer Relationship Management 40 8%
Production 40 8%
Business Intelligence 36 7%
Others 13 3%
ERP experience
Less than five years 68 44%
5–10 years 37 24%
More than ten years 50 32%
her job performance” (Venkatesh & Davis, 2000, p. 187) (Davis,
1989, p. 320) (Davis, 1989, p. 320) (see Table 3). According to the same authors, perceived ease of use (PEOU) is understood as “the
ex-tent to which a person believes that using a particular system would be free of effort.” Behavioural intention (BI), which is directly
influ-enced by PU and PEOU, is found as a mediator for the actual system's usage. This construct (BI) is comprehended as “the degree of
evalu-ative affect that an individual associates with using the target system in his or her job” (Davis, 1993, p. 473) and has proven to be a strong
predictor toward actual use (Sheppard, Hartwick, & Warshaw, 1988). Use, in turn, is the target dimension in most adoption models and mea-sures the behavioural response to an individual's intention to use the system (Davis, 1993).
Previous research showed that after various empirical applications, PU and PEOU have proven to be good predictors of the behaviour in-tention and the attitude toward actually use an IS (Bueno & Salmeron, 2008) (Legris, Ingham, & Collerette, 2003).
Research shows that to ensure a successful ERP system, an overall organization commitment driven by management is fundamental. This management commitment is crucial to resolve conflicts and to help to ensure that everybody cooperates towards the same goal (Bingi, Sharma, & Godla, 1999). Encouragement to use and support for usage are key factors to management support and help to build a perception of the system's usefulness (Urbach et al., 2010).
Another relevant factor that cannot be dissociated from adoption is the system quality. System quality is defined as “the degree to which
the system is easy to use for accomplishing some task” (Schaupp,
Weiguo Fan, & Belanger, 2006, p. 3). Urbach et al. (2010), found fur-ther evidence of the importance of system quality when assessing an IS. In their empirical survey, system quality proven to be one of the most important constructs and exhibited the highest score among the external factors effect on the model.
Due to the complexity of ERP systems, the “knowledge transfer” can be challenging. Training is critical for users to cope adequately with all the functionalities and responsibilities (Bingi et al., 1999). Ac-cording to Ruivo, Oliveira, and Neto (2014, p. 170), assessing per-ceived training “is a measure of how easy it is for users to be trained
on the system, to understand the content material, and to navigate through topics applied to daily tasks.” This particular construct is
rel-evant because also offers some insight into organization's culture to-ward human resources.
Summarizing, these three dimensions were considered the most relevant for assessing the external stimulus: Management support (MANS), System quality (SYSQ) and Training (TRAI).
Originally seen as the most used single measure to assess IS suc-cess, user satisfaction is defined as the “recipient response to the use
of the output of an information system” (DeLone, 1988, p. 68). For
example, Urbach et al. (2010) identifies user satisfaction as the main determinant of the model with a large effect on individual impact and therefore on IS success.
3.3. Hypotheses to explain ERP use and user satisfaction
According to Davis (1989), Perceived Usefulness (PU) showed to be a strong influencer when studying user intentions and should never be rejected. Although this construct has seen some mixed results, in general, has been validated by various researchers in the MIS area as one important predictor of user's behaviour intention (BI) (Petter et al., 2008).
Also, several empirical studies used this relation to evaluate user's adoption of ERP systems. Youngberg et al. (2009), in their study to analyse user perceptions of a particular ERP component, found a
UNCORRECTED
PROOF
strong linkage between these two constructs. Other studies also dis-covered a very significant relationship when using perceived useful-ness to explain user's behavioural intention (BI) (Rajan & Baral, 2015; Sternad & Bobek, 2013).
Thus, we believe that perceived usefulness (PU) is a good predic-tor of user's behavioural intention (BI) towards ERP system use.
H1
Perceived ERP Usefulness has a positive effect on users Be-havioural Intention.
As Davis (1989) demonstrated, perceived ease of use is a di-rect influence of perceived usefulness. In his research, the author found that the influence PEOU had on behaviour was largely me-diated by PU. This is mainly explained because “users are
dri-ven to adopt an application primarily because of the functions it performs for them, and secondarily for how easy or hard it is to get the system to perform those functions” (Davis, 1989, p. 333).
In the elaboration of a very comprehensive study, Venkatesh & Davis (2000) confirmed, with a very significant statistical valida-tion, the influence of perceived ease of use on perceived useful-ness.
Rajan and Baral (2015), Applying this relation to the specific case of ERP's area of research, found strong support in this rela-tion. Also, other researchers confirmed that perceived ERP ease of use has a direct positive effect on user's ERP perceived usefulness (Sternad & Bobek, 2013; Youngberg et al., 2009).
Therefore, we hypothesize that ease of use is a reliable predic-tor of the perceived usefulness.
H2
Perceived ERP Ease of Use of has a positive effect on its Per-ceived Usefulness.
Influencing behavioural intention directly and indirectly (through PU), the perceived freeness of effort that a user experi-ences from IS usage, partially explains the behavioural intention (Davis, 1989). PEOU has shown a lower significance level than PU in past studies (Petter et al., 2008). Nevertheless, there is a strong theoretical basis for this relation, and the direct impact rel-evance cannot be disregarded (Venkatesh & Davis, 2000).
On the subject of ERP studies, this impact is also evident. In recent studies made including this particular relation, researchers found support for this relation (Rajan & Baral, 2015; Sternad & Bobek, 2013).
Hence, we believe that perceived ease of use will have a posi-tive effect on behavioural intention.
H3
Perceived ERP Ease of Use has a positive effect on users Be-havioural Intention.
Previous research showed that the behavioural intention (BI) has a significant impact on the actual system's usage (USE) (Davis et al., 1992). Also, Venkatesh & Davis (2000) found that the user's behavioural intention fully mediated the PU, PEOU and subjec-tive norm on actual system use. Further on, Legris et al. (2003) in a meta-analysis of empirical research made with adoption models found that almost all studies that tested the BI-USE relation found a positive relation to report.
Confirming previous findings in other IS fields, ERP systems studies also found a strong relation between user's behavioural in-tention (BI) and actual ERP use (USE) (Sternad & Bobek, 2013; Youngberg et al., 2009).
For this reason, we expect that the behavioural intention in us-ing ERP systems may have a significant and positive effect on ac-tual use of enterprise resource planning systems.
H4
User Behavioural Intention has a positive effect on ERP Use. According to Delone & McLean (2003), the study of usage (USE) impact on the user satisfaction (USS) is a determinant re-lation to assess the success with any IS. This construct (USS) has been found to be the most important dimension influencing net benefits when evaluating IS success (Mardiana et al., 2015; Tsai et al., 2012).
Although theory underlines the importance of usage (USE) in-fluence on user satisfaction (USS) when studying ERP, the most recent contributions are scarce.
Therefore, we predict that ERP system use (USE) may have a positive on user satisfaction (USS).
H5
ERP system Use has a positive effect on User Satisfaction. As seen above, training assumes a very important role in a suc-cessful implementation and maintenance of an ERP system. Peo-ple need to understand how the right flow of information can help the organization as well as their own tasks (Bingi et al., 1999).
Various ERP studies also show that this fact is mainly ex-plained by the direct influence of training on the perceived ERP usefulness (PU) (Bradley, 2008; Rajan & Baral, 2015; Youngberg et al., 2009).
Thus, we hypothesize that user training (TRAI) will have a positive effect on both perceived ERP usefulness (PU) and ease of use (PEOU).
H6
User Training has a positive effect on Perceived ERP Useful-ness.
Having a perfect understanding of the system, as a result of a good training programme largely enhances user's perceptions about how easy is to use the system (Ruivo et al., 2014). Also, Amoako-Gyampah and Salam (2004) found strong evidence that user training (TRAI) strongly influences the perceived ERP ease of use (PEOU).
H7
User Training has a positive effect on Perceived ERP Ease of Use.
System quality (SYSQ) is often found to be one of most rele-vant constructs and is always found strong support when assess-ing matters of IS adoption (Schaupp et al., 2006; Urbach et al., 2010). This particular construct is widely considered as one of the best explanatory construct and is often considered in ERP research (Chien & Tsaur, 2007; Gorla et al., 2010; Rajan & Baral, 2015; Sternad & Bobek, 2013; Tsai et al., 2012). In recent studies, a sig-nificant impact on System quality on the perceived ERP ease of use was also found to be very relevant (Gorla et al., 2010; Sternad & Bobek, 2013).
According to these evidence, we postulate that system quality has a positive effect on the perceived ERP system ease of use.
H8
ERP System Quality has a positive effect on Perceived ERP Ease of Use.
An important relation that literature indicates is the influence that the system quality has on users behavioural intentions.
UNCORRECTED
PROOF
This fact also applies to ERP research, Chien and Tsaur (2007) when assessing the implementation of an ERP solution in three firms found that the most significant influence of user behavioural intention was the ERP system quality.
Hence, we believe that the ERP system quality (SYSQ) may have a positive effect on user behavioural intention (BI).
H9
ERP System Quality has a positive effect on User Behavioural Intention.
According to (Petter et al., 2008) various researchers have been studying the effect of system quality in user satisfaction through a diversity of intermediate dimensions and using different IS types. A recent study in IS success found a significant relation-ship between these two dimensions, system quality was consid-ered to be the most significant dimension to explain user satisfac-tion (Urbach et al., 2010).
In the case of ERP systems research, this relation is also found true. System quality is indeed an important determinant of user satisfaction with the ERP system (Chien & Tsaur, 2007; Tsai et al., 2012).
Therefore, we expect that the system quality (SYSQ) has a strong and positive effect on user satisfaction (USS).
H10
ERP System Quality has a positive effect on User Satisfaction. According to Bingi et al. (1999), top management role is not only to fund the ERP system, all managerial levels must have full commitment during all stages and ensure that all process runs smoothly. Management support is decisive to build up user's per-ceptions on system usefulness (Urbach et al., 2010).
Moreover, recent studies show that management support is vital and forms user's perceptions of how useful the system is (Bradley, 2008; J.; Nwankpa & Roumani, 2014; Rajan & Baral, 2015). In fact, Nwankpa and Roumani (2014) say that manage-ment intervention“educates” users about ERP's usefulness.
Thus, we hypothesize that management support (MANS) in-fluences positively the ERP usefulness.
H11
Management Support has a positive effect on Perceived ERP Usefulness.
According to Urbach et al. (2010), having management sup-port is essential to motivate system's use.
With similar conclusions, several recent studies point out that this management encouragement can largely influence the use fre-quency of ERP systems (Bradley, 2008; J.; Nwankpa & Roumani, 2014; Pan & Jang, 2008).
Hence, we expect that the management support (MANS) may increase effective ERP use (USE).
H12
Management Support has a positive effect on ERP Use.
4. Empirical methodology
4.1. Measurement instrument
The research model was validated through the quantitative method using previously proven and tested scales to operationalize each con-struct and increase validity. Hence, in the development of the mea-surement instrument items were adapted from the previously con-firmed empirical studies.
Considering the reviewed literature, a set of items was selected for each construct. After a thorough discussion, the most appropriate a group of items from previously validated empirical studies was cho-sen to have into consideration the validity and model's best fit.
Afterward, a first draft was created and pre-tested with a panel of ten randomly chosen ERP end users from different organizations. The first part included an introduction and a set of sample characterization questions. On the second part, the chosen model's construct were mea-sured using a seven-point Likert-type scale (1- Completely disagree, (…) 7- Completely agree).
All inputs about appearance and instructions were taken into ac-count, and the final survey instrument was then ready to send. Appendix A contains the final measurement items used for testing the structural model.
4.2. Sampling and data collection
The universe is composed of end users that work with ERP systems in their organization routine tasks. As sample strategy, and to guaran-tee the quality of the data and the responding end users' profile, we ob-tained a list from 1000 largest companies, then we added a list of small and medium enterprises (SMEs). Afterward, 260 companies were ran-domly selected. We acquired their public contacts and sent e-mails to obtain the permission to distribute the questionnaire to their employ-ees.
The data was collected by the means of an online survey addressed by email to end-users that work with ERP systems in their organi-zation's routine tasks, activities and business processes. Several ERP end-users from different industries were reached by email to aid this endeavour. Answers were collected between the beginning of June of 2015 and the 31st of August. In this three-month period, 157 answers were received. Two responses were found incomplete, and 155 were considered valid. We believe that no more than 60.4% of the end users' companies responded.
To test the non-response bias of the 155 responses, early respon-dents were confronted with the late responrespon-dents and then compared with the sample distributions using Kolmogorov-Smirnov (K-S) test (Ryans, 1974).The K-S test results showed that the sample distrib-utions were the same across early and late respondents. To confirm that no factor explained individually the majority of the variance, a common method using the Harman's one-factor test was performed (Podsakoff, MacKenzie, Lee, & Podsakoff, 2003). The sample size was considered large enough and appropriate to conduct statistical tests (Cohen, 1992).
5. Data analysis & results
5.1. Assessment of the measurement model
To examine the relationship and causal effects of the proposed model (Fig. 2) the structural equation modelling (SEM) with partial least squares (PLS) method was used (Hair, Ringle, & Sarstedt, 2011; Ringle, Wende, & Will, 2005). The use of PLS is considered ade-quate to test the measurement model and to validate the causality of a structural model. PLS minimizes the residual variances of the en-dogenous constructs and requires smaller samples (Hair, Ringle, & Sarstedt, 2013; Hair et al., 2011; Henseler & Chin, 2010). Consis-tent with above, all constructs were operationalized with the contri-bution of previous studies in this area. Afterward, the measurement model was examined to evaluate the reliability and construct's validity (Ringle et al., 2005).
UNCORRECTED
PROOF
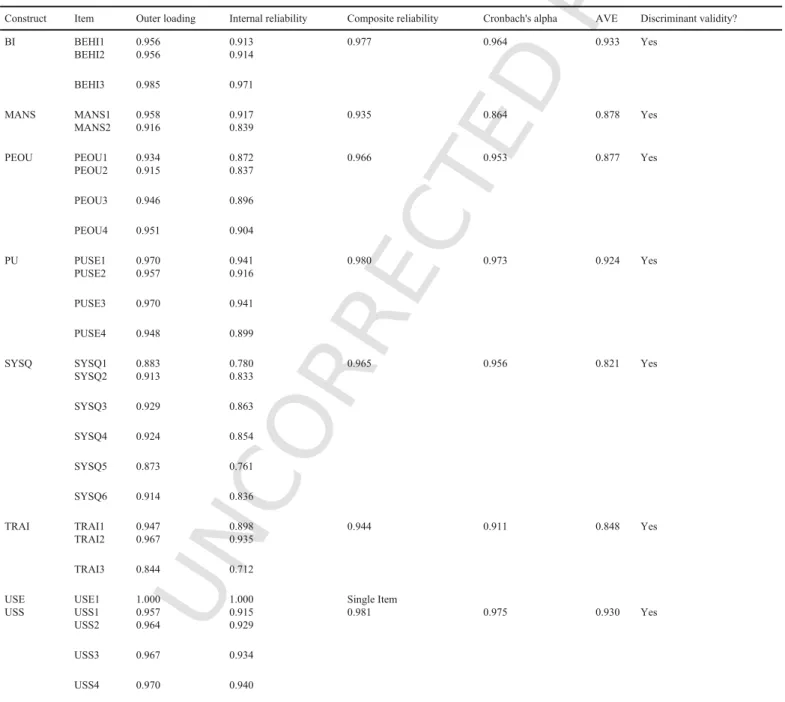
Table 4 indicates that items reliability are above 0.700 (Hair Jr., Hult, Ringle, & Sarstedt, 2013). This means that all items are equally reliable (see Appendix B). Furthermore, the convergent and discrimi-nant validities are demonstrated in Table 4.
As presented in Table 4, all items converge and share a high pro-portion of variance. This fact is of particular importance as these con-structs explain more than half of the variance of their indicators. Com-monality shows that construct's outer loadings have much in common when measuring each of the latent variables (LV).
The empirical results on the discriminant validity show that each construct is distinct from other constructs. Considering a more liberal criterion (Hair Jr. et al., 2013), from Appendix A, it is inferred that each indicator is associated with only one construct. The cross-load-ing table shows that indicator's outer loadcross-load-ings are greater than all of their loadings on other constructs. An item loading is considered high
if the loading coefficient is above 0.600 and considered low if the co-efficient loading is below 0.400 (Gefen & Straub, 2005).
Since cross-loadings, indicators are considered a rather liberal cri-terion regarding discriminant validity, a more conservative approach to assessing discriminant validity was also taken into consideration. The Fornell-Larcker criterion validates constructs by comparing the square root of Average Variance Extracted (AVE) with the results of the latent variable correlation (Fornell & Larcker, 1981; Hair et al., 2011). This criterion is based on the idea that a construct shares more variance with its associated indicators than with any other construct, Table 5 reports that comparison. It shows that all the model's con-structs are validated, and that measures of different concon-structs differ from one another.
The results of the measurement model show the item's reliability and convergent validity. In other words, the model's LV, behavioural intention (BI), management support (MANS), perceived ease of use
Table 4
Measurement model results.
Construct Item Outer loading Internal reliability Composite reliability Cronbach's alpha AVE Discriminant validity?
BI BEHI1 0.956 0.913 0.977 0.964 0.933 Yes
BEHI2 0.956 0.914
BEHI3 0.985 0.971
MANS MANS1 0.958 0.917 0.935 0.864 0.878 Yes
MANS2 0.916 0.839
PEOU PEOU1 0.934 0.872 0.966 0.953 0.877 Yes
PEOU2 0.915 0.837 PEOU3 0.946 0.896 PEOU4 0.951 0.904 PU PUSE1 0.970 0.941 0.980 0.973 0.924 Yes PUSE2 0.957 0.916 PUSE3 0.970 0.941 PUSE4 0.948 0.899
SYSQ SYSQ1 0.883 0.780 0.965 0.956 0.821 Yes
SYSQ2 0.913 0.833
SYSQ3 0.929 0.863
SYSQ4 0.924 0.854
SYSQ5 0.873 0.761
SYSQ6 0.914 0.836
TRAI TRAI1 0.947 0.898 0.944 0.911 0.848 Yes
TRAI2 0.967 0.935
TRAI3 0.844 0.712
USE USE1 1.000 1.000 Single Item
USS USS1 0.957 0.915 0.981 0.975 0.930 Yes
USS2 0.964 0.929
USS3 0.967 0.934
UNCORRECTED
PROOF
Table 5
Interconstruct correlation and square root of AVEs.
BI MANS PEOU PU SYSQ TRAI USE USS
BI 0.966 MANS 0.460 0.937 PEOU 0.659 0.380 0.937 PU 0.711 0.460 0.584 0.961 SYSQ 0.689 0.327 0.750 0.592 0.906 TRAI 0.557 0.301 0.611 0.485 0.604 0.921
USE 0.451 0.401 0.366 0.433 0.320 0.257 Single Item
USS 0.744 0.393 0.705 0.722 0.832 0.596 0.356 0.964
Notes: Diagonal elements are square roots of average variance extracted (AVE), Off-diagonal elements are correlations.
(PEOU), perceived usefulness (PU), system quality (SYSQ), training (TRAI), use (USE), and user satisfaction (USS), are well represented by all the questions posed to ERP end-users. Once the measurement model is confirmed regarding reliability and validity using PLS, the next step is to assess the structural model.
5.2. Assessment of the structural model
Before the assessment of the structural model we tested all the constructs for multicollinearity, which is considered to be a threat to model experimental design (Farrar & Glauber, 1967), we calcu-lated the variance inflation factor (VIF). Test results showed that mul-ticollinearity does not exist, all variance inflation factors obtained were lower than 4.671, which is well below than the threshold of 10 (Diamantopoulos & Siguaw, 2006; Gujarati & Porter, 2009).
The structural model's quality was evaluated using bootstrapping, a resampling technique that draws a large number of subsamples re-trieved from the original dataset. In this case, 5000 subsamples were used to determine the path's significance within the structural model
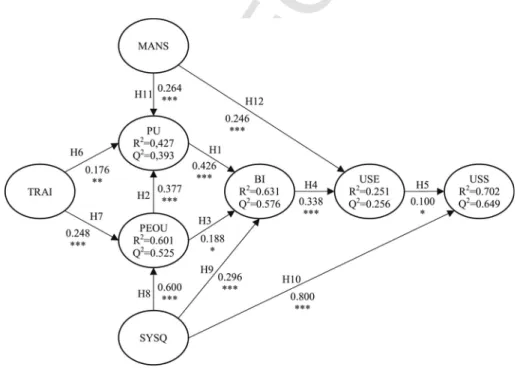
(Henseler, Ringle, & Sinkovics, 2009). Structural model results can be observed in Fig. 3.
After establishing the validity of the structural model, the struc-tural paths were assessed to test the research hypotheses. Training ( = 0.176, p < 0.010), Management Support ( = 0.264, p < 0.001), and Perceived Ease of Use ( = 0.377, p < 0.001), explain 42.7% of the variation in Perceived Usefulness. In another hand, Training (
= 0.248, p < 0.001) and System Quality ( = 0.600, p < 0.001), ex-plain 60.1% of the Perceived Ease of Use.
Behaviour Intention is explained in 63.1% by the constructs of Per-ceived Usefulness ( = 0.426, p < 0.001), PerPer-ceived Ease of Use (
= 0.188, p < 0.050) and System Quality ( = 0.600, p < 0.001). Be-haviour intention ( = 0.338, p < 0.001) and Management Support ( = 0.246, p < 0.001) explain 25.1% of the ERP system Use while the same Use ( = 0.100, p < 0.010) together with System Quality (
= 0.800, p < 0.001) explains 70.2% of the variation in User satisfac-tion. All paths are statistically significant and, therefore, all hypothe-ses are supported.
The presented model supported all paths having, at least, a small predictive impact, as seen in Table 6. The five dependent latent vari-ables are explained in more than half of the variances except PU and USE. User satisfaction (USS) with R2= 0.702, behavioural inten-tion (BI) with R2= 0.631, and Perceived Ease of Use (PEOU) with R2= 0.601, present values that can be considered substantial. Q2is
a measure of the predictive success, and positive values confirm the model's predictive relevance (Geisser & Eddy, 1979; Stone, 1974). Results show positive values for Use (Q2= 0.256), Perceived Useful-ness (Q2= 0.393), Perceived Ease of Use (Q2= 0.525), Behavioural Intention (Q2= 0.576) and User Satisfaction (Q2= 0.649).
UNCORRECTED
PROOF
Table 6
Results of hypotheses tests. Hypotheses
Independent
variable →
Dependent
variable Findings Conclusion
H1 Perceived Usefulness (PU) → Behavioural Intention (BI) Positively & statistically significant∗∗∗( = 0.426, p < 0.001) Supported with medium effect H2 Perceived Ease Of Use (PEOU) → Perceived Usefulness (PU) Positively & statistically significant∗∗∗( = 0.377, p < 0.001) Supported with small effect H3 Perceived Ease Of Use (PEOU) → Behavioural Intention (BI) Positively & statistically significant∗( = 0.188, p < 0.050) Supported with small effect H4 Behavioural Intention (BI)
→ Use (USE) Positively & statistically significant∗∗∗( = 0.338, p < 0.001) Supported with small effect H5 Use(USE) → User Satisfaction (USS) Positively & statistically significant∗( = 0.100, p < 0.050) Supported with small effect H6 Training (TRAI) → Perceived Usefulness (PU) Positively & statistically significant∗∗( = 0.176, p < 0.010) Supported with small effect H7 Training (TRAI) → Perceived Ease Of Use (PEOU) Positively & statistically significant∗∗∗( = 0.248, p < 0.001) Supported with small effect H8 System Quality (SYSQ) → Perceived Ease Of Use (PEOU) Positively & statistically significant∗∗∗( = 0.600, p < 0.001) Supported with large effect H9 System Quality (SYSQ) → Behavioural Intention (BI) Positively & statistically significant∗∗∗( = 0.296, p < 0.001) Supported with small effect H10 System Quality (SYSQ) → User Satisfaction (USS) Positively & statistically significant∗∗∗( = 0.800, p < 0.001) Supported with large effect H11 Management Support (MANS) → Perceived Usefulness (PU) Positively & statistically significant∗∗∗( = 0.264, p < 0.001) Supported with small effect H12 Management Support (MANS)
→ Use (USE) Positively & statistically significant∗∗∗( = 0.246, p < 0.001) Supported with small effect Notes: Path Coefficient ; NS = not significant;∗significant at p < 0.010;∗∗significant
at p < 0.050.;∗∗∗significant at p < 0.001.
Effect size: >0.350 large; >0.150 and ≤ 0.350 medium; >0.20 and ≤ 0.150 small (Chin, 1998; Cohen, 1988).
6. Discussion
6.1. Hypotheses discussion
All presented hypotheses were empirically supported for ERP sys-tems. Though the given model shows predictive capacities supporting
all hypotheses, results show different levels of support. These singu-larities will be addressed below.
Results show that the model's inner triangle, i.e. hypotheses 1, 2, and 3, show different effects. All effects are significant and pos-itive but have different strengths. In the first hypothesis, perceived usefulness has a very significant influence on behavioural intention (p < 0.001) and also has medium effect explaining this relation (0.350 > f2> 0.150). The relation between perceived ease of use and
perceived usefulness (hypothesis 2) is very significant (p < 0.001) and has a medium explanatory effect (0.350 > f2> 0.150). Hypothesis 3
shows different results. The statistical significance of perceived ease of use impact on behavioural intention is low (p < 0.050), and the ef-fect is small (0.150 > f2> 0.020). These results are all consistent with Sternad and Bobek (2013) and Rajan and Baral (2015) findings in ERP adoption studies about these three hypotheses.
Hypotheses influencing use (H4, H12) both show positive sig-nificant impact (p < 0.001) and a small effect (0.150 > f2> 0.020). As a matter of fact, the findings are in the same line with previous ERP studies that studied the same kind of relations (J. Nwankpa & Roumani, 2014; Rajan & Baral, 2015; Youngberg et al., 2009).
Hypothesis 11 shows management support impact on perceived usefulness. This relation is positive, highly significant (p < 0.001), and shows a small effect (0.150 > f2> 0.020) explaining perceived
useful-ness. Results are consistent with Bradley's (2008) qualitative study on how management support was required but wasn't the most important fact explaining project's success. Also Nwankpa and Roumani (2014) sustain that management support is important educating users about ERP system usefulness.
Considering reviewed literature, results on training effect on per-ceived usefulness and on perper-ceived ease of use are somewhat dis-appointing. Model results show that training has a medium signifi-cance (p < 0.010) and a small effect (0.150 > f2> 0.020) towards
per-ceived usefulness (hypothesis 6), and a high statistical significance (p < 0.001) but also small effect (0.150 > f2> 0.020) explaining
per-ceived ease of use (hypothesis 7). Literature stresses the critical im-portance of this specific construct's contribution to IS adoption in gen-eral and in ERP systems in particular (Bradley, 2008; Rajan & Baral, 2015; Ruivo et al., 2014; Youngberg et al., 2009). Although is also positively and significantly related to the model, training is the weak-est independent latent variable.
System quality is without a doubt the most influencing indepen-dent LV of the model. This construct impact on perceived ease of use is vast (p < 0.001) and has a large explanatory effect (f2> 0.350). This result is consistent with the previous ERP adoption study by Sternad and Bobek (2013). Hypothesis 9 shows a weaker link of system qual-ity with behavioural intention, presenting a small explanatory effect (0.150 > f2> 0.020) and high statistical significance (p < 0.001). However, the system quality may be related to the extent of ERP im-plementation, as long as it can create the initial conditions for applica-tion integraapplica-tion and business process enhancements (J. K. Nwankpa, 2015). The ERP modularity characteristics can provide the possibility of a different scope and depth level of implementation. This relation-ship needs further studies.
In this study management support and system quality are key dri-vers to use and to user satisfaction, correspondingly. These dimen-sions can be related to change management and with ERP selection (Ranjan, Jha, & Pal, 2016), this is a relevant aspect needing to be stud-ied.
Finally, the difference between hypotheses related with user satis-faction (H5 and H10) are quite revealing of system's quality weight in explaining user's perceptions about an ERP system. We have hypoth
UNCORRECTED
PROOF
esis 5 with a weak linkage between use and user satisfaction regard-ing statistical significance (p < 0.050), and in explanatory capabili-ties (small effect: 0.150 > f2> 0.020). In opposition to this result,
sys-tem quality showed a very high statistical significance (p < 0.001) as well as a large effect (f2> 0.350) when explaining user satisfaction. Our results confirm what other ERP studies suggested: System quality (SYSQ) is a key component to take into consideration (Chien & Tsaur, 2007; Tsai et al., 2012).
6.2. Theoretical implications
The present research work has three main theoretical implications. First, is among the first works to empirically assess ERP system's adoption and user satisfaction under the same model. Secondly, the integration of dimensions from adoption models (Davis et al., 1992; Venkatesh & Davis, 2000), combined with the ones coming from the DeLone & McLean model (DeLone & McLean, 1992; Delone & McLean, 2003) and other mix approaches (Ruivo et al., 2014; Urbach et al., 2010), constitute a unique combination to consider.
Thirdly, results suggest that user satisfaction can be largely ex-plained by system quality. System quality should be observed as a de-cisive construct when assessing an IS system, specifically ERP sys-tems.
6.3. Practical implications
The presented model offers a mean of organizations to assess and predict the adoption and user satisfaction of their ERP systems. As seen before, ERP systems' adoption and user satisfaction are multidi-mensional and interdependent, and while some relations are stronger than others, the analysis should never isolate or reject one particular construct.
Although management support and training showed a lesser signif-icance, this does not mean the influence should be disregarded since the influence exists and is statistically supported.
However, results are quite clear: system quality has the best ex-planatory capabilities and can largely and directly explain user satis-faction. Hence, practical implications for industry should be taken into account when implementing and maintaining an ERP system.
A correct understanding of the organization real necessities and re-quirements is vital to ensure that the configuration and parameteriza-tion of the needed funcparameteriza-tionalities are process oriented and without any clutter. Another implication is the importance of ensuring that all sys-tem components (hardware and software) are well balanced and inte-grated to assure fast and reliable data access.
6.4. Limitations and future work
The present study has some limitations. First, the sample data was collected from several organizations representative of major indus-tries but doesn't have a comprehensive and exhaustive industry-wide panorama. Also, the sample was obtained from just one European country and represents a nationwide perspective. Although the results are statistically relevant, further surveys with a larger territorial scope will increase the model's explanatory capabilities.
The proposed model suggest a deeper study of the influence strength of System Quality with the other constructs. The most in-triguing finding relates to the explanatory capabilities of this construct (SYSQ) opposed to the classical adoption and success theories when studying user satisfaction.
7. Conclusions
Nowadays, ERPs are at the core of every modern and competitive business. This multidimensional IS manages all the information flow and is critical for every organization stakeholder. Therefore, it is vi-tal to understand what motivates individuals to use best the given ERP system. Hence, the present study aims to find the main determinants influencing ERP user adoption and satisfaction.
Literature review points out to three most significant constructs influencing adoption and satisfaction (independent LV) which are System Quality (SYSQ), Management Support (MANS), and Train-ing (TRAI). Additionally, there are other relevant constructs to take into consideration in the model development: Perceived Usefulness (PU); Perceived Ease of Use (PEOU); Behavioural Intention (BI); Use (USE); and User Satisfaction (USS). These are the key dimensions (LV) found and validated to assess user adoption and satisfaction.
The questionnaire answers were representative of various or-ganization sizes and user's experience with ERP systems. The col-lected data is relevant to validate both the measurement and the struc-tural model's results.
All hypotheses were confirmed enabling a good basis for theoreti-cal and practitheoreti-cal implications support. Theoretitheoreti-cally, the present study is among the very first works to combine IS Adoption and IS Success theories, and empirically study ERP system's adoption and user satis-faction under the same model. Furthermore, the present model found that system quality is a decisive determinant of user satisfaction with the ERP system.
In practical terms, special care about system quality must always take place. All system components ought to be carefully defined in a holistic approach, to achieve perfect balance and consequently influ-ence user satisfaction and adoption, where management support is es-sential. Those findings are helpful to companies involved in the ERPs implementation process. By evolving an active participation of man-agement, and also paying particular attention to system quality, user adoption, and user satisfaction is achieved. This study concludes, that if supervisors encourage the ERP use, and organization leadership is explicitly supportive of the ERP adoption than the frequency of ERPs usage will increase. The degree on which the system is easy to use and complies with functionality, reliability, flexibility, data quality and in-tegration needs to accomplish some task leads to the increase of inten-tion to use, and to user satisfacinten-tion about ERPs.
Appendix A. Measurement items.
Construct Code Indicator Reference
Perceived Useful-ness (PU)
PU1 Using the system improves my perfor-mance in my job
(Venkatesh & Davis, 2000) Cronbach's alpha = 0.973 PU2 Using the system in my job increases my
productivity
PU3 Using the system enhances my effective-ness in my job.
PU4 I find the system to be useful in my job. Perceived
ease of use (PEOU)
PEOU1 My interaction with the system is clear and understandable.
(Venkatesh & Davis, 2000) Cronbach's alpha = 0.953 PEOU2 Interacting with the system does not require
UNCORRECTED
PROOF
Appendix B. Cross-loadings.(In bold we provide indicators outer loading on the associated construct.)
Appendix C. Model structural paths.
Uncited reference
Chen et al., 2011.
PEOU3 I find the system to be easy to use. PEOU4 I find it easy to get the system to do what I
want it to do.
Behav-ioural in-tention (BI)
BI1 I intend to continue using the ERP in the future.
(Venkatesh et al., 2012) Cronbach's alpha = 0.964 BI2 I will always try to use the ERP in my
daily life.
BI3 I plan to continue to use the ERP fre-quently.
Use (USE) USE1 At the present time, I consider myself to be a frequent user of the ERP.
(Davis et al., 1992) Cron-bach's al-pha = 1 Training (TRAI)
TRAI1 According to users programme training, please rate the degree of how was training on the system.
(Ruivo et al., 2014) Cron-bach's al-pha = 0.911 TRAI2 According to users programme training,
please rate the degree of how was their understanding of the content training ma-terial.
TRAI3 According to users programme training, please rate the degree of how worthy is navigating through the topics after train-ing and applied in daily tasks.
Manage-ment sup-port (MANS)
MANS1 My supervisor actively encourages me to use the ERP.
(Urbach et al., 2010) Cron-bach's al-pha = 0.864 MANS2 My organization's leadership explicitly
supports the ERP. System
quality (SYSQ)
SYSQ1 Our ERP is easy to navigate. (Urbach et al., 2010) Cron-bach's al-pha = 0.956 SYSQ2 Our ERP allows me to easily find the
in-formation I am looking for. SYSQ3 Our ERP is well structured. SYSQ4 Our ERP is easy to use.
SYSQ5 Our ERP offers appropriate functionality. SYSQ6 Our ERP offers comfortable access to all
the business applications I need. User
satis- fac-tion(USS)
USS1 The ERP supports adequately my area of work and responsibility
(Urbach et al., 2010) Cron-bach's al-pha = 0.975 USS2 The ERP is efficient.
USS3 The ERP is effective.
USS4 The ERP satisfies me on the whole.
Be- hav-ioural inten-tion (BI) Manage-ment support (MANS) Per-ceived ease of use (PEOU) Per-ceived use- ful-ness (PU) System quality (SYSQ) Train-ing (TRAI) Use (USE) User satis- fac-tion (USS) BI1 0.956 0.442 0.596 0.676 0.689 0.489 0.410 0.749 BI2 0.956 0.453 0.650 0.682 0.630 0.567 0.484 0.670 BI3 0.985 0.438 0.662 0.702 0.678 0.555 0.410 0.739 MANS1 0.458 0.958 0.386 0.504 0.292 0.298 0.412 0.366 MANS2 0.397 0.916 0.318 0.333 0.329 0.261 0.329 0.373 PEOU1 0.656 0.373 0.934 0.657 0.718 0.564 0.414 0.694 PEOU2 0.585 0.374 0.915 0.525 0.580 0.520 0.306 0.603 PEOU3 0.595 0.305 0.946 0.464 0.706 0.581 0.300 0.635 PEOU4 0.627 0.370 0.951 0.530 0.790 0.617 0.342 0.700 PU1 0.699 0.448 0.564 0.970 0.587 0.489 0.409 0.703 PU2 0.636 0.428 0.549 0.957 0.550 0.456 0.386 0.650 PU3 0.651 0.428 0.531 0.970 0.542 0.437 0.421 0.692 PU4 0.739 0.461 0.597 0.948 0.592 0.479 0.445 0.727 SYSQ1 0.590 0.320 0.645 0.470 0.883 0.519 0.310 0.719 SYSQ2 0.579 0.270 0.698 0.492 0.913 0.577 0.254 0.705 SYSQ3 0.660 0.291 0.671 0.575 0.929 0.590 0.297 0.766 SYSQ4 0.598 0.256 0.770 0.500 0.924 0.573 0.283 0.726 SYSQ5 0.684 0.340 0.616 0.626 0.873 0.524 0.293 0.819 SYSQ6 0.630 0.301 0.677 0.546 0.914 0.503 0.305 0.785 TRAI1 0.569 0.343 0.646 0.474 0.646 0.947 0.252 0.611 TRAI2 0.548 0.229 0.611 0.493 0.596 0.967 0.236 0.602 TRAI3 0.389 0.259 0.381 0.352 0.377 0.844 0.222 0.393 USE1 0.451 0.401 0.366 0.433 0.320 0.257 1.000 0.356 USS1 0.713 0.370 0.694 0.678 0.812 0.582 0.373 0.957 USS2 0.717 0.379 0.676 0.694 0.799 0.569 0.342 0.964 USS3 0.713 0.424 0.647 0.721 0.780 0.557 0.323 0.967 USS4 0.726 0.343 0.701 0.694 0.817 0.590 0.335 0.970 Hypothe-ses Path t-Value p-Value
H1 Perceived Usefulness → Behavioural Inten-tion
0.426 6.062 0.000 H2 Perceived Ease Of Use → Perceived
Useful-ness
0.377 3.223 0.002 H3 Perceived Ease Of Use → Behavioural
In-tention
0.188 1.903 0.059 H4 Behavioural Intention → Use 0.338 4.075 0.000
H5 Use → User Satisfaction 0.100 1.875 0.063
H6 Training → Perceived Usefulness 0.176 2.248 0.026 H7 Training → Perceived Ease Of Use 0.248 3.293 0.001 H8 System Quality → Perceived Ease Of Use 0.600 7.898 0.000 H9 System Quality → Behavioural Intention 0.296 2.847 0.005 H10 System Quality → User Satisfaction 0.800 19.369 0.000 H11 Management Support → Perceived
Useful-ness
0.264 3.264 0.001