www.scielo.br/rbg
STUDY OF FLOW IN VADOSE ZONE FROM ELECTRICAL RESISTIVITY SURVEYS
Fernando de Morais
1, Luis de Almeida Prado Bacellar
2and Paulo Roberto Antunes Aranha
3Recebido em 25 maio, 2007 / Aceito em 9 abril, 2008 Received on May 25, 2007 / Accepted on April 9, 2008
ABSTRACT.Among the indirect methods applied to environmental monitoring, electrical resistivity has played an important role in accessing water flow in the non-saturated zone of the soil and, consequently, aquifer recharge. This work evaluates the influence of some pedo-geomorphologic properties in the infiltration and percolation of water through the superficial soil horizons by means of multitemporal electrical resistivity sections. The experiments were carried out in two areas of distinct pedo-geomorphological characteristics developed on the crystalline basement of southeastern Brazil. The first is situated in ahollow-shaped slope where lixisols predominate; the second, in anose-shaped slope where well-developed soils (ferralsols) predominate. The results proved the efficiency of the electrical resistivity method to delimit percolation of tropical soils, even when subtle differences are found in the hydraulic properties of the soil. It was also possible to establish that in thenose slope
percolation is faster than in thehollow.
Keywords: electrical resistivity, hydraulic properties, groundwater, tropical soils.
RESUMO.Entre os m´etodos indiretos aplicados ao monitoramento ambiental, a eletrorresistividade tem desempenhado um papel importante no entendimento do fluxo de ´agua na zona n˜ao saturada dos solos e, conseq¨uentemente, na recarga dos aq¨u´ıferos. Neste trabalho, pretende-se avaliar a influˆencia de algumas propriedades pedo-geomorfol´ogicas na infiltrac¸˜ao e percolac¸˜ao de ´agua pelos horizontes superficiais dos solos por meio de sec¸˜oes de eletrorresistividade multitemporais. Os experimentos foram efetuados em duas ´areas com caracter´ısticas pedo-geomorfol´ogicas distintas em regi˜ao com rochas do embasamento cristalino do sudeste do Brasil. A primeira ´e situada numa encosta com formas cˆoncavas em planta e em perfil (cabeceira de drenagem anfite´atrica), com predom´ınio de argissolos. A segunda ´area se situa numa encosta com forma convexa em planta e em perfil, com predom´ınio de latossolos. Os resultados provam a eficiˆencia da eletrorresitividade para identificar percolac¸˜ao em solos tropicais, mesmo quando h´a diferenc¸as sutis das propriedades hidr´aulicas. Foi tamb´em poss´ıvel confirmar que a percolac¸˜ao ´e mais r´apida na encosta com forma convexa do que na encosta com forma cˆoncava.
Palavras-chave: eletrorresistividade, propriedades hidr´aulicas, ´agua subterrˆanea, solos tropicais.
1Departamento de Geografia, Universidade Federal do Tocantins, Campus de Porto Nacional, Rua 7 s/n, Jardim dos Ipˆes, 77500-000 Porto Nacional, TO, Brazil. Phone: 55 (63) 3363-0500; Fax: (63) 3363-0509 – E-mail: [email protected]
2Departamento de Geologia, Escola de Minas, Universidade Federal de Ouro Preto, Campus Morro do Cruzeiro s/n, 35400-000 Ouro Preto, MG, Brazil. Phone: 55 (31) 3559-1602; Fax: (31) 3559-1600 – E-mail: [email protected]
116
STUDY OF FLOW IN VADOSE ZONE FROM ELECTRICAL RESISTIVITY SURVEYSINTRODUCTION
With the growing of environmental issues, the awareness with the quality and availability of water has increased.
Among the indirect methods applied to environmental moni-toring, electrical resistivity has played an important role in acces-sing the advance of contamination plumes in sanitary landfills, petrochemical complexes and cemeteries, among others (Lima et al., 1995; Depountis et al., 2005). This method has also been applied to access water flow in the non-saturated zone of the soil (Daily et al., 1992; Park, 1998; Hagrey & Michaelsen, 1999; Mukhtar et al., 2000; Neves, 2002; Acworth et al., 2005), once re-sistivity decreases as moisture or the content of dissolved solids in the interstitial water increases (Nascimento et al., 1999).
According to Orellana (1972), electrical resistivity is the spe-cific resistance of a body to let electric current pass through it. This property is based on Ohm’s law, which states that if the in-jected current (I), the voltage (V) and the position of current injection and potential points (current and voltage electrodes res-pectively) are known, resistivity is calculated with the equation:
ρ= V
I
·K (1)
where,Kis a geometric factor dependent on the spatial
arrange-ment of current (AB) and voltage (MN) electrodes.
K =2π·G x (2)
where,xis the spacing adopted for AB and MN dipoles; andn
is a depth factor of the survey, and
G= 1
(1/n)−(2/n+1)+(1/n+2) (3)
It is assumed in Equation 1 that the electric currents are applied to homogeneous and isotropic terrains; in other words, whatever the electrode array, the electrodes are considered to be located in points of equal resistivity. However, this is not obser-ved in nature; in fact, the values obtained represent an apparent resistivity(ρa)(Orellana, 1972).
The main objective of this work is to evaluate the inter-ference of some tropical soil properties in water percolation through superficial soil horizons by means of the electrical res-istivity method. Morais & Bacellar’s (2006) hypothesis is also tested, which states that percolation and, consequently, aquifer recharge in convex features is faster than in concave forms of the landscape.
PHYSIOGRAPHIC SETTING
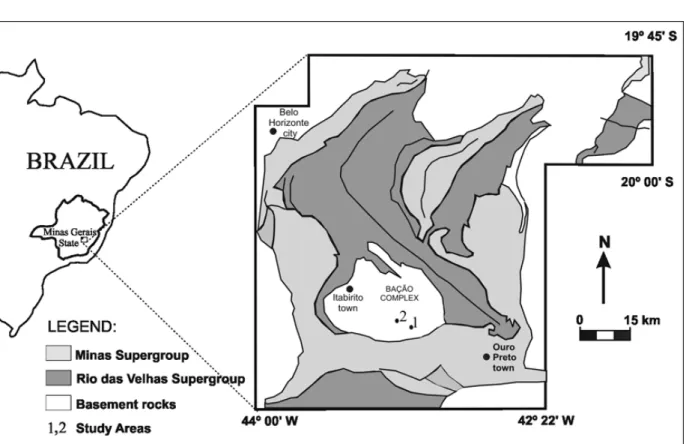
The experiments took place in soils developed on the crystal-line basement of the Quadril´atero Ferr´ıfero (Bac¸˜ao Complex), between Ouro Preto and Belo Horizonte cities, central-southern Minas Gerais State (Fig. 1). Two areas were selected, one close to the Dom Bosco High School (Dom Bosco station) and another in the vicinity of the Holanda creek (Holanda station). The amount of information on pedogenesis, geomorphologic evolution, geotechnical characteristics and soil conservation is large for these areas (Parzanese, 1991; Bacellar, 2000; Silva, 2000; Santos, 2001; Sobreira, 2000; Futai, 2002; Morais, 2003). The climate, according to Koppen’s classification, is of the Cwa-type, with marked annual rainfall contrast. Average annual rainfall is 1,348 mm, concentrated between October and March; average annual temperatures of 19◦
C (Santos, 2001), and average monthly evapotranspiration of 74 mm (Parzanese, 1991).
Finely-banded gneisses of predominantly granodioritic com-position occur in both areas (Dorr, 1969). The weathering mantle is usually very thick, reaching up to 50 m. The relief is smooth, with hills and mounts up to 70-m high (Bacellar, 2000). According to Hack & Goodlet’s (1960) models, the Dom Bosco station area is constituted by a concave-shaped slope in plan and section views (hollow), whereas the Holanda station area is convex-shaped in plan and section views (nose).
The primary vegetation is dominated by savanna (campos cerrados) replaced at present by very and moderately degraded pastures, respectively at the Holanda and Dom Bosco stations (Farias, 1992).
Soil horizon B predominantly contains quartz, kaolinite and gibbsite (Parzanese, 1991; Morais & Bacellar, 2006) and se-condarily goethite, illite, mica, silica and amorphous Al oxides and free Fe (Futai, 2002). Horizon A is more enriched in organic matter.
In the less steep sectors of the landscape, well-developed soils (ferralsols) occur, whereas in the geodynamically younger sectorslixisols andcambisols predominate (Parzanese, 1991; Bacellar, 2000). For these reasons,ferralsols are more common in the Holanda stationnose, whereaslixisols occur in the Dom Bosco stationhollow, with aca. 60 cm deep, less permeable, clayey B horizon (textural B) (Morais & Bacellar, 2006).
At the Holanda station, Bacellar (2000) identifiedcambisols
Figure 1– Location of the study areas in the Bac¸˜ao Complex, Minas Gerais State, (1) Dom Bosco station; (2) Holanda station.
B) of high hydraulic conductivity, overlying a very fractured, but weakly-altered rock (Morais & Bacellar, 2006).
Excepting thecambisols, the texture of the Holanda station soils are characteristically very fine, with clay contents>37%. At the Dom Bosco station, clay contents are less, excepting the points situated in thehollow external limit (Morais & Bacellar, 2006), which show transition characteristics to ferralsols that occur in thenoses.
Grain-size determinations carried out without the use of de-flocculants yielded clay-free, sandy texture for these soils, due to the strong aggregation caused by Fe and Al oxy-hydroxides (Parzanese, 1991; Bacellar, 2000; Silva, 2000; Futai, 2002).
At the Holanda station, Morais & Bacellar (2006) obtained average hydraulic conductivity values of 2.20 ×10⁻⁵ m/s and
2.09×10⁻⁵m/s for 0.15-m (horizon A) and 0.50-m (horizon B)
depths respectively. At the Dom Bosco station, the average values were 1.44×10⁻⁵ m/s and 6.70×10⁻⁶ m/s for 0.15-m
(hori-zon A) and 0.50-m (hori(hori-zon B) depths respectively, suggesting a slower percolation in the lixisols of thehollows than in the
ferralsols of the noses. The Holanda station cambisol presents higher hydraulic conductivity values due to its coarser-grained texture (Morais & Bacellar, 2006).
METHODS
Based on Morais & Bacellar’s (2006) works, four points were chosen, DB10 and DB27 at the Dom Bosco station and H03 and H18 at the Holanda station. Point H18 is a typicalferralsol, whe-reas point H03 is acambisol. Point DB27 is a typicallixisolof the Dom Bosco stationhollow, whereas point DB10 has a transition behavior toferralsol, because it is situated in the external limit of thehollow. The superficial soil horizons at these points yielded contrasting hydraulic conductivity values, in the following order: H03>H18>DB10>DB27 (Morais & Bacellar, 2006).
In order to monitor infiltration and percolation, water satura-ted in NaCl was injecsatura-ted in each point using a 15 cm diameter cylinder under 30 cm hydraulic load (flooded condition). A total of 40 liters of saturated NaCl solution (∼0,05 ohm.m) were
injec-ted for a period of 24 hours, except at point DB27, where the soils are less permeable and only 20 liters could be injected during the same period.
118
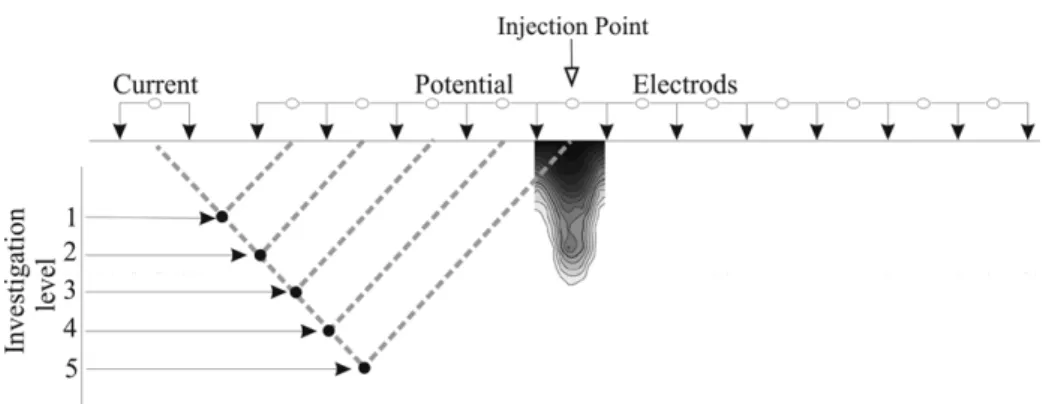
STUDY OF FLOW IN VADOSE ZONE FROM ELECTRICAL RESISTIVITY SURVEYSFigure 2– Configuration of the dipole-dipole array and saline solution injection points.
according to dipole-dipole array, totaling 5 investigation levels (Fig. 2). The saline solution injection point was located in the center of the line.
Before the injection of the saline solution, a preliminary sur-vey was carried out at each point, in order to obtain electric re-sistivity values for natural conditions (background) to be compa-red with the following surveys. After the injection of the solution, sections were obtained at certain time intervals, the first in the same day, one hour after the beginning of the injection, and the others 1, 8, 11 and 26 days later.
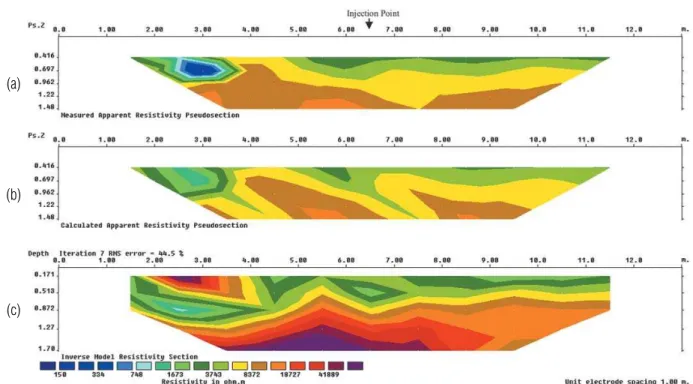
The apparent resistivity values obtained in the field were treated by means of the softwareRES2DINV, which transforms in quantitative data the qualitative positioning supplied by the pseudo-depth sections. Such transformation corresponds to mathematical inversions resultant from the application of the minimum-square smoothing method (Loke & Barker, 1996). According to Samou¨elian et al. (2003), inversion takes place in three stages: firstly, the field data constitute a pseudo-section; secondly, the data are calculated, and thirdly, adjustments are made between the measures and calculated data in order to re-duce the differences between them, yielding a result closer to real (Fig. 3). The calculation of these differences is by root mean square error (RMS error, Eq. 4).
R M S E=
1
n
n
i=1
(ρc−ρm)2 (4)
where:
ρc is the calculated apparent resistivity;
ρm is the measured resistivity; n is the number of points surveyed.
Loke & Barker (1996) showed that from five iterations the er-ror percentage tends to stabilize; therefore, the data were inverted with seven 7 iterations.
RESULTS AND DISCUSSION
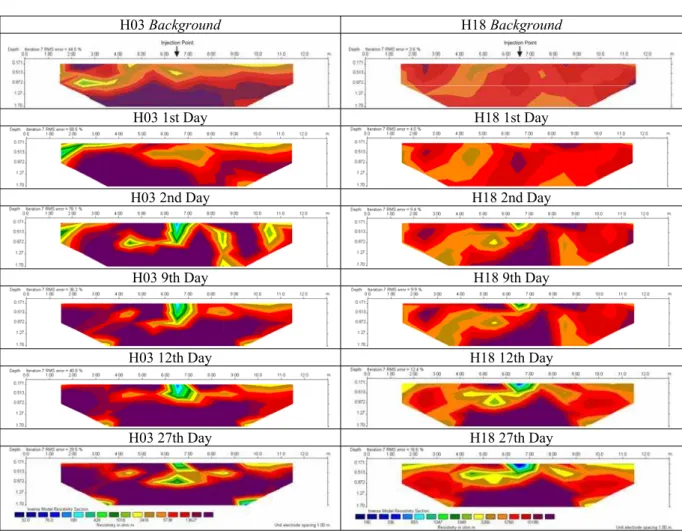
Figures 4 and 5 represent the sections with the resistivity in-version models for the points of the Dom Bosco and Holanda stations, respectively.
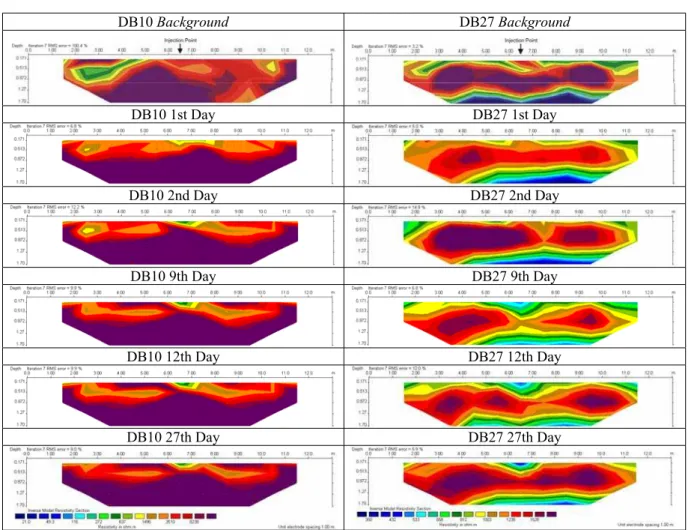
The resistivity values, measured before injection of the sa-line solution, define thebackground intervals between 21-9,931; 482-1,628; 122-16,100 and 3,796-11,181.m. for the profiles centered at points DB10, DB27, H3 and H18, respectively (Figs. 4 and 5). Thus, lower values in the following surveys would repre-sent anomalies associated with the presence of saline solution.
Point DB27 (Fig. 4) exhibits lower resistivity values, due to its position inside thehollow, which is a more humid area subject to a natural convergence of superficial and sub-superficial flows (Coelho Netto, 1998). The low resistivity values (350-658.m) at the fifth survey level correspond to a less deep water table at this point. Values higher than 1,528.m between the second and the forth levels can be attributed to the less porous, less per-meable soil horizon (textural B horizon), starting at a 0.6-m depth (Morais & Bacellar, 2006).
The highest resistivity values (5,738-21,000 .m) found from the third survey level at point H03 are explained by the con-siderable abundance of rock fragments in thecambic horizon or by underlying altered rock crosscut by fractures. These electric resistivity values agree with those typical of gneisses, which vary from 6.8×10⁴to 3.0×106.m, depending on the moisture content (Telford et al., 1990). Bacellar (2000), on the other hand, related resistivity values less than 6,000.m to the saprolites of the area, while higher values were associated with fresh rock.
The values obtained for the salt-saturated area are those found between the electrodes 6 and 7 m of the sections, with apparent resistivity values of<1,500; <1,003; <2,416 and
dis-(a)
(b)
(c)
Figure 3– Hypothetical sections elaborated during the mathematical inversion process. (a) field section; (b) calculated section; (c) inverted section.
tinguishable from the second day on, at points DB10, H03 and H18, and on the 9th day at point DB27.
From the low resistivity values corresponding to the percola-tion of the saline solupercola-tion, it is possible to observe that the vertical flow was faster at the Holanda station soils than in those of the Dom Bosco station (Figs. 4 and 5). These variations corroborate and reinforce Morais & Bacellar’s (2006) hypothesis, which sta-tes that in thehollows (Dom Bosco station) percolation is slower than in thenoses(Holanda station), due to lower hydraulic con-ductivity values of the superficial horizons.
The vertical flow velocity at point H03 was higher (Fig. 5), which is explained by the high hydraulic conductivity values in thecambic horizon. At point H18 the vertical flow velocity was smaller, despite a significant oblique flow (between electrodes 4 and 6, after the 2nd day of the experiment – Fig. 5). At point DB10 the vertical flow velocity was even lower. Although not as evident as at point H18, a reduction of the resistivity oblique to the injection point (between electrodes 3 and 6 and 7 and 10, after the 2nd day of the experiment – Fig. 5) was also obser-ved. In the trenches dug after the experiments, it was verified that this oblique flow could have followed cavities made by ants and termites. It is worth mentioning that the soils of points DB10 and H18 have high clay contents (Morais & Bacellar, 2006), thus keeping these cavities open by cohesion.
Comparisons with point DB27 are more difficult, because at this point half of the volume of saline solution was introduced, due to the lower hydraulic conductivity of the soils. It is verified, however, that the rate between the width of the lateral flow and the depth of the vertical flow is lower at this point than in other points, which agrees with the more impermeabletextural B ho-rizon atca. 60 cm. Therefore for this point located inside the
hollow, the possibility of generation of shallow sub-superficial flows is higher.
As in other studies (Hagrey & Michaelsen, 1999; Neves, 2002), in this work the electrical resistivity method proved effi-cient for studies of the water flow in vadose zones. It is worth stressing out that, due to the small number of electrodes availa-ble, the electrodes were removed after each experiment and repla-ced at the same site for the next survey. This prorepla-cedure did not interfere with the results obtained.
CONCLUSIONS
With the objective of evaluating infiltration and percolation in su-perficial soil horizons, multitemporal electric resistivity sections were obtained for each point of both study areas.
120
STUDY OF FLOW IN VADOSE ZONE FROM ELECTRICAL RESISTIVITY SURVEYSDB10 DB27
DB10 1st Day DB27 1st Day
DB10 2nd Day DB27 2nd Day
DB10 9th Day DB27 9th Day
DB10 12th Day DB27 12th Day
DB10 27th Day DB27 27th Day
Figure 4– Multitemporal inversion-model resistivity sections at Dom Bosco station.
and the results obtained agree with the hydraulic conductivity values of their horizons.
The presence of macropores of biologic origin significantly influences percolation. Previous results that showed that perco-lation is faster in more developed soils of thenose than in those of thehollowwere also confirmed, which would make these areas more favorable for aquifer recharge.
ACKNOWLEDGEMENTS
We wish to thank FAPEMIG for the financial support to this work (project TEC-760/05). The first author is grateful to CAPES for the D.Sc. scholarship.
REFERENCES
ACWORTH RI, YOUNG RR & BERNADI AL. 2005. Monitoring soil moisture status in a Black Vertosol on the Liverpool Plains, NSW, using a combination of neutron scattering and electrical image methods.
Australian Journal of Soil Research, 43: 105–117.
BACELLAR LAP. 2000. Condicionantes Geol´ogicos, Geomorfol´ogicos e Geot´ecnicos dos mecanismos de voc¸orocamento na Bacia do Rio Maracuj´a, Ouro Preto, MG. D.Sc. Thesis COPPE, Federal University of Rio de Janeiro, Brazil. 226 p.
COELHO NETTO AL. 1998. Hidrologia de encosta na interface com a geomorfologia. In: GUERRA AJT & CUNHA SB (Ed.). Geomorfolo-gia – Uma atualizac¸˜ao de bases e conceitos. Bertrand, Rio de Janeiro, ISBN 85-286-0326-1. p. 93–148.
DAILY W, RAMIREZ A, LABRECQUE D & NITAO J. 1992. Electrical resis-tivity tomography of vadose water movement. Water Resource Research, 28(5): 1429–1442.
DEPOUNTIS N, HARRIS C, DAVIES MCR, KOUKIS G & SABATAKAKIS N. 2005. Application of electrical imaging to leachate plume evolution studies under in-situ and model conditions. Environmental Geology, 47: 907–914.
develop-H03 H18
H03 1st Day H18 1st Day
H03 2nd Day H18 2nd Day
H03 9th Day H18 9th Day
H03 12th Day H18 12th Day
H03 27th Day H18 27th Day
Figure 5– Multitemporal inversion-model resistivity sections at Holanda station.
ment of the Quadril´atero Ferr´ıfero, Minas Gerais, Brazil. U.S. Geological Survey Professional Paper, 641-A: 110 p.
FARIAS CA. 1992. Dinˆamica da revegetac¸˜ao natural de voc¸orocas na regi˜ao de Cachoeira do Campo, MG. MSc. Thesis, Federal University of Vic¸osa, Brazil. 63 p.
FUTAI MM. 2002. Estudo te´orico-experimental do comportamento de solos tropicais n˜ao-saturados: Aplicac¸˜ao a um caso de voc¸orocamento. D.Sc. Thesis COPPE, Federal University of Rio de Janeiro, Brazil. 559 p.
HACK JT & GOODLET JG. 1960. Geomorphology and forest ecology of a mountain region in the Central Appalachians. U.S. Geological Survey Professional Paper, 347: 66p.
HAGREY SA & MICHAELSEN J. 1999. Resistivity and percolation study of preferential flow vadose zone at Bokhorst, Germany. Geophysics, 64(3): 746–753.
LIMA OAL, SATO HK & PORSANI MJ. 1995. Imaging industrial contami-nant plumes with resistivity techniques. Journal of Applied Geophysics, 34: 93–108.
LOKE MH & BARKER RD. 1996. Rapid least-squares inversion of appa-rent resistivity pseudosections by a quasi-Newton method. Geophysical Prospecting, 44: 131–152.
MORAIS F. 2003. Estudo dos Processos Erosivos Subsuperficiais na Bacia do Rio Maracuj´a – MG. MSc. Thesis, Federal University of Ouro Preto, Brazil. 98 p.
MORAIS F & BACELLAR LAP. 2006. An´alise dos fatores intervenientes na condutividade hidr´aulica dos horizontes superficiais de solos de ´areas gn´aissicas do complexo Bac¸˜ao – MG. Solos e Rochas, 29(1): 89–101.
MUKHTAR AL, SULAIMAN WN, IBRAHIM S, LATIF PA & HANAFI MM. 2000. Detection of groundwater pollution using resistivity imaging at Seri Petaling landfill, Malaysia. Journal of Environmental Hydrology, 8: 1–7.
NASCIMENTO CTC, KOIDE S, PIRES ACB & MELLO GA. 1999. Pseudo-sec¸˜oes el´etricas na avaliac¸˜ao da contaminac¸˜ao do subsolo. Revista Bra-sileira de Geociˆencias, 29(4): 621–626.
122
STUDY OF FLOW IN VADOSE ZONE FROM ELECTRICAL RESISTIVITY SURVEYShidrogeol´ogica da subsuperf´ıcie rasa em ´area de deposic¸˜ao de rejeitos s´olidos no munic´ıpio de Barcarena – PA. MSc. Thesis, Federal Univer-sity of Par´a, Brazil. 50 p.
ORELLANA E. 1972. Prospecci´on geoel´ectrica en corriente continua. Ed. Paraninfo, 523p.
PARK S. 1998. Fluid migration in the vadose zone from 3-D inversion of resistivity monitoring data. Geophysics, 63(1): 41–51.
PARZANESE GAC. 1991. Gˆenese e desenvolvimento de voc¸orocas em solos originados de rochas granit´oides na regi˜ao de Cachoeira do Campo, Minas Gerais. MSc. Thesis, Federal University of Vic¸osa, Brazil. 117 p.
SAMOU¨ELIAN A, COUSIN I, RICHARD G, TABBAGH A & BRUAND A. 2003. Electrical resistivity imaging for detecting soil cracking at the
cen-timetric scale. Soil Science Society America Journal, 67(5): 1319–1326.
SANTOS CA. 2001. Comportamento Hidrol´ogico Superficial, Subsu-perficial e a Erodibilidade dos solos da regi˜ao de Santo Antˆonio do Leite, distrito de Ouro Preto – MG. MSc. Thesis, Federal University of Ouro Preto, Brazil. 108 p.
SILVA TRM. 2000. Caracterizac¸˜ao e erodibilidade dos solos de uma voc¸oroca na regi˜ao de Ouro Preto – MG. MSc. Thesis, Federal University of Rio de Janeiro, Brazil. 106 p.
SOBREIRA FG. 2000. Processos erosivos acelerados (voc¸orocas): O exemplo de Cachoeira do Campo, Ouro Preto, MG. Solos e Rochas, 23(3): 217–233.
TELFORD WM, GELDART LP & SHERIFF RE. 1990. Applied Geophysics. Cambridge University Press, 770 p.
NOTES ABOUT THE AUTHORS
Fernando de Morais.Graduated in Geography, Federal University of Tocantins (2001). MSc (2003) and PhD (2007) in Natural Sciences, Federal University of Ouro Preto. Visiting Researcher (2007) at Centro de Tecnologia Mineral – CETEM, Rio de Janeiro, RJ. Professor at Federal University of Tocantins since 2008.
Luis de Almeida Prado Bacellar.Graduated in Geology (1985) by University of S˜ao Paulo (USP). MSc in Structural Geology, Federal University of Ouro Preto (1987) and DSc in Environmental Geotechnics, COPPE/UFRJ (2000). Worked as a Geologist at ABCP – Brazilian Portland Cement Association (1985/1987) and at PETROBRAS (1989/2004). Since 2004 professor at the Geology Department of the School of Mines, Federal University of Ouro Preto.