Soil structure degradation in patches of alfalfa fields
María Celeste Miretti
1; Silvia Imhoff
1*; Alvaro Pires da Silva
2; Raúl Lavado
31
UNL/FCA/CONICET – Depto. Ciencias del Ambiente, Kreder 2805 – S3080HOF – Esperanza, Argentina. 2
USP/ESALQ – Depto. Ciência do Solo, C.P. 9 – 13418-900 – Piracicaba, SP – Brasil. 3
UBA/FA/CONICET – Depto. Ing. Agrícola y Uso de la Tierra, Av. San Martín 4453 – C1417DSE – Buenos Aires, Argentina.
*Corresponding author <[email protected]>
ABSTRACT: Alfalfa (Medicago sativa) is the basic forage resource for milk production in the flat Pampa of the Santa Fe Province of Argentina. However, the presence of microrelief with patches threatens the expansion of the area cultivated with alfalfa. The lower productivity in the patches is attributed to the inferior soil physical quality. The objectives of this study were to quantify indicators of soil physical quality and to establish the soil properties that would affect the alfalfa productivity in patches (PA) and normal areas (NA). Additionally, the macro and micro nutrient contents in both areas were determined. The experiment was carried out on an Aquic Argiudoll. Eighteen sampling sites, nine in NA and nine in PA were established. At each site, undisturbed soil samples (5 × 5 cm cores) were collected to measure soil bulk density (Bd), soil resistance to root penetration (PR), effective stress (σ), the water release curve and the least limiting water range (LLWR). Disturbed soil samples were also taken to determine macro and micronutrient contents, and particle size distribution. Non differences were detected for soil chemical properties between PA and NA. Aggregate size distribution indicated predominance of small aggregates in PA. Bd, PR and s were higher in PA than in NA, while the LLWR was narrower. Inadequate aeration under conditions of excessive soil moisture and inappropriate soil mechanical resistance when the soil is dry would affect alfalfa productivity. The overall results indicate that the soil physical quality in PA is lower than in NA.
Key words: soil physical properties, soil nutrient content, alfalfa growth
Degradação da estrutura do solo em “patches” em pastagens de alfafa
RESUMO: A alfafa (Medicago sativa) é a pastagem básica na produção de leite na Pampa plana da Província de Santa Fe da Argentina. Entretanto, a presença de microrelevo com “patches” (áreas de menor produção) ameaça a expansão da cultura. A menor produtividade nos “patches” foi atribuída â inferior qualidade física do solo. Avaliaram-se indicadores de qualidade física do solo e estabeleceram-se as propriedades do solo que podem afetar a produtividade da alfafa nos patches (PA) e nas áreas normais (NA). Adicionalmente, os conteúdos de macro e micronutrientes foram determinados nas duas áreas. O experimento foi conduzido numa fazenda com solo Argiudol áquico. Dezoito pontos de amostragem foram estabelecidos, nove em PA e nove em NA. Em cada ponto foram coletadas amostras não perturbadas (5 × 5 cm) para a determinação da densidade do solo (Ds), resistência do solo à penetração das raízes (RP), estresse efetivo (σ), curva de retenção de água e intervalo hídrico ótimo (IHO). Amostras perturbadas foram coletadas para avaliar o conteúdo de macro e micronutrientes, e a distribuição de partículas por tamanho. Não foram encontradas diferenças nas propriedades químicas entre PA e NA. Existe predomínio de agregados pequenos em PA, e a Ds, RP e s atingiram valores mais elevados em PA, enquanto o IHO foi mais estreito. Inadequada aeração em condições de excessiva umidade do solo e elevada resistência mecânica em condições de secamento poderão afetar a produtividade da alfafa. Os resultados indicam que a qualidade física do solo em PA é inferior que em NA.
Palavras-chave: propriedades físicas do solo, conteúdo de nutrientes, crescimento de alfafa
Introduction
Milk production in the flat Pampa of Santa Fe Prov-ince, Argentina, is characterized by the permanence of animals at the fields and the by use of a short-duration grazing system with alfalfa (Medicago sativa) due to its high dry matter yield and good nutritional quality (Comeron and Romero, 2007; Juan et al., 1995). None-theless, the presence of sectors with lower plant devel-opment in the fields threatens the expansion of the cul-tivated areas with alfalfa. These sectors are known as
“patches” and are associated to other sectors
consid-ered “normal”, where alfalfa presents much better growth.
Soil degradation is a common process especially in flat areas where soils are intensively cultivated or grazed (Hamza and Anderson, 2005; Harrison et al., 1994; Mapfumo et al., 1998; Taboada et al., 1998a; Taboada et al., 1999). Degradation was associated with changes in soil bulk density, aggregate size distribution, soil resis-tance to root penetration, water and oxygen availabil-ity, and as a consequence, appears the decrease in crop productivity (Masle, 1998; Masle and Passioura, 1987; Passioura, 1988; Veen and Boone, 1990).
The hypothesis underlying this investigation is that soil conditions in patches is more restrictive for alfalfa growth than in normal areas, which determines the lower productivity even when similar chemical condi-tions exist in both areas. Therefore, the objectives of this study were to: i) quantify indicators of soil physical qual-ity in patches and normal areas of an alfalfa pasture; ii) determine macro and micro nutrient contents; iii) estab-lish which soil properties would affect alfalfa produc-tivity in both areas.
Material and Methods
The experiment was carried out in a plot cultivated with alfalfa, located in Humboldt (31°42’ S; 61°03’ W), Province of Santa Fe (Argentina). The climate of the re-gion is mesothermic subhumid-humid (C2B’3ra’) accord-ing to the Thornthwaite classification (Mosconi et al., 1981), with annual isohyets varying from 800 to 1000 mm. The landscape is predominantly flat with small de-pressed microrelief (from 4 to 8 m in diameter). The soil is from the Humboltd series, an Aquic Argiudoll, with 70 g kg–1 sand, 700 g kg-1 silt, and 230 g kg–1 clay.
Eighteen sites were selected and sampled, nine in ¨normal¨ areas (NA) and nine in ¨patches¨ (PA), which were mainly located in depressed microreliefs. In each site composite disturbed samples were collected at 0 -10 and -10 - 20 cm depths. Samples were air-dried and passed through a 2.0 mm sieve for analyses. The follow-ing determinations were made: pH (in Cl2Ca 0.01M), particle size distribution, organic matter (OM) (through oxidation with a potassium dichromate solution), ex-tractable phosphorous (P), exchangeable potassium (K+),
calcium (Ca2+), magnesium (Mg2+), aluminium (Al+3),
H++AL+3 (extracted through ion exchange resin), sul-phur expressed as sulphate (S-SO42-) (turbidimetric
deter-mination), boron (B), copper (Cu), zinc (Zn), manganese (Mn), iron (Fe) determined as described by van Raij (1998).
Soil samples were taken with a trowel shovel to de-termine dry aggregate size distribution (Perfect et al., 2002). Samples (1,000 g) were air-dried for 36 h and al-lowed to fall from a 3 m height to simulate tilling. Next, they were passed through a 16 mm mesh sieve to sepa-rate larger size material, which was discarded. Each sample, made up of aggregates smaller than 16 mm, was placed on a nest of flat sieves (sized 11.1; 7.93; 6.35; 4; 2; 1 and 0.5 mm) and shaken for 1 min in order to obtain aggregate mechanical separation. The material retained
in each sieve was weighed and its mass was corrected for soil mass dried in an oven at 105ºC. Aggregate size distribution was determined from these data and the geometric mean diameter (GMD) was calculated accord-ing to the methodology described by White (1993):
GMD =∑n
i=1 xi * Wi (1)
where: xi is the mean diameter of the ith fraction, which
corresponds to the average point between the sieve mesh in which the sample had been retained and the one im-mediately above, Wi is the proportion of the total sample retained in that sieve.
Undisturbed soil samples (n = 54; nine sites × six water potentials in NA, and n = 54 in PA) were col-lected with cores (5 cm height × 5 cm diameter) in the soil surface horizon(3-8 cm). Samples were saturated by gradually increasing the level of water in a tray, weighed to obtain the water content at saturation, and then equili-brated to the following matric potentials (ψ): -0.004 and -0.01 MPa on a tension table and -0.03, -0.1, -0.5, and -1.5 MPa in a Richard’s pressure chamber (Klute, 1986). Af-ter equilibration, samples were weighed and soil resis-tance (PR) was measured at a constant rate (1.0 cm min-1)
using an electronic penetrometer with a cone of 4 mm basal diameter and angle of 60º. Readings obtained be-tween 1 and 4 cm depth were averaged to obtain a single PR value. Next, samples were oven-dried at 105°C to de-termine the gravimetric water content and the soil bulk density (Bd) (Blake and Hartge, 1986). Then, the volu-metric water content was calculated to elaborate the water release curve(WRC, θ = f ψ) for NA and PA.
Effective stress was estimated as the product between relative saturation and matric potential (from 0 to -100 kPa) in absolute value, using the equation for unsatur-ated soils (Mullins and Panayiotopoulos, 1984):
σ=θRS*⏐ψ⏐ (2)
where: σ is effective stress (kPa); θRS is relative satura-tion (ratio between soil volumetric water content at the applied potential and soil water content at saturation;
θRS= θ/θs);⏐ψ⏐ is the absolute value of soil matric
poten-tial (kPa).
The ratio between effective stress and PR was estab-lished adjusting the following linear model (equation 3):
PR = a + b*σ (3)
where: a and b are the model parameters.
Data of WRC were adjusted to the model proposed by van Genuchten (1980) (equation 4):
θ = θr + (θs - θr) / [1 + (αψ)n]1/n (4)
where: θr = residual water content (cm3 cm–3), θs =
wa-ter content at saturation (cm3 cm–3), and α, n are fitting
parameters.
PR = a * θb * Bd c (5)
where: a, b, c are fitting parameters. The LLWR was cal-culated according to Silva et al. (1994) for each Bd. Wa-ter contents corresponding to field capacity (θFC) and per-manent wilting point (θPWP) were obtained from equa-tion (4) for ψ = -0.01 MPa and ψ = -1.5 MPa, respec-tively. Equation (5) was used to determine the soil wa-ter content (θPR) at which PR = 3.5 MPa. This PR value is considered restrictive for alfalfa normal root growth (Materechera et al., 1991). Soil water content (θAFP) at which air-filled porosity is 15%, a value considered ad-equate for sensitive crops like alfalfa (Kay et al., 2006),
was determined by equation 6:
θAFP = [(1-Bd/Pd) – 0.15] (6)
where: Pd = soil particle density (Mg m–3).
Soil particle density was measured with a picnom-eter of helium. The Pd value was equal to 2.58 Mg m–3.
Descriptive statistics and variance analyses of chemi-cal data (pH, organic matter, macronutrients, micronu-trients) were carried out using SAS Institute (1991). Pa-rameter comparison of equation 3 for NA and PA was made by applying the t test according to Steel and Torrie (1997). Adjustment of data related to soil resistance, wa-ter retention and LLWR was performed with non lin-ear regression using the program developed by Leão et al. (2004) and SAS Institute (1991).
Results and Discussion
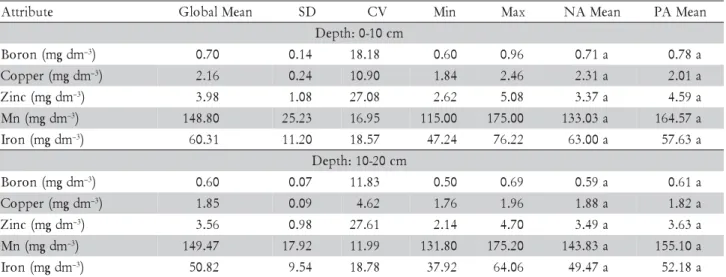
Mean values of pH, organic matter (OM), macro- and micronutrients for normal (NA) and patches (PA) areas (Tables 1 and 2) did not indicate differences for the soil chemical properties between the two areas. Besides, all val-ues are within the nutrient sufficiencyrange. Moreover, some of them (Mn, Cu, Zn, Fe) show high values, without reaching toxic levels (Diaz Zorita and Gambaudo, 2007). Thus, differences in soil chemical fertility can not be con-sidered the reason for alfalfa lower productivity in patches. Mean values and coefficients of variation (CV) of Bd were 1.30 Mg m–3 and 6% for NA, and 1.32 Mg m–3 and
4% for PA, indicating that the soil in patches is less het-erogeneous. Average PR is lightly higher in PA (2.7 MPa) than in NA (2.5 MPa). The high CV values (PA = 69%, NA = 61%) are due to the soil moisture gradient imposed on samples to obtain PR curves. The geomet-ric mean diameter (GMD) values were 7.6 and 6.6 mm for NA and PA, respectively, showing differences (F = 7.51; p < 0.01). Nonetheless, both values are within the range of size (2-10 mm) considered adequate for ion movement and mechanically not limiting for root growth (Braunack and Dexter, 1989b; Tisdall and Oades, 1982). However, the adequate aggregate size depends on texture, soil water content and the capacity of the spe-cies to undergo critical conditions (Braunack and Dex-ter 1989a; Braunack and DexDex-ter, 1989b).
SD=Standard deviation; CV=Coefficient of variation; Min=Minimum; Max=Maximum; O.M. = Soil organic matter; P=Phosphorus; S=Sulphur; K=Potassium; Ca=Calcium; Mg=Magnesium; H=Hydrogen; Al=Aluminum; NA= Normal area; PA= Patches. Within a given soil property same letters are not different (p > 0.05), n = 6.
e t u b i r t t
A GlobalMean SD CV Min Max NAMean PAMean
m c 0 1 -0 : h t p e D l
C a C H
p 2 5.8 0.1 1.5 5.7 5.9 5.8a 5.7a
m d g ( . M .
O –3) 28.5 4.3 15.1 22.3 32.6 27.8a 29.1a
m d g m (
P –3) 52.4 14.3 27.3 31.2 69.3 59.2a 45.7a
m d g m (
S –3) 10.9 0.9 8.3 9.7 12.2 10.6a 11.2a
l o m m (
K cdm–3) 12 1.2 9.9 9.9 13.2 12.6a 11.7a
l o m m ( a
C cdm-–3) 67 7 10.4 57 74 69a 65a
l o m m ( g
M cdm-–3) 23.3 6.2 26.7 17 34 27.7a 19a
l o m m ( l A +
H cdm–3) 24.8 2.6 10.6 22 29 24.3a 25.3a
l o m m ( l
A cdm–3) 1.00 0.15 15.49 0.9 1.30 1.07a 0.93a
m c 0 2 -0 1 : h t p e D l
C a C H
p 2 5.6 0 0.5 5.6 5.7 5.6a 5.7a
m d g ( . M .
O –3) 30.9 4.1 13.4 25.1 37.2 27.9a 33.8a
m d g m (
P –3) 28.1 10.7 38 14.7 43.8 25.1a 31a
m d g m (
S –3) 15.1 7.7 51.1 8.8 29.9 13.9a 16.2a
l o m m (
K cdm–3) 10.8 1 9.1 9.6 12.4 11.1a 10.4a
l o m m ( a
C cdm-–3) 63.7 3.9 6.2 56 67 65a 62.3a
l o m m ( g
M cdm–3) 19.2 2.1 11.2 17 22 20a 18.3a
Soil aggregate size distribution indicated little differ-ence between areas. Nevertheless, a differdiffer-ence was found (F = 7.38; p < 0.01) for the fraction smaller than 1 mm, proportionally larger in PA than in NA. Predominance of small aggregates has been associated to conditions of poor aeration, greater pore tortuosity and high mechani-cal resistance, factors that may limit crop development (Hoffmann and Jungk, 1995). As the proportion of small size aggregates and soil bulk density increase, particle contact also increases. Similarly, soil drying promotes particlecontact as well as the formation of new connec-tions among them and among soil micro-aggregates which, in turn, increase the water retention energy of the soil matrix. This process, known as effective stress, is responsible for increasing soil resistance to root pen-etration (Mullins and Panayiotopoulos, 1984).
Penetration resistance and effective stress relations are shown in Figure 1 for PA and NA. A positive and linear relation between both variables is verified in the 0 to -100 kPa matric potential range, within the measured range. Effective stress accounted for 83 and 60% of the total variability in PR for PA and NA, respectively. Sev-eral researchers have mentioned that effective stress is the main reason of high values of soil resistance to root penetration (Giarola et al., 2003; To and Kay, 2005; Whalley et al., 2005).
The “a” coefficient (Equation 3) did not differ be-tween PA and NA (t = 1.441; p = 0.153). This coeffi-cient is related to soil particle cohesion, which is mainly produced by aggregating agents, such as organic sub-stances, silicon and iron in its poor crystalline forms (Vepraskas, 1984). Both areas present similar texture and similar OM contents besides, being separated by very small distances. These conditions justify the lack of dif-ference in the “a” coefficient. The “b” coefficient (Equa-tion 3) was different in PA and NA (t = 3.331; p = 0.001). The increase in soil mechanical resistance associated to
the increase in effective stress was higher in PA. Patches are mainly located in depressed micro-reliefs. As a re-sult, the soil receives water from rain and from surround-ing areas (NA). This greater water flow may contribute to break down macro-aggregates into small aggregates and loose material as well as to rearrange fine particles, modifying pore size distribution. These conditions fa-vor particle contact and the formation of small capillary pores, which determine that water menisci bind par-ticles together strongly when soil is wet. On the other hand, when soil becomes dry, interparticle friction in-creases, increasing soil mechanical resistance (Vepraskas, 1984). Similar results were found by Vepraskas (1984) and Giarola et al. (2003).
High values of mechanical resistance in soils of the Rolling Pampas were also found by Alvarez et al. (2009). These high values were attributed to fine particle orga-nization that results from soil hardening (Taboada et al., 1998a). This process becames more important in silty soils of the Argentinean Pampas because of the particu-lar shape and origin of the silt particles, mainly e
t u b i r t t
A GlobalMean SD CV Min Max NAMean PAMean
m c 0 1 -0 : h t p e D m
d g m ( n o r o
B –3) 0.70 0.14 18.18 0.60 0.96 0.71a 0.78a
m d g m ( r e p p o
C –3) 2.16 0.24 10.90 1.84 2.46 2.31a 2.01a
m d g m ( c n i
Z –3) 3.98 1.08 27.08 2.62 5.08 3.37a 4.59a
m d g m ( n
M –3) 148.80 25.23 16.95 115.00 175.00 133.03a 164.57a
m d g m ( n o r
I –3) 60.31 11.20 18.57 47.24 76.22 63.00a 57.63a
m c 0 2 -0 1 : h t p e D m
d g m ( n o r o
B –3) 0.60 0.07 11.83 0.50 0.69 0.59a 0.61a
m d g m ( r e p p o
C –3) 1.85 0.09 4.62 1.76 1.96 1.88a 1.82a
m d g m ( c n i
Z –3) 3.56 0.98 27.61 2.14 4.70 3.49a 3.63a
m d g m ( n
M –3) 149.47 17.92 11.99 131.80 175.20 143.83a 155.10a
m d g m ( n o r
I –3) 50.82 9.54 18.78 37.92 64.06 49.47a 52.18a
Table 2 – Descriptive statistic for soil micronutrients of an Aquic Argiudoll in Central region of Santa Fe Province (Argentina), for two depths.
SD = Standard deviation; CV=Coefficient of variation; Min=Minimum; Max=Maximum; Mn=Manganese. NA= Normal area; PA= Patches. Within a given soil property same letters are not t different (p > 0.05), n = 6.
Figure 1 – Soil penetration resistance (PR) versus effective stress (σ) in Normal areas and Patches of the alfalfa pasture.
y = 0.0479x + 1.05 R² = 0.60 y = 0.1285x + 0.5556
R² = 0.83
0 1 2 3 4 5 6 7 8 9
0 5 10 15 20 25 30 35 40 45 50 55 60
PR
(
M
P
a
)
σ (kPa) Normal areas
phytoliths (Cosentino and Pecorari, 2002). Moreover, this material was associated to the structural instability of Argiudolls by Sasal et al. (2006) and Taboada et al. (2008). The coefficientsof thePR model (equation 5) for PA and NA (Table 3) were all statistically significant since the confidence interval does not include the 0 (zero) value (Glantz and Slinker, 1990). PR was negatively af-fected by soil water content and positively by Bd, then corroborating to the assumption of equation 3. In both cases, PR was less conditioned by the former than by the later, suggesting that soil compaction has more im-pact than soil drying in reaching critical values of soil resistance. PR behavior with respect to Bd and θ is in agreement with the findings of Leão et al. (2006), Silva et al. (1994); Tormena et al. (1999). The fitted model ex-plained 85% and 90% of data for PA and NA, respec-tively. The value of water content in which PR=3.5 MPa, calculated for the mean Bd value, is greater in PA (0.26 m3 m–3) than in NA (0.24 m3 m–3). This implies that
in PA the soil must remain wetter for plant growth not to be affected by soil mechanical resistance.
Adjustment coefficients of the soil water release curve (equation 4) for patches and normal areas are pre-sented in Table 4. The model accounted for 99% of the data variability for both areas. θFC value, calculated with the model corresponding to each area, is slightly higher in NA than in PA, probably due to differences in par-ticle organization as suggested by the b coefficient of equation 3. θPWP values do not present differences be-tween areas, which was expected since θPWP mainly de-pends on soil texture and both areas are of the same soil. Soil water contents setting the LLWR limits for each measured Bd are shown in Figures 2 and 3 for NA and PA, respectively. Bd increase is associated to an increase in θPR and a decrease in θAFP in both areas, but it did not affect the θFC and θPWP values. Similar results were found by Zou et al. (2001) for soils of similar particle size dis-tribution. θPR was the lower LLWR limit in both areas,
indicating that alfalfagrowth will be affected by the high soil resistance before soil water content reaches the per-manent wilting point. Nonetheless, the PR effect is more severe in PA, which is denoted by the largeslope of the straight line. Stirzaker et al. (1986) indicated that in hard soils, water and nutrient absorption can become limit-ing due to the root difficulty to penetrate the soil, de-spite the fact of having adequate chemical fertility.
For PA, θAFP replaces θFC as the upper limit of the LLWR at Bd ≥ 1.26 Mg m–3, which corresponds to 93%
of all cases. For NA, aeration was the upper LLWR limit in 89% of all cases. Consequently, inadequate aeration will firstly affect root growth in PA. Oxygen deficiency originates severe damage to alfalfa predisposing plants to root infections by Phytophthora (Phytophthora
r e t e m a r a
P Value LL UL
) A N ( a e r a l a m r o N
a 0.0399 0.017 0.0627 b -2.0627 -2.3561 -1.7693
c 5.8355 4.65 7.021
) A P ( s e h c t a P
a 0.0484 0.016 0.0707 b -1.9927 -2.2448 -1.7407 c 5.6132 3.9435 7.2828
PR = Soil penetration resistance (MPa); θ = Water content (cm3 cm–3); Bd = Bulk density (Mg m–3); a, b, and c are parameters
of model. LL, UL = Lower and upper limit of the confidence interval of 95%. NA: F = 250.26; Pr>F <0.0001; R2 = 0.85;
PA: F = 363.89; Pr> F <0.0001; R2 = 0.90; n = 54.
Table 3 – Fitted parameters for the soil penetration resistance curve model in Normal areas and Patches of a pasture of alfalfa. PR = a*θb *Bdc
Figure 2 – Soil water content (θ) variation with soil bulk density (Bd) at the critical limits of field capacity (θFC= -0.01
MPa), permanet wilting point (θPWP=-1.5MPa), air
filled porosity of 15% (θAFP) and soil penetration
resistance (θPR of 3.5 MPa ) in Normal areas of a pasture
of alfalfa LLWR=least limiting water range. Bdc= critical soil bulk density (LLWR=0).
0.15 0.20 0.25 0.30 0.35 0.40 0.45
1.10 1.20 1.30 1.40 1.50
θ
( m
3m -3)
Bd (Mg m-3)
qRP qFC qPWP θqAFP
AFP
θPR
Bdc
θFC θPWP θθAFPAFP
θPR
Bdc
θFC θPWP θAFP
Table 4 – Fitted parameters for the water release curve model in Normal areas and Patches of a pasture of alfalfa. CRH: θ = θr + (θs - θr) / [1 + (αψ)n]1/n
θ = volumetric water content (cm3 cm–3); θ
s = saturated
volumetric water content (cm3 cm–3). θ
r = residual volumetric
water content (cm3 cm–3), it was assumed = 0; ψ = soil matric
potencial (kPa); α, n = fitted parameter for the water release curve (CRH). LL, UL= Lower and upper limit of the confidence interval of 95%. NA: F= 24649.9 ; Pr>F < 0.0001; R2 = 0.99;
PA: F = 25905.4; Pr>F < 0.0001; R2 = 0.99; n = 54. r
e t e m a r a
P Value LL UL
) A N ( a e r a l a m r o N
α 0.6466 0.5207 0.7725
n 1.1503 1.1442 1.1565
θs 0.50 0.4886 0.5024
) A P ( s e h c t a P
α 0.0484 0.016 0.0707
n -1.9927 -2.2448 -1.7407
megasperma f. sp. medicaginis) and delaying stem growth, apart from inducing premature senescence of leaves, nu-trient deficiency, and slowing down root growth (Zook et al., 1986).
The maximum amplitude of the LLWR was 0.168 m3
m–3 and 0.194 m3 m–3, in PA and NA, respectively. The small amplitude in PA suggests a more limiting soil en-vironment for root growth. Besides, it implies in a greater probability for plants to suffer stress during their growth cycle, especially in productive systems without irrigation (Silva and Kay, 1997). Critical soil bulk densi-ties (Bdc), i.e. Bd in which the LLWR=0, were 1.40 and 1.42 Mg m–3 for PA and NA. Bd values equal or greater
than Bdc indicate severe structural degradation of the soil (Leão et al., 2006). Its impact in biomass production is difficult to be predicted since plant growth is a dynamic process and different morphological and physiological adaptations take place when the environment becomes stressful. Nevertheless, authors agree that crop produc-tivity is reduced (Benjamin et al., 2003; Masle, 1998; Silva and Kay, 1997; Silva et al., 2004; Wheaton et al., 2008). The smaller value of Bdc in PA indicates that plants will grow under unsuitable conditions at a lower state of soil compaction.
Overall results indicate that the soil physical qual-ity in patches is lower than that of “normal” areas. In-adequate oxygen supply during periods of excessive soil moisture, and inappropriate soil mechanical resistance on periods of water deficit will exert a greater negative impact on alfalfa growth in PA than in NA. Alfalfa is currently grazed when plants are at the adequate phe-nological state in the normal areas since they occupy a greater surface in the field. As a consequence, plants in the patches are grazed before they reach the adequate moment. This fact does not allow them to accumulate enough amounts of reserves in their crown to endure sub-sequent regrowths. In this way, the intensive grazing
system and the characteristics of alfalfa growth may con-tribute to magnify the impact of soil properties that act as limiting factors, inducing anticipated plant death in patches.
Conclusions
There are only differences in soil physical prop-erties between normal areas and those considered patches. The soil from micro-relief with patches has an inferior physical quality, which imposes stressful conditions to plant growth. These conditions associ-ated to the particular alfalfa characteristics and those of the grazing system would be responsible for the lower productivity and longevity of the crop in patches.
References
Alvarez, C.; Taboada, MA.; Gutierrez Boem, F.; Bono, A.; Fernandez, P.; Prystupa, P. 2009. Topsoil properties as affected by tillage systems in the rolling Pampa region of Argentina.Soil Science Society of America Journal 73: 1242-1250.
Benjamin, J.G.; Nielsen, D.C.; Vigil, M.F. 2003. Quantifying effects of soil conditions on plant growth and crop production. Geoderma 116: 137-148.
Blake, G.R.; Hartge, K.H. 1986. Bulk density. p. 363–375. In: Klute, A., ed. Methods of soil analysis: physical and mineralogical methods. 2ed. American Society of Agronomy, Madison, WI, USA.
Bonadeo, E.; Hampp, E.R.; Bongiovanni, M.D.; Moreno, I.S.; Odorizzi. A. 2006. Relationships between soil physical and chemical properties and alfalfa (Medicago sativa L.) roots in patched soils. Ciencia del Suelo 24: 101-107. (In Spanish with abstract in English).
Braunack, M.V.; Dexter, A.R. 1989a. Soil aggregation in the seedbed: a review. I. Properties of aggregates and beds of aggregates. Soil and Tillage Research 14: 259-279.
Braunack, M.V.; Dexter, A.R. 1989b. Soil aggregation in the seedbed: a review. II. Effect of aggregate sizes on plant growth. Soil and Tillage Research 14: 281-298.
Busscher, W.J. 1990. Adjustment of flat-tipped penetrometer resistance data to a common water content. Transaction of the ASAE 33: 519-524.
Comeron, E.; Romero, L. 2007. Use of the alfalfa by milk cows during grazing. p. 303-331. In: Basigalup, D.H., ed. The alfalfa crop in Argentina. Ediciones INTA. Buenos Aires, Argentina. (in Spanish).
Cosentino, D.J.; Pecorari, C. 2002. Impact of low-density minerals on soil physical properties of soils of the Pampean region. Ciencia del Suelo 20: 9-16. (in Spanish with abstract in English). Diaz-Zorita, M.; Gambaudo, S. 2007. Fertilization and liming in alfalfa. p. 227-246. In: Basigalup, D.H., ed. The alfalfa crop in Argentina. Ediciones INTA, Buenos Aires, Argentina. (in Spanish).
Giarola, N.F.B.; Silva, A.P., Imhoff, S.; Dexter, A.R. 2003. Contribution of natural soil compaction on hardsetting behavior. Geoderma 113: 95-108.
Glantz, S.A.; Slinker, B.K. 1990. Primer of Applier Regression and Analysis of Variance. McGraw-Hill, New York, NY, USA. Hamza, MA.; Anderson, W.K. 2005. Soil compaction in cropping
systems: a review of the nature, causes and possible solutions. Soil and Tillage Research 82: 121-145.
Harrison, D.F.; Cameron, K.C.; McLaren, R.G. 1994. Effects of subsoil loosening on soil physical properties, plant root growth, and pasture yield. New Zealand Journal of Agricultural Research 37: 559-567.
Figure 3 – Soil water content (θ) variation with soil bulk density (Bd) at the critical limits of field capacity (θFC=-0.01
MPa), permanet wilting point (θPWP= -1.5MPa), air
filled porosity of 15% (θAFP) and soil penetration
resistance of 3.5 MPa (θPR) in the patches of a pasture
of alfalfa LLWR=least limiting water range. Bdc= critical soil bulk density (LLWR=0)
0.15 0.20 0.25 0.30 0.35 0.40 0.45
1.10 1.20 1.30 1.40 1.50
θ
(m
3m -3)
Bd (Mg m-3)
sr fc pmp afp
Bdc
Hoffmann, C.; Jungk, A. 1995. Growth and phosphorus supply of sugar beet as affected by soil compaction and water tension. Plant and Soil 176: 15-25.
Juan, N.; Romero, L.; Bruno, O. 1995. Conservation of the alfalfa grass. p. 173-192. In: Hijano, E.H.; NAVARRO, A., eds. The alfalfa in Argentina. Editar, San Juan, Argentina. (in Spanish). Kay, B.D.; Hajabbasi, M.A.; Ying, J.; Tollenaar, M. 2006. Optimun
versus non-limiting water contents for root growth, biomasa accumulation, gas exchange and the rate of development of maiz (Zea mays L.). Soil and Tillage Research 88: 42-54. Klute, A. 1986. Water retention: Laboratory Methods. chap. 26. p.
635-660. In: Klute, A., ed. Methods of soil analysis-physical and mineralogical methods. American Society of Agronomy. Madison, WI, USA.
Leão, T.P.; Silva, A.P.; Perfect, E.; Tormena C. 2005. A simplified Excel algoritm for estimating the least limiting water range for soil. Agronomy Journal 97: 1210-1215.
Leão, T.P.; Silva, A.P.; Macedo, M.C.M.; Imhoff, S.; Euclides, V.P.B. 2006. Least limiting water range: a potential indicator of changes in near-surface soil physical quality after the conversion of Brazilian Savanna into pasture. Soil and Tillage Research 88: 279-285.
Mapfumo, E.; Chanasyk, D.S.; Naeth, M.A.; Baron V.S. 1998. Forage growth and yield components as influenced by subsurface compaction. Agronomy Journal 90: 805-812.
Masle, J. 1998. Growth and stomatal responses of wheat seedlings to spatial and temporal variations in soil strength of bi-layered soils. Journal of Experimental Botany 49: 1245-1257.
Masle, J.; Passioura, J.B. 1987. The effect of soil strength on the growth of young wheat plants. Australian Journal of Plant Physiology 14: 643-656.
Materechera, S.A.; Dexter, A.R.; Alston, A.M. 1991. Penetration of very strong soils by seedling roots of different plant species. Plant and Soil 135: 31-41.
Mosconi, F.; Priano, L.; Moscatelli, G.; Salazar, J.L.; Gutierrez, T.; Caceres, L. 1981. Soil map of the province of Santa Fe. INTA-MAG, Santa Fe, Argentina. 246 p. (in Spanish) Mullins, C.E., Panayiotopoulos, K.P. 1984. The strength of
unsatured mixture of sand and kaolin and the concept of effective stress. Journal of Soil Science 35: 459-468.
Panigatti, J.L.; Piñeiro, A.; Mosconi, F.P. 1971. Patches in crops of the Central zone of Santa Fe. Revista de Investigaciones Agropecuarias 8: 141-154. (in Spanish).
Passioura, J.B. 1988. Root signals control leaf expansion in wheat seedlings growing in drying soil. Australian Journal of Plant Physiology 15: 687-693.
Perfect, E.; Díaz-Zorita, M.; Grove, J.H. 2002. A prefractal model for predicting soil fragment mass-size distributions. Soil and Tillage Research 64: 79-90.
Romero, L.A.; Giorgi R.E.; Tosolini, R.A.; Sapino, V.I.; Giailevra, D.C.; Zapatero, D.A.; Comerón, E.A. 2000. Losses in alfalfa pastures associated with water flooding. Revista Argentina de Producción Animal 20: 221-222. (in Spanish).
SAS Institute. 1991. SAS/STAT Procedure Guide for Personal Computers. 5ed. SAS Institute, Cary, NC, USA.
Sasal, M.C.; Andriulo, A.E.; Taboada, M.A. 2006. Soil porosity characteristics and water movement under zero tillage in silty soils in Argentinean Pampas. Soil and Tillage Research 87: 9-18. Silva, A.P.; Imhoff, S.; Kay, B.D. 2004. Plant response to mechanical resistance and air-filled porosity of soils under conventional and no-tillage. Scientia Agricola 61: 451-456.
Silva, A.P; Kay, B.D. 1997. Effect of soil content variation on the least limiting water range. Soil Science Society of America Journal 61: 884-888.
Silva, A.P.; Kay, B.D.; Perfect, E. 1994. Characterization of the least limiting water range of soils. Soil Science Society of America Journal 58: 1775-1781.
Steel, R.G.D; Torrie, J.H. 1997. Biostatistic: Principles and Procedures. McGraw-Hill, México City, México. (in Spanish). Stirzaker, R.J.; Passioura, J.B.; Wilms, Y. 1996. Soil structure and plant growth: impact of bulk density and biopores. Plant and Soil 185: 151-162.
Taboada, M.A.; Barbosa, O.A.; Cosentino, D.J. 2008. Null creation of air filled structural pores by soil cracking and shrinkage in silty loam soils. Soil Science 173: 130–142.
Taboada, M.A.; Lavado, R.S.; Svartz, H.; Segat, A.M.I. 1999. Structural stability changes in a grazed grassland Natraquoll of the flooding Pampa, Argentina. Wetlands 19: 50-55.
Taboada, M.A.; Micucci, F.G.; Cosentino, D.J.; Lavado, R.S. 1998a. Comparison of compaction induced by conventional and zero tillage in two soils of the Rolling Pampa of Argentina. Soil and Tillage Research 49: 57-63.
Taboada, M.A.; Rubio, G.; Lavado, R.S. 1998b. The deterioration of tall wheatgrass pastures in saline sodic soils. Journal of Range Management 51: 241-246.
Tisdall, J.M.; Oades, J.M. 1982. Organic matter and water-stable aggregates in soils. Journal of Soil Science 33: 141-163. To, J.; Kay, B.D. 2005. Variation in penetrometer resistance with
soil properties: the contribution of effective stress and implications for pedotransfer. Geoderma 126: 261-276. Tormena, C.A.; Silva, A.P.; Libardi, P.L. 1999. Soil physical quality
of a Brazilian Oxisol under two tillage systems using the least limiting water range. Soil and Tillage Research 52: 223-232. Van Genuchten, M.T. 1980. A closed-form equation for predicting
the hydraulic conductivity of unsaturated soils. Soil Science of America Journal 44: 892-898.
Van Raij, B. 1998. Bioavailable test: alternatives to standard soil extractions. Communications in Soil Science and Plant Analysis 29: 1553-1570.
Veen, B.W.; Boone, F.R. 1990. The influence of mechanical resistance and soil water on the growth of seminal roots of maize. Soil and Tillage Research 16: 219-226.
Vepraskas, M.J. 1984. Cone index of loamy sands as influenced by pore size distribution and effective stress. Soil Science Society of America Journal 48: 1220-1225.
Whalley, W.R.; Leeds-Harrison, P.B.; Clark, L.J.; Gowing, D.J.G. 2005. Use of effective stress to predict the penetrometer resistance of unsaturated agricultural soils. Soil and Tillage Research 84: 18-27.
Wheaton, A.D; McKenzie, B.M.; Tisdall, J.M. 2008. Management to increase the depth soft soil improves soil conditions grapevine performance in an irrigated vineyard. Soil and Tillage Research 98: 68-80.
White, W.M. 1993. Dry agrégate distribution. p. 659-662. In: Carter, M.R., ed. Soil sampling and methods of analysis. Lewis, Canada, CA.
Zook, D.M.; Erwin, D.C.; Stolzy, L.H. 1986. Anatomical, morphological, and physiological response of alfalfa to flooding. Plant and Soil 96: 293-296.
Zou, C.; Penfold, C; Sands, R.; Misra, R.K.; Hudson, I. 2001. Effects of soil air-filled porosity, soil matric potencial and soil strength on primary root growth of radiate pine seedlings. Plant and Soil 236: 105-115.