What matters most? Evidence-based findings
of health dimensions affecting the societal
preferences for EQ-5D health states
O que importa mais? Evidências empíricas das
dimensões que afetam as preferências sociais
para estados de saúde do EQ-5D
¿Qué es lo que más importa? Evidencias
empíricas sobre las dimensiones que afectan a las
preferencias sociales por los estados de salud en
EQ-5D
1 Centro de Desenvolvimento e Planejamento Regional, Universidade Federal de Minas Gerais, Belo Horizonte, Brasil.
2 Instituto de Ciências Sociais Aplicadas, Universidade Federal de Alfenas, Alfenas, Brasil.
3 Academic Unit of Health Economics, Leeds Institute of Health Sciences, Leeds, England.
Correspondence M. V. Andrade Faculdade de Ciências Econômicas, Centro de Desenvolvimento e Planejamento Regional, Universidade Federal de Minas Gerais.
Av. Antônio Carlos 6627, Belo Horizonte, MG 31270-901, Brasil. [email protected]
Monica Viegas Andrade 1
Kenya Valeria Micaela de Souza Noronha 1 Ana Carolina Maia 2
Paul Kind 3
Abstract
This study analyzes how different health dimen-sions defined by the EQ-5D-3L instrument affect average individual preferences for health states. This analysis is an important benchmark for the incorporation of health technologies as it takes into consideration Brazilian population prefer-ences in health resource allocation decisions. The EQ-5D instrument defines health in terms of five dimensions (mobility, daily activities, self-care activities, pain/discomfort, and anxi-ety/depression) each divided into three levels of severity. Data came from a valuation study with 3,362 literate individuals aged between 18 and 64 living in urban areas of Minas Gerais State, Brazil. The main results reveal that health utility decreases as the level of severity increases. With regard to health issues, mobility stands out as the most important EQ-5D dimension. Indepen-dently of severity levels of the other EQ-5D-3L di-mensions, the highest decrements in utilities are associated with severe mobility problems.
Quality Adjusted Life Years; Health Evaluation; Health Technology Assessment
Resumo
Este estudo analisa como as diferentes dimensões dos estados de saúde definidas pelo instrumento EQ-5D-3L afetam, em média, as preferências dos indivíduos por estados de saúde. Essa análise é importante para balizar a incorporação de tec-nologias em saúde uma vez que viabiliza con-siderar as preferências da população brasileira na decisão de alocação de recursos em saúde. O EQ-5D-3L define a saúde em cinco dimensões (mobilidade, atividades habituais, auto-cui-dado, dor/desconforto e ansiedade/depressão) contendo três níveis de severidade. Os dados são provenientes de uma pesquisa inédita no Brasil que entrevistou 3.362 pessoas com idade entre 18 e 64 anos vivendo em áreas urbanas de Minas Gerais. Os principais resultados mostram que o decremento na utilidade dos indivíduos é cres-cente com o nível de severidade. No que se refere às dimensões de saúde, a mobilidade se destaca como a mais importante. Independentemente dos níveis de severidade das demais dimensões do EQ-5D, os maiores decrementos nas utilida-des estão associados ao problema de mobilidade severa.
Introduction
The main purpose of the health technology as-sessment (HTA) is to assist health policymakers in implementing more cost-effective technolo-gies in order to allocate resources efficiently. HTA is an important tool in the analysis of the use of technologies at macro and micro levels. At the macro-level, HTA assists policymakers in formulating public health policies while at the micro-level it is mainly used to support the de-velopment of clinical practice guidelines and to assist physicians in efficiently combining indi-vidual technologies 1,2. Even though new health technologies contribute to improve population health, their uncritical use increases health ex-penditures and may have strong budget impacts. Ultimately this impact can threaten the access to health care services especially among low in-come groups 3,4,5,6,7,8. The incorporation process of technologies in the healthcare sector presents peculiar characteristics. Firstly, it is quite dynam-ic and in general is supplier-induced demand. Because physicians usually have more diagnos-tic and prognosdiagnos-tic information about patient conditions, information asymmetry performs an important role in this process. Secondly, un-like other markets, health technologies are barely substitutive. They tend to be accumulative which widen the technological alternatives in this sec-tor. Thirdly, individuals will always demand more care even if there is no clinical evidence about its efficacy. When individuals are sick, the more care they get the better 9,10.
The United States was one of the first coun-tries to formally recognize the importance of HTA with the creation of the Office of Technology As-sessment in 1973 by the US Congress. Despite the pioneering efforts of the US, the growth of HTA occurred at the beginning of the 1980s, mainly in European countries. This movement was stron-ger in countries with organized public healthcare systems such as Sweden, the Netherlands and the United Kingdom. Currently, Australia, Canada and the UK are at the forefront in the use of HTA in order to make decisions about incorporation or discharges of technologies in the healthcare sector 11,12,13,14,15.
In Brazil, the demand for new health tech-nologies is also growing mainly due to the ag-ing process and changes in the epidemiological profile 16,17,18. The incorporation of new health technologies depends on the institutional design of healthcare. In the Brazilian healthcare system, the private and public sectors are involved in both the funding and the delivery of health care services. The Brazilian Unified National Health System (SUS) was created by the Brazilian
Fed-eral Constitution in 1988. The main principles of the SUS are universality, comprehensiveness and free of charge access. Therefore, in the pub-lic healthcare system, health is everyone’s right and is the duty of the government. In the private sector, there are two sources of financing: out-of-pocket payments and health insurance 19.
This institutional design imposes additional challenges for Brazilian policymakers. The in-corporation process of new technologies is not centralized and the current regulation is limited to the services financed by SUS. In fact, the incor-poration of new technologies tends to be endog-enous. In this scenario, the economic rationality of the private sector can weaken the supremacy of the State in defining criteria for the incorpora-tion of health technologies. As a result, loss of ef-ficiency in resource allocation is often observed. Besides the issues involving efficiency, this insti-tutional design generates asymmetries in the ac-cess to healthcare especially among individuals who have private health insurance coverage. The double access to the healthcare system among wealthier individuals may contribute to increase inequalities in the utilization of health services.
In this context, HTA is an important tool for ensuring the efficiency of the policy-making pro-cesses concerning the use of technology and fi-nancial sustainability of the healthcare system. The main methods used in this type of economic evaluation are: (1) cost-benefit, (2) cost-effec-tiveness and (3) cost-utility analysis. The main difference among the types of economic evalu-ation is the nature of the consequences stem-ming from the different alternatives that affect their measurement, valuation and comparison to costs. In cost-benefit analysis, health out-comes are expressed in monetary terms. In cost-effectiveness analysis benefits are measured in natural health units such as number of life-years saved and number of hospitalizations avoided. In cost-utility analysis the incremental cost of an intervention is compared to incremental health improvements 8,12,20,21,22,23. Health outcomes are measured by a combination of mortality (alter-natively length of life) and health-related qual-ity of life measures. A usual approach to perform cost-utility analysis is the estimation of quality adjusted life years (QALY).
The use of QALYs requires the definition of societal preference weights for different health states 24,25. There are several health-state classifi-cation systems that can be used in the construc-tion of QALYs as for example Health Utility Index
(HUI), Short-Form 36 Items (SF-36), Short-Form 6 Dimension (SF-6D) and EuroQol-5 Dimensions
severity that each classification system takes into account 26,27,28,29,30,31,32. EQ-5D is probably the most widely used generic measure of health sta-tus in measuring benefits for economic evalua-tion. Besides, this instrument is recommended by the National Institute for Health and Clinical Excellence (NICE) which is responsible to de-velop evidence-based guidelines on the most effective health technologies for the National Health Services (NHS) in the UK 33. The EQ-5D instrument defines health in terms of five dimen-sions (mobility, daily activities, self-care activi-ties, pain/discomfort, and anxiety/depression) divided into three (EQ-5D-3L) or five (EQ-5D-5L) levels of severity. In this paper the EQ-5D-3L ver-sion is used that considers the following catego-ries of severity: no problem, moderate problem and severe problem. The combination of dimen-sion and level of severity generates a total of 243 distinct health states 26,29,30,34,35,36,37,38. EQ-5D-5L is a very recent instrument and its use is not widespread among countries making it difficult to compare internationally. In Brazil this study is the first attempt to estimate societal preference weights using EQ-5D. In this sense it is desirable to use the best known instrument. Besides, only recently studies validating the use of EQ-5D-5L have been published 39.
The aim of this paper is to evaluate the ef-fect of different EQ-5D health dimensions on in-dividual health states valuation in Brazil. Which health dimension is more important for Brazilian health-related quality of life? This analysis is an important benchmark for the decision-makers in performing HTA. Health technologies usu-ally improve health but it can have side effects that result in undesirable health states for soci-ety. Thus, the knowledge of health dimensions that generate the highest welfare gains can assist policy-makers when deciding about the imple-mentation of new technologies.
Method
In Brazil, there are two studies that estimated societal preferences for the population. The first was conducted in the city of Porto Alegre in Rio Grande do Sul State and used the SF-6D instru-ment 28. The valuation parameters were obtained using the standard gamble (SG) technique. Re-cently, a larger research was conducted in Minas Gerais State in order to estimate societal prefer-ences weights for EQ-5D health states 40. Weights were derived by applying the time trade-off (TTO) elicitation method to a subset of 102 EQ-5D health states. The advantage of TTO over SG is that TTO is easier to be applied and can be more
readily understood. As Brazilian society is still marked by high socioeconomic heterogeneity and low education levels, TTO may have a better performance in evaluating health preferences. A more complex technique can introduce bias due to the difficulty faced by individuals in trying to understand the exercise.
The present paper will take advantage of this new database that provides information about individual preferences for EQ-5D health states in Minas Gerais 40. Minas Gerais is a large and heterogeneous state in the southeast region of Brazil and has a population of 20 million inhabit-ants, the majority residing in urban areas (Insti-tuto Brasileiro de Geografia e Estatística. Censo demográfico 2010. http://www.ibge.gov.br). The state has the second largest economy of Brazil but presents great heterogeneity in terms of eco-nomic development and standards of living. An analysis of the Human Development Index (HDI) shows that socioeconomic disparities in Minas Gerais are similar to those observed across Brazil: in 2000, the HDI values for Minas Gerais cities ranged from 0.57 (in the northeast of the state) to 0.84 (southeast of the state) while in Brazil, the range was 0.64 (northeast of Brazil) and 0.82 (South of Brazil) 41. Due to its great diversity Mi-nas Gerais is considered to be representative of Brazilian heterogeneity.
The EQ-5D descriptive classification defines a total of 243 distinct health states each of which is labeled with a unique five digit code. For ex-ample 11111 represents the full health state de-fined as having no problems in any dimension while 33333 represents the worst health state with extreme problems on all five dimensions. The EQ-5D Brazilian language version was culturally adapted and provided by the Euro-QoL Group. The interview protocol followed a revised version 42 of the original Measurement and Value of Health (MVH) study 43. This
proto-col has already been applied in deriving French population values for EQ-5D 34 and in a Korean valuation study 37. The Minas Gerais EQ-5D study 40 was designed so as to obtain values for
the state “dead” – a total of nine states. Health state descriptions were presented on printed set of cards which were handed to the participant.
Individuals were first asked to describe their own health in terms of the EQ-5D classification system and to rate it using a Visual Analogue Scale
(VAS) with endpoints of 0 and 100 corresponding to the worst and best imaginable health states. They were then asked to rank order the set of nine printed cards containing the health state de-scriptions from the best to worst. The cards were then shuffled and individuals were asked to rate them on the same 0-100 VAS used to rate their own health. Respondents were instructed that each health state would last for 10 years followed by death.These exercises were performed before TTO in order to familiarize individuals with the description of health states.
The TTO elicitation protocol has been fully described elsewhere 43. It essentially involves presenting participants with choices between two alternatives that comprise varying levels of quantity and quality of life. Health states can be evaluated as either better or worse than death. A double-sided time board is used with one side for health states considered better than dead and the other side for health states worse than dead. For states evaluated better than dead in-dividuals establish the number of years (x < 10) in full health that provides them the same expected utility level as living ten years experiencing some specific health condition. The TTO value (V) is ob-tained dividing the length of time in full health by ten . For states considered to be worse than dead individuals compare death with a choice that gives them 10-x years in some spe-cific health state followed by x years (x < 10) in full health. In this case the TTO value is given by . Indifference points in the TTO protocol were effectively established in terms of six month increments yielding a range of values from -19 to 1. In order to treat the asymmetric distribution of negative values, a monotonic transformation , ifV < 0 was performed so as to alter the range of values to be -1 to 1 44.
Study design
The target population was literate individuals aged between 18 and 64 years living in urban areas of Minas Gerais. A sample-size definition was based on the 2010 Brazilian Demographic Census (http://www.ibge.gov.br) with a margin of error equal to 3%. In total, 3,362 individuals were recruited. The sample is representative by age and sex for the whole state and for three different regional levels of Minas Gerais: Belo Horizonte, metropolitan and non-metropolitan area. The
sample was spatially distributed in order to take into account all macroregions of Minas Gerais and all planning areas of Belo Horizonte. Face-to-face interviews were conducted in households in which one individual was selected. Sociodemo-graphic information was recorded on all partici-pants. Economic incentives were not offered to interviewees. All health states were evaluated by more than 100 individuals as recommended by Chuang & Kind 45.
Modeling
Regression analysis was used to analyze the ef-fect of health dimensions on individual EQ-5D health states valuation and to estimate the 243 EQ-5D health states. It should be noted that the states 11111 and dead are defined by virtue of the TTO procedure as having values of 1 and zero respectively. No inconsistent respondent data were excluded in the analysis. The choice of ran-dom effect model was based on the results of two tests, Hausman and Breush-Pagan tests 46. Both mean absolute error (MAE) and the number of health states with absolute residuals over 0.05 were computed to as goodness of fit statistics. Statistical analyses were conducted using Stata 11.0 (Stata Corp., College Station, USA).
Dependent variable of all models was defined as 1 minus transformed TTO response (1-Vt). In order to evaluate which dimension and level of severity affect more the individual’s health valu-ation, a set of 10 dummy variables for each level of severity and health dimensions were defined as follows: MO2 is equal to 1 if the mobility di-mension is on level 2; MO3 is equal to 1 if the mobility dimension is on level 3; SC2 is equal to 1 if the self-care dimension is on level 2; SC3 is equal to 1 if the self-care dimension is on level 3; UA2 is equal to 1 if the daily activities dimension is on level 2; UA3 is equal to 1 if the daily activities dimension is on level 3; PD2 is equal to 1 if the pain/discomfort dimension is on level 2; PD3 is equal to 1 if the pain/discomfort dimension is on level 3; AD2 is equal to 1 if the anxiety/depression dimension is on level 2 and AD3 is equal to 1 if the anxiety/depression dimension is on level 3.
Results
Sample characteristics
The socio-demographic and health characteris-tics of the achieved sample are displayed in Table 1. The sample is composed of literate individuals aged between 18 and 64 living in urban areas of Minas Gerais.
Sample weights were used to perform the fre-quency analysis. As the present study was based on quota sampling by age and sex, the distribu-tion of these attributes is quite similar to the of-ficial surveys 40. Around 45% of interviewed indi-viduals have more than 11 years of schooling and 30% have less than 4 years. Distribution of health attributes are also similar to the results found elsewhere for the state of Minas Gerais 47.
This study is the first opportunity to analyze health conditions of a Brazilian population based on the EQ-5D descriptive system. The majority of individuals reported no problem in the five health dimensions: more than 90% of individuals do not have difficulties in performing self-care, daily ac-tivities, or any mobility problems; more than 55% do not have any pain/discomfort or anxiety/de-pression. The prevalence of moderate problems is higher for two dimensions – pain/discomfort (38%) and anxiety/depression (30%). Despite the low prevalence, it is noticed that around 9% of in-dividuals reported moderate problems in mobil-ity and performing daily activities. Severe prob-lems in all dimensions are less prevalent (lower than 5%) in this population.
Among the investigated chronic diseases, hypertension is the most prevalent condition in this population (25%) followed by spinal disease (18%). Only 5% of individuals reported having suffered from diabetes.
Descriptive analysis of observed TTO values for directly evaluated EQ-5D health states
The study sample comprised 3,362 individuals of whom 177 respondents evaluated fewer than seven states in the TTO exercise and two individ-uals had all health states with missing values. In the majority of cases, these missing values were due to mistakes made by the interviewers such as the repetition of cards or errors in recording the board marker. These individuals were included in the data analysis but their non-valid responses were omitted. Table 2 displays the summary de-scriptive statistics of non-transformed and trans-formed TTO values for the directly evaluated EQ-5D heath states. All health states were evaluated by more than 124 individuals. Only the health state 33333 was evaluated by all individuals in
Table 1
Socio-demographic and health characteristics of the achieved sample in the Minas Gerais EQ-5D Valuation Study (in percentage). Minas Gerais State, Brazil.
Characteristics %
Sex
Men 48.42
Women 51.58
Age group (years)
18-34 43.29
35-49 33.95
50-59 16.25
60+ 6.50
Education level (years)
< 4 29.23
4-10 24.55
11 37.65
12+ 8.54
Private health insurance plan
Yes 31.36
No 68.64
Self-reported health
Very good 25.35
Good 52.01
Fair 20.49
Bad 1.58
Very bad 0.49
EQ-5D descriptive system Mobility
No problem 91.23
Some problem 8.68
Incapacity 0.09
Self-care
No problem 97.59
Some problem 2.06
Incapacity 0.35
Usual activities
No problem 89.85
Some problem 9.81
Incapacity 0.35
Pain/Discomfort
No problem 57.71
Moderate 38.35
Extreme 3.94
Anxiety/Depression
No problem 64.92
Moderate 30.68
Extreme 4.41
Chronic disease prevalence
Hypertension 24.62
Depression 14.36
Arthritis 7.29
Kidney disease 2.83
Diabetes 5.55
Spinal disease 17.64
Heart disease 6.40
Cirrhosis 0.22
Respiratory disease 13.09
Health condition
N Transformed
TTO
Worse than death
valua-tions
Non-transformed TTO
Health condition
n Transformed
TTO
Worse than death
valua-tions
Non-transformed TTO
Mean SD Mean SD Minimum Mean SD Mean SD Minimum
11112 255 0.840 0.244 4 0.767 1.264 -19.0 22232 127 0.331 0.567 36 -0.122 2.585 -19.0
11121 253 0.869 0.193 4 0.866 0.221 -1.2 22233 258 0.286 0.562 79 -0.385 3.279 -19.0
11122 258 0.783 0.254 3 0.778 0.280 -1.2 22313 129 0.455 0.447 15 0.208 1.911 -19.0
11123 127 0.758 0.327 4 0.469 2.488 -19.0 22323 257 0.332 0.537 63 -0.256 3.096 -19.0
11211 258 0.819 0.229 2 0.818 0.231 -0.3 22332 381 0.149 0.551 140 -0.512 2.979 -19.0
11212 258 0.799 0.244 3 0.797 0.253 -0.8 22333 257 0.199 0.532 89 -0.365 2.831 -19.0
11221 253 0.795 0.236 3 0.791 0.258 -1.0 23113 258 0.483 0.465 31 0.157 2.286 -19.0
11222 261 0.715 0.317 13 0.708 0.346 -1.0 23131 128 0.372 0.529 28 -0.125 2.666 -19.0
11223 129 0.640 0.407 9 0.544 0.839 -5.7 23132 129 0.334 0.504 24 -0.180 3.002 -19.0
11232 124 0.556 0.448 19 0.504 0.612 -3.0 23222 131 0.434 0.516 24 -0.235 3.471 -19.0
11312 128 0.665 0.337 6 0.658 0.365 -1.0 23223 257 0.254 0.548 78 -0.431 3.291 -19.0
11313 129 0.636 0.377 7 0.599 0.534 -3.0 23231 128 0.221 0.588 38 -1.124 4.775 -19.0
11323 127 0.602 0.398 7 0.399 1.882 -19.0 23232 256 0.207 0.560 89 -0.505 3.294 -19.0
11332 128 0.504 0.450 18 0.185 2.486 -19.0 23233 251 0.147 0.579 100 -0.752 3.708 -19.0
12111 255 0.794 0.279 6 0.710 1.289 -19.0 23311 127 0.349 0.550 28 -0.247 3.096 -19.0
12112 513 0.746 0.319 13 0.707 0.599 -5.7 23313 127 0.188 0.547 40 -0.857 4.208 -19.0
12121 258 0.755 0.288 5 0.742 0.359 -1.9 23321 129 0.340 0.539 31 0.071 1.335 -5.7
12122 256 0.724 0.344 11 0.558 1.813 -19.0 23322 254 0.183 0.553 93 -0.506 3.275 -19.0
12123 127 0.655 0.412 9 0.560 0.855 -5.7 23323 256 0.146 0.550 100 -0.617 3.179 -19.0
12211 256 0.737 0.314 7 0.655 1.284 -19.0 23332 255 0.115 0.553 96 -0.711 3.476 -19.0
12212 260 0.688 0.340 11 0.657 0.519 -4.0 23333 255 0.042 0.566 112 -1.227 4.330 -19.0
12221 257 0.718 0.334 8 0.605 1.386 -19.0 31131 129 0.283 0.518 32 -0.036 1.942 -19.0
12312 130 0.646 0.313 6 0.637 0.354 -1.5 31213 130 0.303 0.516 29 -0.131 2.546 -19.0
12313 128 0.530 0.435 14 0.230 2.472 -19.0 31222 129 0.289 0.530 35 -0.058 2.003 -19.0
12331 129 0.437 0.491 22 0.058 2.544 -19.0 31311 128 0.361 0.516 25 -0.034 2.523 -19.0
13123 127 0.548 0.423 14 0.363 1.822 -19.0 31313 125 0.168 0.553 44 -0.823 3.931 -19.0
13211 129 0.614 0.405 10 0.537 0.779 -5.7 32111 127 0.322 0.544 31 -0.191 2.672 -19.0
13222 129 0.470 0.478 20 0.266 1.837 -19.0 32123 130 0.185 0.555 40 -0.451 3.033 -19.0
13232 130 0.317 0.523 27 -0.363 3.442 -19.0 32223 255 0.091 0.571 108 -0.854 3.677 -19.0
21111 256 0.789 0.295 5 0.710 1.278 -19.0 32232 257 0.078 0.558 101 -0.667 2.939 -19.0
21112 259 0.732 0.332 9 0.498 2.173 -19.0 32233 256 0.060 0.513 110 -0.576 2.847 -19.0
21121 257 0.722 0.342 9 0.553 1.803 -19.0 32322 255 0.171 0.536 90 -0.368 2.623 -19.0
21122 257 0.718 0.299 5 0.699 0.430 -3.0 32323 258 -0.006 0.543 133 -0.620 2.370 -19.0
21123 128 0.569 0.482 20 0.347 1.897 -19.0 32332 255 -0.037 0.545 126 -1.154 3.840 -19.0
21133 127 0.676 0.371 8 0.591 0.870 -5.7 32333 254 -0.086 0.546 136 -1.689 4.745 -19.0
21211 258 0.737 0.302 9 0.730 0.330 -1.0 33121 129 0.270 0.536 38 -0.228 2.649 -19.0
21212 258 0.657 0.383 14 0.483 1.800 -19.0 33122 127 0.263 0.546 36 -0.487 3.507 -19.0
21221 257 0.679 0.354 14 0.637 0.568 -4.0 33211 124 0.223 0.526 38 -0.103 1.958 -19.0
21231 128 0.482 0.486 20 0.103 2.552 -19.0 33213 258 0.065 0.528 108 -0.693 3.252 -19.0
21311 130 0.683 0.343 7 0.640 0.653 -5.7 33221 129 0.092 0.584 51 -1.207 4.451 -19.0
21312 128 0.563 0.415 13 0.505 0.630 -3.0 33222 253 0.038 0.574 121 -0.901 3.531 -19.0
21313 127 0.575 0.413 11 0.369 1.858 -19.0 33223 253 0.039 0.548 112 -0.770 3.148 -19.0
21331 128 0.530 0.422 15 0.357 1.796 -19.0 33231 129 0.031 0.553 61 -0.974 3.811 -19.0
21332 128 0.402 0.520 27 0.112 1.945 -19.0 33232 254 0.023 0.550 115 -0.833 3.178 -19.0 22111 258 0.693 0.361 13 0.596 1.313 -19.0 33233 255 -0.055 0.562 130 -1.193 3.713 -19.0
22112 257 0.615 0.413 20 0.474 1.432 -19.0 33312 129 0.108 0.535 51 -0.546 3.051 -19.0
22113 124 0.583 0.410 11 0.501 0.793 -5.7 33313 126 0.048 0.534 54 -0.725 3.110 -19.0
(continues) Table 2
Table 2 (continued)
Health condition
N Transformed
TTO
Worse than death
valua-tions
Non-transformed TTO
Health condition
n Transformed
TTO
Worse than death
valua-tions
Non-transformed TTO
Mean SD Mean SD Minimum Mean SD Mean SD
Mini-mum
22121 253 0.617 0.398 26 0.449 1.803 -19.0 33322 510 -0.070 0.540 261 -1.507 4.449 -19.0 22211 258 0.628 0.400 18 0.489 1.432 -19.0 33323 381 -0.046 0.556 188 -1.338 4.108 -19.0 22221 129 0.510 0.500 21 0.275 1.895 -19.0 33333 3328 -0.235 0.494 2105 -2.450 5.429 -19.0
SD: standard deviation.
the sample from which 34 presented non-valid information comprising 3,328 evaluations.
Non-transformed TTO values show an asym-metric distribution: the mean values range from 0.866 to -2.450 and the minimum can be equal to -19. Therefore, while the values for better-than-death states vary from 0 to 1, the range for worse-than-death states is wider. To deal with this asymmetric distribution, worse-than-death states were transformed so as to be bounded by 0 and -1.
Mean transformed TTO values range from 0.869 (SD = 0.193) to -0.235 (SD = 0.494) for the 11121 and 33333 health states respectively. For mild health states, mean transformed TTO val-ues vary from 0.869 (SD = 0.193) to 0.615 (SD = 0.413). The percentage of individuals who classi-fied mild health states as worse than death range from 1% (11211) to 10% (22121). For severe health states the maximum mean TTO value is 0.332 (SD = 0.537) and the minimum is -0.235 (SD = 0.494). Around 60% of individuals evaluated the health state 33333 as being worse than death. Values for moderate health states overlap both mild and severe ranges. The percentage of in-dividuals who classified moderate health states as worse than death ranges from 3% (11123) to 47% (33231).
Overall, seven cards are given negative mean values indicating states worse than dead: 33333, 32333, 33322, 33233, 33323, 32332 and 32323. The SD of transformed TTO values increases with the severity of the health state indicating greater het-erogeneity in individual scores in poorer health states.
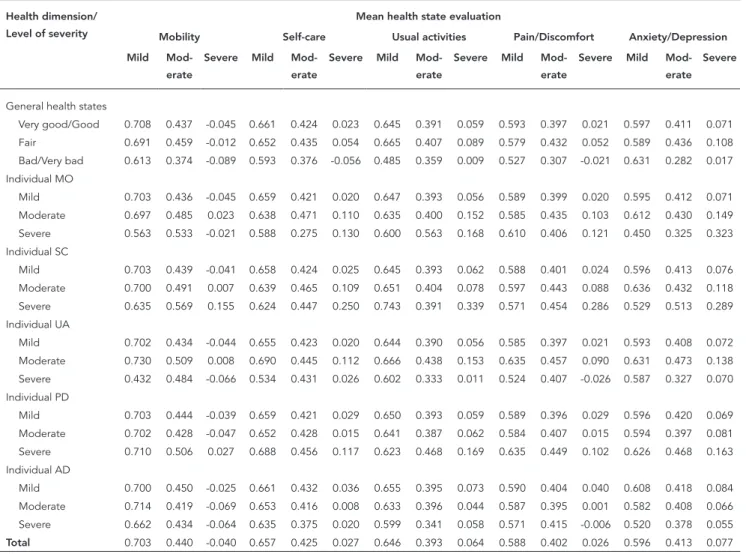
Table 3 displays the mean TTO health evalu-ation by each EQ-5D health dimension and level of severity for the whole sample and disaggre-gating by individual current health states. An individual health state is measured by the EQ-5D descriptive system and self-reported general health. The last indicator originally comprises five response categories that were re-classified into three groups: (1) very good/good, (2) fair
and (3) bad and very bad. For example, the first cell shows the average TTO evaluation (0.708) given by individuals with very good/good health to health states with mild mobility problems. It refers to the average TTO value of all health states with 1 in the mobility dimension indepen-dently of the severity level observed for the other health dimensions. As expected, the mean TTO values decrease by increasing the level of sever-ity for all dimensions. When the whole sample is taken into account, the results emphasize the importance of mobility dimension to the health valuation. On the one hand health states present-ing severe mobility problems (bepresent-ing confined in bed) are the only conditions for which the TTO mean value is negative (-0.40). On the other hand health states without any mobility problems are given the highest weight (0.703) amongst all EQ-5D health dimensions/level of severity.
Among individuals without any problem or with moderate problems in either dimension, the results are similar to those found for the whole sample: health states with severe mobility prob-lems are given the lowest mean TTO values while health states without mobility problems are bet-ter evaluated. The lowest mean TTO value for se-vere mobility problems is given by individuals ex-periencing moderate anxiety/depression (-0.069) whereas the highest value is given by individuals with moderate mobility problems (0.023). The analysis for individuals with severe problems is more difficult since a small amount of individu-als are classified in this health category across all dimensions.
Effect of health dimension and level of severity on EQ-5D health states valuation
Table 4 displays the results for random effect models. As the Hausman test was not significant (probability > χ2 = 0.2453), the null hypothesis was not rejected and the random effect model can be safely accepted. The Breush-Pagan test rejects the null hypothesis of homoscedasticity (χ2 p < 0.001). The presence of heteroscedasticity favours the use of random effect models.
Five different specifications of random ef-fect models were tested. The most parsimonious model (model 1) is based on main effects and includes only dummy variables for each health dimension and level of severity. More complex forms of the models (model 2 to model 5) in-clude additional dummy variables to take into account the interaction effect of any dimension
Table 3
Mean time trade-off (TTO) values for each health dimension/ severity by current individual health status
Health dimension/ Level of severity
Mean health state evaluation
Mobility Self-care Usual activities Pain/Discomfort Anxiety/Depression
Mild
Mod-erate
Severe Mild
Mod-erate
Severe Mild
Mod-erate
Severe Mild
Mod-erate
Severe Mild
Mod-erate Severe
General health states
Very good/Good 0.708 0.437 -0.045 0.661 0.424 0.023 0.645 0.391 0.059 0.593 0.397 0.021 0.597 0.411 0.071 Fair 0.691 0.459 -0.012 0.652 0.435 0.054 0.665 0.407 0.089 0.579 0.432 0.052 0.589 0.436 0.108 Bad/Very bad 0.613 0.374 -0.089 0.593 0.376 -0.056 0.485 0.359 0.009 0.527 0.307 -0.021 0.631 0.282 0.017 Individual MO
Mild 0.703 0.436 -0.045 0.659 0.421 0.020 0.647 0.393 0.056 0.589 0.399 0.020 0.595 0.412 0.071 Moderate 0.697 0.485 0.023 0.638 0.471 0.110 0.635 0.400 0.152 0.585 0.435 0.103 0.612 0.430 0.149 Severe 0.563 0.533 -0.021 0.588 0.275 0.130 0.600 0.563 0.168 0.610 0.406 0.121 0.450 0.325 0.323 Individual SC
Mild 0.703 0.439 -0.041 0.658 0.424 0.025 0.645 0.393 0.062 0.588 0.401 0.024 0.596 0.413 0.076
Moderate 0.700 0.491 0.007 0.639 0.465 0.109 0.651 0.404 0.078 0.597 0.443 0.088 0.636 0.432 0.118 Severe 0.635 0.569 0.155 0.624 0.447 0.250 0.743 0.391 0.339 0.571 0.454 0.286 0.529 0.513 0.289 Individual UA
Mild 0.702 0.434 -0.044 0.655 0.423 0.020 0.644 0.390 0.056 0.585 0.397 0.021 0.593 0.408 0.072 Moderate 0.730 0.509 0.008 0.690 0.445 0.112 0.666 0.438 0.153 0.635 0.457 0.090 0.631 0.473 0.138
Severe 0.432 0.484 -0.066 0.534 0.431 0.026 0.602 0.333 0.011 0.524 0.407 -0.026 0.587 0.327 0.070 Individual PD
Mild 0.703 0.444 -0.039 0.659 0.421 0.029 0.650 0.393 0.059 0.589 0.396 0.029 0.596 0.420 0.069 Moderate 0.702 0.428 -0.047 0.652 0.428 0.015 0.641 0.387 0.062 0.584 0.407 0.015 0.594 0.397 0.081 Severe 0.710 0.506 0.027 0.688 0.456 0.117 0.623 0.468 0.169 0.635 0.449 0.102 0.626 0.468 0.163
Individual AD
Mild 0.700 0.450 -0.025 0.661 0.432 0.036 0.655 0.395 0.073 0.590 0.404 0.040 0.608 0.418 0.084 Moderate 0.714 0.419 -0.069 0.653 0.416 0.008 0.633 0.396 0.044 0.587 0.395 0.001 0.582 0.408 0.066 Severe 0.662 0.434 -0.064 0.635 0.375 0.020 0.599 0.341 0.058 0.571 0.415 -0.006 0.520 0.378 0.055
Total 0.703 0.440 -0.040 0.657 0.425 0.027 0.646 0.393 0.064 0.588 0.402 0.026 0.596 0.413 0.077
with moderate or extreme problems. All these models displayed similar results to the initial main effects specification with virtually identical goodness-of-fit statistics and the same number of states with a MAE exceeding 0.05. Because the results were very similar among the models, the basic specification including only dummy vari-ables for each health dimension and level of se-verity was selected. Besides some of interaction models presented inconsistencies: the N2 and N3 terms were negative.
All dummy coefficients are positive and sig-nificant at the 1% level. Since a dependent vari-able is defined as one minus the TTO value, co-efficients are interpreted as a utility decrement relative to the perfect EQ-5D health state (11111). The constant is considered as an overall decre-ment independently of the health dimension and level of severity. In that way, health utility
Table 4
Results of random effect models estimated for linear-transformed time trade-off (TTO).
Variables Model 1 Model 2 Model 3 Model 4 Model 5
Coeficient SD Coeficient SD Coeficient SD Coeficient SD Coeficient SD
Mobility 2 0.128 * 0.007 0.135 * 0.007 0.130 * 0.007 0.119 * 0.008 0.132 * 0.007
Mobility 3 0.404 * 0.008 0.400 * 0.008 0.407 * 0.008 0.392 * 0.009 0.396 * 0.009
Self-care 2 0.121 * 0.007 0.128 * 0.007 0.122 * 0.007 0.111 * 0.007 0.123 * 0.007
Self-care 3 0.247 * 0.008 0.247 * 0.008 0.249 * 0.008 0.238 * 0.008 0.238 * 0.009
Usual activities 2 0.095 * 0.007 0.102 * 0.008 0.097 * 0.008 0.087 * 0.008 0.099 * 0.008 Usual activities 3 0.205 * 0.008 0.202 * 0.008 0.209 * 0.008 0.194 * 0.008 0.198 * 0.009
Pain/Discomfort 2 0.067 * 0.007 0.072 * 0.007 0.068 * 0.007 0.055 * 0.007 0.069 * 0.007
Pain/Discomfort 3 0.200 * 0.007 0.195 * 0.008 0.203 * 0.008 0.184 * 0.009 0.190 * 0.009
Anxiety/Depression 2 0.062 * 0.007 0.067 * 0.007 0.064 * 0.007 0.051 * 0.008 0.064 * 0.007
Anxiety/Depression 3 0.113 * 0.007 0.111 * 0.008 0.117 * 0.008 0.102 * 0.008 0.106 * 0.008
N2 -0.033 * 0.011
N3 -0.013 ns 0.009
X5 0.036 * 0.011
C3sq 0.002 * 0.001
Intercept 0.054 * 0.010 0.077 * 0.012 0.054 * 0.010 0.079 * 0.012 0.052 * 0.010
R2 Overall 0.365 0.365 0.365 0.365 0.365
Mean absolute error 0.035 0.034 0.035 0.034 0.035
Number (of 102) > 0.05 25 21 24 24 24
Model 1: parsimonious RE model (controlling for main effects); model 2: controlling for main effects and dummy variable indicating presence of level 2 of severity in any dimension; model 3: controlling for main effects and dummy variable indicating presence of level 3 of severity in any dimension; model 4: controlling for main effects and dummy variable indicating that all five dimensions are on level 2 or 3; model 5: controlling for main effects and a variable that it is the square of the number of dimensions at level 3; ns: not significant; SD: standard deviation.
* Significant at 1% level.
decreases by 5.4% due to any deviation from the perfect health state. The coefficients behave as expected showing a monotonic increase in value decrement with increasing severity for all health dimensions. The largest decrement is observed for severe mobility problems, which is around 40%. Being confined in bed considerably de-creases an individual’s well-being. For three health dimensions (self-care, daily activities and pain/discomfort), the fact of having experienced severe problems decreases health utility by an amount of 20-25%. For severe anxiety/depres-sion, the decrease is lower at around 11%. As for moderate problems, the utility decreases are around 12% for two dimensions (mobility and self-care) and 9% for daily activities. In case of pain/discomfort and anxiety/depression, having experienced moderate problems decreases util-ity by only 6%.
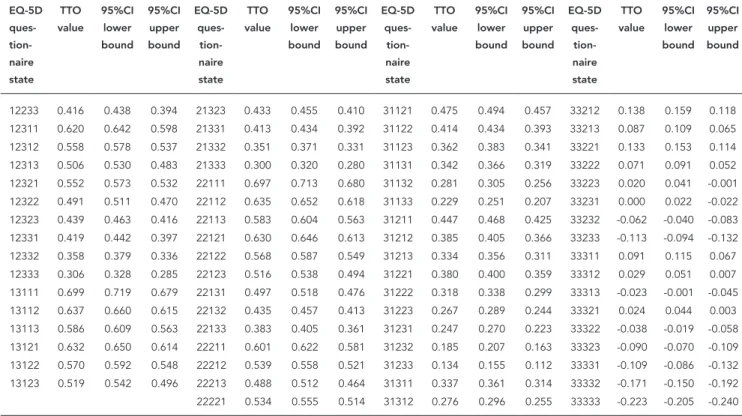
The full set of preference weights for the 243 EQ-5D health states estimated using the most parsimonious specification is given in Table 5. The results of estimated health parameters re-flect the high decreases in utility due to
mobil-ity problems. All the eleven worse-than-death health states present severe mobility problem in their composition. Twenty health states with the lowest mean estimated TTO values are char-acterized by the presence of this condition. This number more than doubles (to 46) when moder-ate mobility problem is also taken into account. Among the 95 health states with the highest TTO mean values only one presents severe mobil-ity problem but it is compensated by the ab-sence of moderate/severe problems in the other dimensions.
Discussion
Table 5
Estimated mean preference weights for 24 3EQ-5D questionnaire health states based on the random effect model (main effects model).
EQ-5D ques- tion-naire state
TTO value
95%CI lower bound
95%CI upper bound
EQ-5D
ques- tion-naire state
TTO value
95%CI lower bound
95%CI upper bound
EQ-5D
ques- tion-naire state
TTO value
95%CI lower bound
95%CI upper bound
EQ-5D
ques- tion-naire state
TTO value
95%CI lower bound
95%CI upper bound
11111 1.000 1.000 1.000 13131 0.499 0.521 0.478 22222 0.472 0.492 0.453 31313 0.224 0.246 0.202 11112 0.884 0.901 0.868 13132 0.437 0.461 0.413 22223 0.421 0.446 0.396 31321 0.270 0.292 0.249
11113 0.832 0.852 0.813 13133 0.386 0.407 0.364 22231 0.401 0.423 0.379 31322 0.209 0.228 0.189 11121 0.879 0.893 0.865 13211 0.604 0.625 0.583 22232 0.339 0.361 0.318 31323 0.157 0.179 0.135 11122 0.817 0.835 0.799 13212 0.542 0.563 0.521 22233 0.288 0.311 0.265 31331 0.137 0.162 0.113 11123 0.765 0.786 0.745 13213 0.490 0.514 0.466 22311 0.492 0.515 0.469 31332 0.076 0.098 0.053 11131 0.746 0.765 0.727 13221 0.537 0.556 0.518 22312 0.430 0.450 0.409 31333 0.024 0.044 0.004
11132 0.684 0.705 0.663 13222 0.475 0.495 0.455 22313 0.378 0.402 0.354 32111 0.421 0.441 0.401 11133 0.632 0.652 0.612 13223 0.423 0.447 0.400 22321 0.425 0.446 0.403 32112 0.359 0.379 0.340 11211 0.850 0.867 0.833 13231 0.404 0.424 0.383 22322 0.363 0.383 0.342 32113 0.308 0.328 0.287 11212 0.789 0.805 0.772 13232 0.342 0.363 0.321 22323 0.311 0.336 0.287 32121 0.354 0.373 0.335 11213 0.737 0.759 0.715 13233 0.290 0.311 0.270 22331 0.292 0.315 0.268 32122 0.292 0.312 0.272
11221 0.783 0.800 0.767 13311 0.494 0.518 0.471 22332 0.230 0.251 0.208 32123 0.241 0.262 0.220 11222 0.722 0.739 0.704 13312 0.432 0.455 0.410 22333 0.178 0.200 0.156 32131 0.221 0.245 0.197 11223 0.670 0.693 0.647 13313 0.381 0.405 0.356 23111 0.571 0.591 0.551 32132 0.159 0.184 0.134 11231 0.650 0.669 0.632 13321 0.427 0.448 0.406 23112 0.509 0.531 0.488 32133 0.108 0.130 0.086 11232 0.589 0.608 0.570 13322 0.365 0.386 0.344 23113 0.458 0.481 0.435 32211 0.326 0.347 0.304 11233 0.537 0.557 0.517 13323 0.314 0.337 0.291 23121 0.504 0.522 0.486 32212 0.264 0.283 0.244
11311 0.741 0.761 0.721 13331 0.294 0.316 0.272 23122 0.442 0.463 0.421 32213 0.212 0.235 0.190 11312 0.679 0.698 0.660 13332 0.232 0.254 0.211 23123 0.391 0.413 0.368 32221 0.259 0.279 0.238 11313 0.628 0.650 0.605 13333 0.181 0.200 0.161 23131 0.371 0.392 0.350 32222 0.197 0.217 0.177 11321 0.674 0.692 0.655 21111 0.818 0.833 0.803 23132 0.309 0.332 0.286 32223 0.145 0.168 0.122
11322 0.612 0.630 0.594 21112 0.756 0.772 0.740 23133 0.258 0.279 0.237 32231 0.126 0.150 0.101 11323 0.560 0.582 0.538 21113 0.705 0.724 0.685 23211 0.476 0.497 0.454 32232 0.064 0.087 0.041 11331 0.541 0.561 0.520 21121 0.751 0.766 0.736 23212 0.414 0.435 0.393 32233 0.012 0.035 -0.010 11332 0.479 0.499 0.459 21122 0.689 0.707 0.671 23213 0.362 0.387 0.338 32311 0.216 0.240 0.192 11333 0.427 0.447 0.408 21123 0.638 0.659 0.616 23221 0.409 0.429 0.389 32312 0.154 0.176 0.133
12111 0.825 0.840 0.809 21131 0.618 0.637 0.599 23222 0.347 0.367 0.327 32313 0.103 0.125 0.080 12112 0.763 0.780 0.745 21132 0.556 0.577 0.535 23223 0.295 0.320 0.271 32321 0.149 0.171 0.127 12113 0.711 0.731 0.691 21133 0.505 0.525 0.484 23231 0.276 0.297 0.255 32322 0.087 0.108 0.067 12121 0.757 0.773 0.742 21211 0.723 0.741 0.704 23232 0.214 0.235 0.193 32323 0.036 0.058 0.014 12122 0.696 0.715 0.677 21212 0.661 0.678 0.644 23233 0.162 0.183 0.141 32331 0.016 0.041 -0.009 12123 0.644 0.666 0.622 21213 0.609 0.632 0.586 23311 0.366 0.390 0.343 32332 -0.046 -0.023 -0.069
12131 0.624 0.645 0.604 21221 0.655 0.674 0.637 23312 0.305 0.327 0.282 32333 -0.097 -0.076 -0.118 12132 0.563 0.585 0.540 21222 0.594 0.612 0.575 23313 0.253 0.277 0.229 33111 0.296 0.317 0.274 12133 0.511 0.533 0.490 21223 0.542 0.566 0.518 23321 0.299 0.320 0.278 33112 0.234 0.256 0.211 12211 0.729 0.748 0.710 21231 0.522 0.543 0.502 23322 0.237 0.258 0.217 33113 0.182 0.204 0.161 12212 0.667 0.685 0.649 21232 0.461 0.480 0.441 23323 0.186 0.209 0.163 33121 0.229 0.248 0.209
12213 0.616 0.639 0.593 21233 0.409 0.431 0.388 23331 0.166 0.188 0.145 33122 0.167 0.188 0.145 12221 0.662 0.681 0.643 21311 0.613 0.634 0.592 23332 0.104 0.125 0.084 33123 0.115 0.136 0.095 12222 0.600 0.619 0.581 21312 0.551 0.570 0.532 23333 0.053 0.072 0.033 33131 0.096 0.119 0.072 12223 0.549 0.573 0.525 21313 0.500 0.523 0.477 31111 0.542 0.562 0.523 33132 0.034 0.059 0.009 12231 0.529 0.550 0.508 21321 0.546 0.566 0.526 31112 0.481 0.501 0.461 33133 -0.018 0.003 -0.038
12232 0.467 0.488 0.446 21322 0.484 0.503 0.465 31113 0.429 0.450 0.408 33211 0.200 0.222 0.178
Table 5 (continued)
EQ-5D ques- tion-naire state
TTO value
95%CI lower bound
95%CI upper bound
EQ-5D
ques- tion-naire state
TTO value
95%CI lower bound
95%CI upper bound
EQ-5D
ques- tion-naire state
TTO value
95%CI lower bound
95%CI upper bound
EQ-5D
ques- tion-naire state
TTO value
95%CI lower bound
95%CI upper bound
12233 0.416 0.438 0.394 21323 0.433 0.455 0.410 31121 0.475 0.494 0.457 33212 0.138 0.159 0.118 12311 0.620 0.642 0.598 21331 0.413 0.434 0.392 31122 0.414 0.434 0.393 33213 0.087 0.109 0.065 12312 0.558 0.578 0.537 21332 0.351 0.371 0.331 31123 0.362 0.383 0.341 33221 0.133 0.153 0.114
12313 0.506 0.530 0.483 21333 0.300 0.320 0.280 31131 0.342 0.366 0.319 33222 0.071 0.091 0.052 12321 0.552 0.573 0.532 22111 0.697 0.713 0.680 31132 0.281 0.305 0.256 33223 0.020 0.041 -0.001 12322 0.491 0.511 0.470 22112 0.635 0.652 0.618 31133 0.229 0.251 0.207 33231 0.000 0.022 -0.022 12323 0.439 0.463 0.416 22113 0.583 0.604 0.563 31211 0.447 0.468 0.425 33232 -0.062 -0.040 -0.083 12331 0.419 0.442 0.397 22121 0.630 0.646 0.613 31212 0.385 0.405 0.366 33233 -0.113 -0.094 -0.132 12332 0.358 0.379 0.336 22122 0.568 0.587 0.549 31213 0.334 0.356 0.311 33311 0.091 0.115 0.067
12333 0.306 0.328 0.285 22123 0.516 0.538 0.494 31221 0.380 0.400 0.359 33312 0.029 0.051 0.007 13111 0.699 0.719 0.679 22131 0.497 0.518 0.476 31222 0.318 0.338 0.299 33313 -0.023 -0.001 -0.045 13112 0.637 0.660 0.615 22132 0.435 0.457 0.413 31223 0.267 0.289 0.244 33321 0.024 0.044 0.003 13113 0.586 0.609 0.563 22133 0.383 0.405 0.361 31231 0.247 0.270 0.223 33322 -0.038 -0.019 -0.058 13121 0.632 0.650 0.614 22211 0.601 0.622 0.581 31232 0.185 0.207 0.163 33323 -0.090 -0.070 -0.109
13122 0.570 0.592 0.548 22212 0.539 0.558 0.521 31233 0.134 0.155 0.112 33331 -0.109 -0.086 -0.132 13123 0.519 0.542 0.496 22213 0.488 0.512 0.464 31311 0.337 0.361 0.314 33332 -0.171 -0.150 -0.192 22221 0.534 0.555 0.514 31312 0.276 0.296 0.255 33333 -0.223 -0.205 -0.240
95%CI: 95% confidence interval; EQ-5D: EuroQol five-dimensional; RE: random effect.
Independently of severity levels of the other EQ-5D dimensions, the highest decrements in utili-ties are associated to severe mobility problems at around 40%. On the other hand, the highest TTO mean values are given to health states without any mobility problem. These results are also veri-fied when the analysis is disaggregated by current individual health condition pointing out that health preferences do not depend on a disabling illness previously experienced by individuals.
The comparison with other countries valua-tion can give some clues as to whether these re-sults are specific to the Brazilian population. In South America, only Argentina and Chile have thus far derived a set of social preference weights for use with EQ-5D 26,38. In Chile, unlike Brazil,
decreases in health utility are associated with lev-el of severity independently of the EQ-5D health dimension. The decrements are around 30-35% for all dimensions except anxiety/depression where the decrease is around 25%. In Argentina, individuals tend to assign higher importance to three dimensions: mobility, self-care and pain/ discomfort. In this country, utility decrements are higher to health conditions presenting severe problems in mobility followed by the other two aforementioned dimensions.
The understanding of societal preferences for health states is important especially taking
into account the aging population process that Brazil has experienced. Some studies on lon-gevity and health have shown that gains in life expectancy are not accompanied by an exten-sion of life expectancy free of disabilities. In fact, gains in longevity have increased the number of years of life experiencing some chronic dis-eases or disabilities 48. The results of the present
paper reinforce the debate about the uncritical use of new health technologies that only affect the extension of life. New health technologies in-crease the survival of individuals but at the same time can have negative effects on wellbeing by increasing the prevalence of morbidities. Our re-sults give evidences that health preferences of the Brazilian population are strongly affected by the prevalence of severe health problems in es-pecial mobility conditions.
National Committee for Incorporation of Tech-nologies in SUS (CONITEC) was founded under
Federal Law n. 12,401/11. All new technologies that will be supplied in the public healthcare system must be evaluated by CONITEC. This is a great advancement for Brazilian legislation since cost-effectiveness parameters are now taken into account to determine the incorporation of new technologies. One challenge for this Committee is to consider the HTA health outcomes that take into account quality of life measures. The gains in longevity are not a guarantee to improve an individual’s wellbeing.
It is important to notice that the sample of this study includes only individuals aged less than 64 years old and living in urban areas of Minas Ge-rais. As the prevalence of severe health problems is high among the elderly population, the exclu-sion of this age group can generate biased results. However the direction of the bias is not conclu-sive. The experience with severe health problems may affect individual evaluations in both direc-tions. On the one hand, individuals with some severe health problems may be more adapted
to their conditions and hence give higher scores to severe health states in the TTO exercise. On the other hand as these individuals know better about the difficulties of living with restrictions, their scores may be lower.
The Minas Gerais EQ-5D study takes sever-al steps forward from the design of the originsever-al MVH protocol. First, to the best of our knowl-edge this is only the second occasion that a larger number of health states (102) were directly inves-tigated in a household survey using the TTO ex-ercise. Secondly, it is the first time that only nine health states are evaluated per individual. This innovation makes the evaluation exercise less demanding and individuals will be more likely to give responses that are not subject to fatigue or loss of attention. Finally, a large sample is in-vestigated in a very heterogeneous population with representativeness for three different geo-graphical areas. Hence, this study design allows the investigation of individual heterogeneity and differences among subgroups of the population in evaluating the health status using identical valuation procedures.
Resumen
Este estudio analiza cómo las diferentes dimensiones de la salud, definidas por el instrumento EQ-5D-3L, afec-tan, en promedio, las preferencias individuales por los estados de salud. Este análisis es un punto de referencia para la incorporación de tecnologías en salud, ya que hace posible considerar las preferencias de la poblaci-ón brasileña en las decisiones sobre la asignacipoblaci-ón de recursos de salud. El EQ-5D define la salud en cinco di-mensiones (movilidad, actividades habituales, cuidado personal, dolor/malestar y ansiedad/depresión) con tres niveles de severidad. Los datos provienen de una inves-tigación inédita en Brasil, que entrevistó a 3.362 perso-nas entre 18 y 64 años y que viven en zoperso-nas urbaperso-nas de Minas Gerais. Los principales resultados muestran que la disminución en la utilidad de los individuos aumen-ta con el nivel de severidad. Con respecto a las dimen-siones de salud, la movilidad se destaca como la más importante. Independientemente de los niveles de seve-ridad de las otras dimensiones, los mayores decremen-tos en la utilidad están asociados con graves problemas de movilidad.
Años de Vida Ajustados por Calidad de Vida; Evaluación en Salud; Evaluación de Tecnologías de Salud
Contributors
M. V. Andrade coordinated the data collection; interpre-ted the data, carried out statistical analysis and drafinterpre-ted the manuscript. K. V. M. S. Noronha co-coordinated the data collection; interpreted data, carried out statistical analysis, drafted and provided critical revision for the manuscript. A. C. Maia and P. Kind contributed to the overall study conception, interpretation of data and the critical revision of the manuscript.
Acknowledgments
These findings are the result of work supported by FAPEMIG. The views expressed in this paper are those of the authors, and no official endorsement by FAPEMIG is intended or should be inferred.
Conflict of interest
References
1. Eisenberg JM. Ten lessons for evidence-based technology assessment. JAMA 1999; 282:1865-9. 2. Battista RN, Hodge MT. The evolving paradigm of
health technology assessment: reflections for the millennium. CMAJ 1999; 160:1464-7.
3. Suen RMH. Technological advance and the growth in health care spending. Philadelphia: Economie d’Avant Garde; 2005. (Economie D’Avant Garde Research Report, 13).
4. Australian Government Productivity Commission. Impacts of advances in medical technology in Aus-tralia. Melbourne: Australian Government Produc-tivity Commission; 2005. (ProducProduc-tivity Commis-sion Research Report).
5. Aaron HJ, Schwartz WB, Cox M. Can we say no?: the challenge of rationing health care. Washington DC: Brookings Institution Press; 2005.
6. Okunade AA, Murthy VNR. Technology as a “major driver” of health care costs: a cointegration analy-sis of the Newhouse conjecture. J Health Econ 2002; 21:147-59.
7. Zarate V, Espinoza M, Castilho-Riquelme M. Eva-luaciones económicas de tecnologías sanitarias: una perspectiva global para su aplicación en Ame-rica Latina. Rev Peru Med Exp Salud Pública 2011; 28:535-9.
8. Nita ME, Secoli SR, Nobre M, Ono-Nita SK. Mé-todos de pesquisa em avaliação de tecnologia em saúde. Arq Gastroenterol 2009; 46:252-5.
9. Área de Economia da Saúde e Desenvolvimento, Secretaria Executiva, Ministério da Saúde. Avalia-ção de tecnologias em saúde: ferramentas para a gestão do SUS. Brasília: Ministério da Saúde; 2009. 10. Silva LK. Avaliação tecnológica em saúde: densito-metria óssea e terapêuticas alternativas na osteo-porose pós-menopausa. Cad Saúde Pública 2003; 19:987-1003.
11. Banta HD, Luce BR. Health care technology and its assessment: an international perspective. New York: Oxford University Press; 1993.
12. Área de Economia da Saúde e Desenvolvimento, Secretaria Executiva, Ministério da Saúde. Avalia-ção econômica em saúde: desafios para a gestão no Sistema Único de Saúde. Brasília: Ministério da Saúde; 2008.
13. Jackson TJ. Health technology assessment in Australia: challenges ahead. Med J Aust 2007; 187:263-4.
14. Neumann PJ. Using cost-effectiveness analysis to improve health care: opportunities and barriers. New York: Oxford University Press; 2005.
15. Hailey DM. Health technology assessment in Canada: diversity and evolution. Med J Aust 2007; 187:286-8.
16. Rodríguez-Wong LL, Carvalho JAM. O rápido pro-cesso de envelhecimento populacional do Brasil: sérios desafios para as políticas públicas. Rev Bras Estud Popul 2006; 23:5-26.
17. Carvalho JAM, Rodríguez-Wong LL. A transição da estrutura etária da população brasileira na primei-ra metade do século XXI. Cad Saúde Pública 2008; 24:597-605.
18. Berenstein CK, Wajnman S. Efeitos da estrutura etária nos gastos com internação no Sistema Úni-co de Saúde: uma análise de deÚni-composição para duas áreas metropolitanas brasileiras. Cad Saúde Pública 2008; 24:2301-13.
19. Ugá MAD Santos IS. An analysis of equity in Bra-zilian health system financing. Health Aff 2007; 26:1017-28.
20. Hurley J. An overview of the normative economics of the health sector. In: Culyer AJ, Newhouse JP, ed-itors. Handbook of health economics. Amsterdam: Elsevier; 2000. p. 55-118.
21. Drummond MF, Sculpher MJ, Torrance GW, O’Brien BJ, Stoddart GL. Methods for the econom-ic evaluation of health care programmes. 3rd Ed. New York: Oxford University Press; 2005.
22. Gold MR, Siegel JE, Russell LB, Weinstein MC. Cost-effectiveness in health and medicine. New York: Oxford University Press; 1996.
23. Murray CJL, Evans DB, Acharya A, Baltussen RM-PM. Development of who guidelines on general-ized cost-effectiveness analysis. Health Econ 2000; 9:235-51.
24. Klarman HJ, Francis J, Rosenthal G. Cost-effective analysis applied to the treatment of chronic renal disease. Med Care 1968, 6:46-54.
25. Robberstad B. QALYs vs DALYs vs LYs gained: what are the differences, and what difference do they make for health care priority setting? Nor Epide-miol 2005; 15:183-91.
26. Augustovski FA, Irazola VE, Velasquez AP, Gibbons L, Craig BM. Argentine valuation of the EQ-5D health states. Value Health 2009; 12:587-96. 27. Brazier JE, Harper R, Jones NMB, O’Cathain A,
Thomas T, Usherwood T, et al. Validating the SF-36 health survey questionnaire: new outcome mea-sure for primary care. BMJ 1992; 305:160-4. 28. Cruz LN, Camey SA, Hoffmann JF, Rowen D,
Bra-zier JE, Fleck MP, et al. Estimating the SF-6D value set for a population-based sample of Brazilians. Value Health 2011; 14(5 Suppl 1):S108-14.
29. EuroQol: a new facility for the measurement of health-related quality of life. The EuroQol Group. Health Policy 1990; 16:199-208.
30. Kind P, Herdman M, Gudex C, Lloyd A, Janssen MF, Parkin D, et al. Development and preliminary test-ing of the new five-level version of EQ-5D (EQ-5D-5L). Qual Life Res 2011; 20:1727-36.
31. Stevens KJ, Brazier JE, McKenna SP, Doward LC, Cork MJ. The development of a preference-based measure of health in children with atopic dermati-tis. Br J Dermatol 2005; 153:372-7.
32. Zarate V, Kind P, Chuang L-H. Hispanic valuation of the EQ-5D health states: a social value set for Latin Americans. Value Health 2008; 11:1170-7. 33. National Institute for Health and Clinical
Excel-lence. Guide to the methods of technology ap-praisal. London: National Institute for Health and Clinical Excellence; 2008.
35. Lamers LM, McDonnell J, Stalmeier PF, Krabbe PF, Busschbach JJ. The Dutch tariff: results and argu-ments for an effective design for national EQ-5D valuation studies. Health Econ 2006; 15:1121-32. 36. Shaw JW, Johnson JA, Coons SJ. US valuation of the
EQ-5D health states: development and testing of the D1 valuation model. Med Care 2005; 43:203-20.
37. Lee YK, Nam HS, Chuang LH, Kim KY, Yang HK, Kwon IS, et al. South Korean time trade-off values for EQ-5D health states: modeling with observed values for 101 health states. Value Health 2009; 12:1187-93.
38. Zarate V, Kind P, Valenzuela P, Vignau A, Olivares-Tirado P, Munoz A. Social valuation of EQ-5D health states: the Chilean case. Value Health 2011; 14:1135-41.
39. Janssen MF, Pickard AS, Golicki D, Gudex C, Niewa-da M, Sacalone L, et al. Measurement properties of the EQ-5D-5L compared to the EQ-5D-3L across eight patient groups: a multi-country study. Qual Life Res 2012; [Epub ahead of print].
40. Andrade MV, Noronha K, Kind P, Maia AC, Mene-zes RM, Reis CB, et al. Societal preferences for EQ-5D health states from a Brazilian population sur-vey. Value in Health Regional Issues; in press. 41. Programa das Nações Unidas para o
Desenvolvi-mento. Atlas do desenvolvimento humano no Bra-sil. Brasília: Programa das Nações Unidas para o Desenvolvimento; 2003.
42. Kind P. A revised protocol for the valuation of health states defined by the EQ-5D-3L classifica-tion system: learning the lessons from the MVH study. New York: Centre for Health Economics, University of York; 2009.
43. Gudex C. Time trade-off user manual: props and self-completion method. New York: Centre for Health Economics, University of York; 1994. 44. Dolan P. Modeling valuations for health states: the
effect of duration. Health Policy 1996; 38:189-203. 45. Chuang LH, Kind P. The effect of health state
selec-tion on the valuaselec-tion of EQ-5D. Med Decis Making 2010; 31:186-94.
46. Greene WH. Econometric analysis. 5th Ed. Upper Saddle River: Prentice Hall; 2003.
47. Instituto Brasileiro de Geografia e Estatística. Pes-quisa Nacional por Amostra de Domicílios, PNAD 2008. Rio de Janeiro: Instituto Brasileiro de Geo-grafia e Estatística; 2008.
48. Romero DE, Leite IC, Szwarcwald CL. Healthy life expectancy in Brazil: applying the Sullivan meth-od. Cad Saúde Pública 2005; 21 Suppl:S7-18. 49. Amorim FF, Ferreira Júnior PN, Faria ER, Almeida
KJQ. Avaliação de tecnologias em saúde: contex-to histórico e perspectivas. Comun Ciênc Saúde 2010; 21:343-8.
Submitted on 31/Jan/2013