Article
J. Braz. Chem. Soc., Vol. 25, No. 9, 1614-1620, 2014. Printed in Brazil - ©2014 Sociedade Brasileira de Química 0103 - 5053 $6.00+0.00
A
*e-mail: [email protected]; [email protected]
Electrocatalytic Detection of Glutathione - the Search for New Mediators
Denise Lowinsohn,*,a Patricia T. Leeb and Richard G. Compton*,b
aDepartmento de Química, Instituto de Ciências Exatas, Universidade Federal de Juiz de Fora,
36036-330 Juiz de Fora-MG, Brazil
bDepartment of Chemistry, Physical and Theoretical Chemistry Laboratory, University of Oxford,
South Parks Road, OX1 3QZ Oxford, United Kingdom
Nesse trabalho é reportada a possibilidade de usar diferentes mediadores tais como acetaminofeno, 4-aminofenol, 4-amino-2,6-diclorofenol e 4-amino-2,6-difenilfenol para detectar glutationa usando eletrodo de pasta de nanocarbono. A detecção é baseada na resposta eletrocatalítica envolvendo quinoneiminas geradas eletroquimicamente e a glutationa. O 4-aminofenol é o recomendado como sendo o mediador mais sensível visto que o limite de detecção obtido para glutationa 0,80 µmol L−1 foi o menor.
We report the possibility to use different mediators such as acetaminophen, 4-aminophenol, 4-amino-2,6-dichlorophenol and 4-amino-2,6-diphenylphenol to detect glutathione using a nanocarbon paste electrode. The detection is based on the electrocatalytic response involving the electrochemically generated quinoneimines and glutathione. 4-aminophenol is recommended as the most sensitive mediator in terms of giving the lowest limit detection of 0.80 µmol L−1.
Keywords: nanocarbon paste electrode, acetaminophen, 4-aminophenol,
4-amino-2,6-dichlorophenol, 4-amino-2,6-diphenylphenol, glutathione
Introduction
Glutathione is the most prevalent cellular thiol and the most abundant low-molecular-weight peptide present in cells. In the human body, the antioxidant properties of glutathione are well recognized.1 Glutathione acts as an
antioxidant, participating in detoxification for xenobiotics and metabolism of numerous cellular compounds.2,3
Changes in glutathione concentration at the cellular level have been measured and linked to diseases such as cardiovascular diseases, aging, Parkinson’s disease, Alzheimer’s disease, diabetes and cancer.4-7
Currently, the most popular method of detection of glutathione is based on high performance liquid chromatography (HPLC) because of its high sensitivity and selectivity.8-10 However, HPLC based methods have
some disadvantages such as low response, the need for sample preparation, high cost and complaints of use. Electroanalytical methods11 have also been cited using
modified electrodes12,13 and mediators.14-16 The purpose of this
paper is to identify a range of different mediators that can be
used to detect glutathione using a nanocarbon paste electrode. One of these mediators is acetaminophen and its reaction with glutathione is based on electrocatalytic response involving the electrochemically generated ortho-quinone and the target (Scheme 1).16 Similar mechanisms undergo
the use of the other mediators studied in this paper.
The use of nanocarbon as an electrode material has recently been proposed offering similar advantages to other carbon electrodes but at close to zero cost.17-20 The advantages
of using nanocarbon as an alternative electrode modifier for
use in adsorptive stripping voltammetry were reported by Lo et al..17 In this case, the nanocarbon particles were cast
onto a glassy carbon electrode. Lowinsohn et al.18 investigated
the electrochemical behaviour of nanocarbon paste electrodes prepared by mixing nanocarbon and mineral oil. In this paper, we explore the electrocatalytic reaction between different mediators in order to detect glutathione using unmodified and modified nanocarbon paste. The electrocatalytic reaction between catechol and glutathione, cysteine, homocysteine and ascorbic acid using nanocarbon paste electrodes were investigated in a previous paper.21
Experimental section
Chemicals
Acetaminophen or paracetamol (C8H9NO2, Aldrich,
98%), glutathione (C10H17N3O6S, Sigma-Aldrich),
potassium phosphate dibasic (K2HPO4, Aldrich), potassium
phosphate monobasic (KH2PO4, Sigma), nanocarbon
particles (diameter 27 ± 10 nm, Monarch 430®, Cabot
Performance), mineral oil (Aldrich) were used as received without further purification. Phosphate buffer solution (PBS) was prepared using the adequate amount of K2HPO4
and KH2PO4 salts. All solutions were prepared using
deionised water of resistivity not less than 18.2 MΩ cm at 25 °C (Millipore, Billerica, MA, USA). Prior to experiments, all solutions were purged through nitrogen (N2, BOC, Surrey) to remove oxygen from the system.
Instrumental
All electrochemical experiments were conducted at (25 ± 1) °C using an Autolab (Eco Chimie, Utrecht, The Netherlands), with a standard three-electrode configuration consisting of nanocarbon or nanocarbon-acetaminophen paste as a working electrode, a graphite rod as a counter electrode and a saturated calomel electrode (SCE) as reference electrode. All experiments were performed at least three times.
Preparation of nanocarbon and nanocarbon-acetaminophen paste electrode
Nanocarbon paste: the carbon paste was prepared by hand pasting nanocarbon with mineral oil (55:45) using a pestle and mortar.18 The pastes were kept at room
temperature until used.
Nanocarbon-acetaminophen pastes: acetaminophen solution was prepared with a certain amount (ca. 10 mg) of solid acetaminophen dissolved in acetone. Acetaminophen
is not soluble in mineral oil so acetone is employed to initially dissolve it. Nanocarbon-acetaminophen paste electrodes were prepared by hand pasting nanocarbon with mineral oil and an aliquot of acetaminophen solution using a pestle and mortar.
For both pastes, unmodified and acetaminophen-modified, the material was packed into the well of the working electrode to a depth of 1 mm (Scheme 2). The surface exposed to the solution was polished using a weighing paper to give a smooth finish before use. The body of the working electrode was a Teflon tube tightly packed with the carbon paste. The electrical contact was provided by a copper wire.
Results and Discussion
Electrochemical behaviour of acetaminophen in a presence of glutathione at nanocarbon paste electrode
Acetaminophen (APAP) is electrochemically oxidized in a pH-dependent, 2-electron, 2-proton process to
N-acetyl-p-quinoneimine (NAPQI) (Figure 1, curve a). In a previous paper,18 we characterized the electrochemical
behaviour of acetaminophen at nanocarbon paste electrode, obtaining the formal potentials and kinetics parameters for the acetaminophen oxidation using BASi DigiSim Simulation Software.
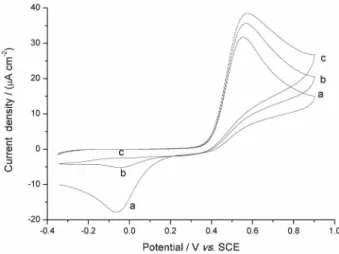
In order to investigate the characterization of the reaction between the electrochemically generated quinone and glutathione, an experiment was carried out at a nanocarbon paste electrode using cyclic voltammetry (100 mV s−1). Figure 1 shows the cyclic voltammograms
obtained in acetaminophen solution in absence (curve a) and presence of 50 µmol L−1 (curve b) and 100 µmol L−1 of
glutathione (curve c). Figure 1, curve a, shows the oxidation of acetaminophen and the addition of glutathione (curves b and c) led to an increase in the height of the oxidation peak and a decrease in the magnitude of the reduction peak
indicating an electrocatalytic reaction (Scheme 1).16 In this
reaction, the acetaminophen undergoes an electrochemical oxidation to form quinone, which mediates the reduction of glutathione species, RSH, to a disulfide, RSSR. An analytical curve was obtained by plotting oxidation (Figure 2a) and reduction peak (Figure 2b) current against the concentration of glutathione. The results show that it is possible to quantify glutathione in both situations, but in the case of reduction peak, the detection is limited by the initial concentration of acetaminophen.
To increase the sensitivity of glutathione detection, square wave voltammetry was utilized. The experiment was carried out in the presence of 10 µmol L−1 acetaminophen
(PBS, pH 7.5) using frequency at 10 Hz, step potential at 15 mV and amplitude at 50 mV. Figure 3 shows the square wave voltammograms of the APAP oxidation (a) and NAPQI reduction (b) in a presence of different concentrations of glutathione at nanocarbon paste electrode.
An analytical curve was obtained by plotting oxidation and reduction peak current against the concentration of glutathione. The results obtained with square wave voltammetry are consistent with the results obtained with cyclic voltammetry. The analytical curve obtained for oxidation peak in a range between 0 to 5 µmol L−1
(i/A (µA cm-2) = 0.0622[GSH] (µmol L−1)) was less sensitive
that one obtained for reduction peak in a range between 0 to 7.2 µmol L−1 (i/A (µA cm-2) = 0.14[GSH] (µmol L−1)),
showing that the best way to quantify glutathione is to use the reduction. The limit of detection calculated using reduction peak was (0.96 ± 0.03) µmol L−1.
Acetaminophen in nanocarbon paste: a reagentless approach
A possible useful alternative to the method reported above is the use of acetaminophen mixed with nanocarbon paste to create a reagentless sensor. In this case, the
Figure 1. Cyclic voltammograms of 100 µmol L−1 acetaminophen solution
in PBS (pH 7.5) in the absence (a) and presence of 50 µmol L−1 (b) and
100 µmol L−1 (c) glutathione using nanocarbon paste electrode. Scan
rate = 100 mV s−1.
Figure 2. Calibration curve: (a) oxidation peak and (b) reduction peak against glutathione concentration using a nanocarbon paste electrode. [Acetaminophen] = 100 µmol L−1.
experiment requires only the presence of the target to provide a signal and after polishing the paste and washed free of analyte, the sensor is ready for reuse.
Different percentages of acetaminophen dissolved in the paste (0.3, 0.6, 1, 2, 4 and 10%) were used to make the paste electrode. Figure 4 shows cyclic voltammetric responses for 1% nanocarbon-acetaminophen paste in PBS (pH 7.5) at 100 mV s−1. In this case, similar electrochemical behaviour
to acetaminophen in solution was observed. Three scans with the same paste are presented in Figure 4, showing that the electrode surface area is not reproducible (standard deviation is between 51 to 66%); this is probably due to the low amount of acetaminophen in the paste generating limited homogeneity. Because of this irreproducible signal from electrode to electrode, the absolute height of the oxidation or reduction peak cannot be used (without standard additions). To solve this problem, we decided to measure the ratiobetween the oxidation (Io) and reduction
(Ir) peak currents instead of working with absolute current
values. Using this method, the standard deviation was 3% (n = 9).
Figure 5 shows the analytical curve for glutathione response obtained with different percentages of acetaminophen dissolved in the paste. From the results obtained, we can conclude that nanocarbon paste with percentages of acetaminophen between 0.3% and 1% can quantify glutathione up to approximately 14 µmol L−1 and
between 2% and 10% only more than 10 µmol L−1. This
happens due to the limitation on the amount of acetaminophen dissolved into the paste. The limits of detection calculated for the different pastes were (1.68 ± 0.05) µmol L−1 (0.3%),
(1.05 ± 0.05) µmol L−1 (0.6%), (1.09 ± 0.05) µmol L−1
(1%), (4.79 ± 0.19) µmol L−1 (2%), (1.89 ± 0.08) µmol L−1
(4%) and (23.8 ± 1.2) µmol L−1 (10%). These results
show that the nanocarbon-acetaminophen paste electrode is efficient to quantify glutathione. This modified paste electrode has the advantage that is a reagentless sensor in comparison of nanocarbon paste electrode. However the latter, using acetaminophen in solution, gives a lower limit of detection.
Electrochemical behaviour of 4-aminophenol in the presence of glutathione at nanocarbon paste electrode
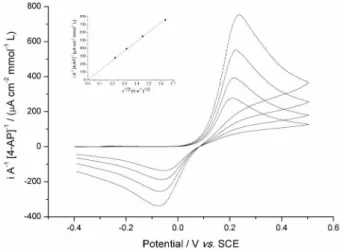
The next mediator tested was 4-aminophenol (4-AP), the primary hydrolytic degradation product of paracetamol.22 First, cyclic voltammograms (Figure 6) were
obtained in a solution containing 4-aminophenol and PBS (pH 7.5) using nanocarbon paste electrode at different scan rates (50-400 mV s−1).
Figure 4. Cyclic voltammetric responses for 1% acetaminophen dissolved in the nanocarbon paste in PBS (pH 7.5) at 100 mV s−1. Three scans with
the same paste.
Figure 5. Calibration curve for glutathione at (a) 0.3%, (b) 0.6%, (c) 1%, (d) 2%, (e) 4% and (f) 10% acetaminophen dissolved in nanocarbon paste electrode in PBS (pH 7.5) at 100 mV s−1.
Similar to paracetamol, the process in this case is attributed to the two-electron oxidation of 4-AP to the corresponding quinone species:
The inset in Figure 6 shows that the peak current increased linearly with the square root of scan rate, suggesting a diffusional process of 4-AP at this electrode. The 4-AP diffusion coefficient value was estimated as being 4.62 × 10⁻⁶ cm2 s−1. This is consistent with the value found
in the literature (4.55 × 10⁻⁶ cm2 s−1).23
In order to investigate the reaction between the electrochemically generated quinone and glutathione, an experiment was carried out at a nanocarbon paste electrode using cyclic voltammetry (100 mV s−1). The cyclic
voltammograms obtained in 4-AP solution in absence of glutathione show only the oxidation of 4-AP. The addition of glutathione led to an increase in the height of the oxidation peak and a decrease in the magnitude of the reduction peak indicating an electrocatalytic reaction, resulting in a similar behaviour observed of the reaction with acetaminophen.
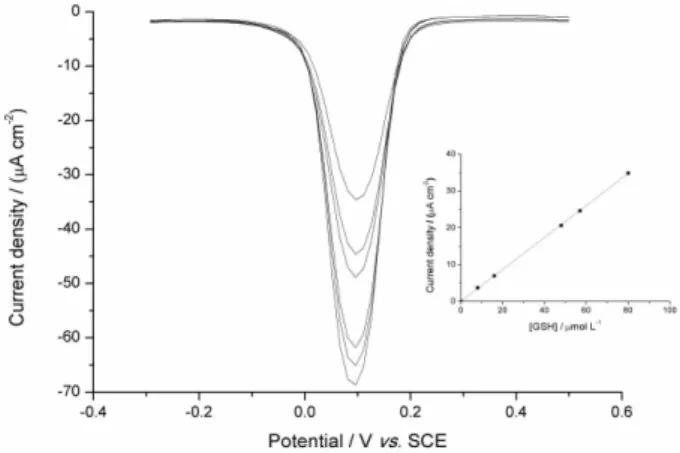
The square wave voltammetry was also used. The experiment was carried out in the same conditions mentioned above. Figure 7 shows the square wave voltammograms of 4-quinoimine reduction in a presence of different concentrations of glutathione at nanocarbon paste electrode. The analytical curve obtained (inset Figure 7) in a range between 0 to 14.8 µmol L−1 was
i/A (µA cm-2) = 0.174[GSH] (µmol L−1) and the limit of
detection calculated was (0.80 ± 0.03) µmol L−1, showing
that it is also possible to use 4-AP as a mediator to detect glutathione.
Electrochemical behaviour of 4-amino-2,6-dichlorophenol in the presence of glutathione at nanocarbon paste electrode
The mediator 4-amino-2,6-dichlorophenol was next used to detect glutathione. In order to quantify GSH, the square wave voltammetry was carried out in the same conditions mentioned above. Figure 8 shows the square wave voltammograms of different concentrations of glutathione at nanocarbon paste electrode. The analytical curve obtained (inset Figure 8) in a range between 0 to 80.0 µmol L−1
was i/A (µA cm-2) = 0.434[GSH] (µmol L−1) and the
limit of detection calculated was (11.0 ± 0.4) µmol L−1,
demonstrating that it is also possible to use 4-amino-2,6-dichlorophenol as a mediator to detect glutathione.
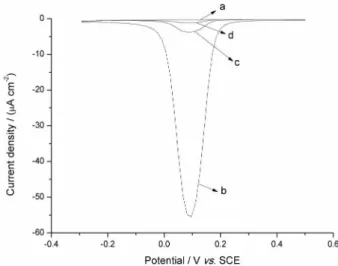
In a parallel experiment, it was observed that 4-amino-2,6-dichlorophenol accumulated inside the paste as shown in Figure 9. This was studied by obtaining square wave voltammograms in a 40 µmol L−1
4-amino-2,6-dichlorophenol solution in the same conditions mentioned above. The voltammogram in Figure 9b corresponds to the reduction of quinone on a nanocarbon paste electrode. After that, the electrode was washed and transferred to PBS solution and the voltammogram in Figure 9c was obtained, where a clear reduction signal is seen. Then, the electrode was polished and transferred to PBS solution and the voltammogram in Figure 9d was obtained, where a little reduction signal is observed. Therefore, in this case, it is not possible to reuse the same paste after one experiment.
The same behaviour was observed when we used 4-amino-2,6-diphenyphenol (Figure 10). Cyclic voltammograms were obtained in a 0.2 mmol L−1
4-amino-2,6- diphenylphenol solution and the voltammogram in Figure 10b corresponds to the oxidation of 4-amino-2,6-diphenylphenol on a nanocarbon paste electrode. After that, the electrode was washed and
Figure 7. Square wave voltammograms of the 4-quinoneimine in a presence of different concentrations of glutathione (0-14.8 µmol L−1)
at nanocarbon paste electrode. Inset: analytical curve obtained. [4-aminophenol] = 20 µmol L−1.
transferred to PBS solution and the voltammogram in Figure 10c was obtained, where a signal is seen, related to the 4-amino-2,6-diphenylphenol adsorbed into the paste. Then, the electrode was polished and transferred to PBS solution and the voltammograms in Figure 10d was obtained, where a signal was observed, also associated to 4-amino-2,6-diphenylphenol accumulated into the paste. For this reason, in this case, it is not possible to reuse the same paste after one experiment without surface renewal.
Conclusions
In this paper, we described the possibility of using different mediators such as acetaminophen, 4-aminophenol and, dichlorophenol and
4-amino-2,6-Figure 9. Square wave voltammograms in PBS (pH 7.5) (a) in the presence of 40 µmol L−1 solution of 4 amino-2,6-dichlorophenol (b), after scan in
4-amino-2,6-dichlorophenol solution (c) and after polishing the electrode at nanocarbon paste electrode (d).
Figure 10. Cyclic voltammograms in PBS (pH 7.5) (a) in the presence of 0.2 mmol L−1 solution of 4 amino-2,6-diphenylphenol (b), after scan in
4-amino-2,6-diphenylphenol solution (c) and after polishing the electrode at nanocarbon paste electrode (d).
diphenylphenol to detect glutathione using a nanocarbon paste electrode. Using 4-aminophenol as a mediator in solution, we obtained the lowest limit of detection, (0.80 ± 0.03) µmol L−1, for glutathione. This value is
comparable with the other limit of detection obtained with different mediators such as catechol (0.94 µmol L−1),14
caffeic acid (2.2 µmol L−1)12 and 3,4-dihydroxy-cinnamic
acid (0.194 µmol L−1).24 We also investigated the preliminary
accumulation of 2,6-dichlorophenol and 4-amino-2,6-diphenylphenol inside the nanocarbon paste electrode, showing the possibility to explore the modification of the electrode with theses mediators.
Acknowledgements
D. Lowinsohn thanks CAPES (Process 10080-12-0) for a post-doctoral fellowship.
References
1. Deneke, S. M.; Fanburg, B. L.; Am. J. Phys.1989, 257, L163. 2. Filomeni, G.; Rotilio, G.; Ciriolo, M. R.; Biochem. Pharmacol.
2002, 64, 1057.
3. Moran, L. K.; Gutteridge, J. M.; Quinlan, G. J.; Curr. Med. Chem.2001, 8, 763.
4. Pastore, A.; Federici, G.; Bertini, E.; Piemonte, F.; Clin. Chim. Acta2003, 333, 19.
5. Smeyne, M.; Smeyne, R. J.; Free Radical Bio. Med.2013, 62, 13.
6. Traverso, N.; Ricciarelli, R.; Nitti, M.; Marengo, B.; Furfaro, A. L.; Pronzato, M. A.; Marinari, U. M.; Domenicotti, C.; Oxi. Med. Cell. Longev.2013, 2013, 1.
7. Liu, H. L.; Wang, H.; Shenvi, S.; Hagen, T. M.; Liu, R.-M.;
Ann. N. Y. Acad. Sci.2004, 1019, 346.
8. Ferina, R.; Pavão, M. L.; Baptista, J.; J. Chromatogr. B 2012,
911, 15.
9. Squellerio, I.; Caruso, D.; Porro, B.; Veglia, F.; Tremoli, E.; Cavalca, V.; J. Pharmaceut. Biomed.2012, 71, 111.
10. Conlan, X. A.; Stupka, N.; McDermott, G. P.; Francis, P. S.; Barnett, N. W.; Biomed. Chromatogr. 2010, 24, 455.
11. Harfield, J. C.; Batchelor-McAuley, C.; Compton, R. G.; Analyst 2012, 137, 2285.
12. Lee, P. T.; Compton, R. G.; Electroanal.2013, 25, 1613. 13. Lee, P. T.; Ward, K. R.; Tschulik, K.; Chapman, G.; Compton,
R. G.; Electroanal.2014, 26, 366.
14. Seymour, E. H.; Wilkins, S. J.; Lawrence, N. S.; Compton, R. G.; Anal. Lett.2002, 35, 1387.
15. White, P. C.; Lawrence, N. S.; Davis, J.; Compton, R. G.;
Electroanal.2002, 14, 89.
17. Lo, T. W. B.; Aldous, L.; Compton, R. G.; Sensor Actuat. B-Chem.2012, 162, 361.
18. Lowinsohn, D.; Gan, P.; Tschulik, K.; Foord, J. S.; Compton, R. G.; Electroanal.2013, 25, 2435.
19. Gan, P.; Lowinsohn, D.; Foord, J. S.; Compton, R. G.;
Electroanal.2014, 26, 351.
20. Hocevar, S. B.; Ogorevc, B.; Talanta2007, 74, 405.
21. Lowinsohn, D.; Lee, P. T.; Compton, R. G.; Int. J. Electrochem. Sci.2014, 9, 3458.
22. Bloomfield, M. S.; Talanta2002, 580, 1301.
23. Zhang, X.; Wang, S.; Shen, Q.; Microchim. Acta2005, 149, 37. 24. Keyvanfard, M.; Karimi-Maleh, H.; Alizad, K.; Chin. J. Catal.
2013, 34, 1883.
Submitted on: April 15, 2014