O
RIGINALA
RTICLE Revista Brasileira de FisioterapiaRepeatability of spatiotemporal gait parameters:
comparison between normal children and
children with hemiplegic spastic cerebral palsy
Repetibilidade dos parâmetros espaço-temporais da marcha: comparação entre
crianças normais e com paralisia cerebral do tipo hemiplegia espástica
Dini PD1, David AC2
Abstract
Objective: To evaluate the repeatability of spatiotemporal gait parameters by means of a comparative study between normal children and children with cerebral palsy (CP). Methods: The sample consisted of 17 children divided into two groups: a group of nine children with spastic hemiplegia CP and a group of eight normalchildren. The children were evaluated by the same researcher in two different sessions, with a one-week interval between the sessions. The children walked at self-selected velocities, and six attempts were performed at each session to represent the average. To record the spatiotemporal parameters, the Peak Motus system was used with two SVHS video cameras with an acquisition rate of 60 Hz. The intra-class correlation coefficient (ICC) and Bland-Altman concordance limits were chosen for data analysis. Results: The results demonstrated that the children with CP presented lower velocity and shorter cycles than the normal children in sessions 1 and 2. For all the spatiotemporal parameters, the two groups presented moderate to excellent ICC values, i.e. greater than 0.70. Conclusion: It can be concluded that the two groups presented good levels of repeatability for all the parameters analyzed when six attempts were used to represent the average.
Key words: gait; children; cerebral palsy; repeatability.
Resumo
Objetivo: Avaliar a repetibilidade das medidas dos parâmetros espaço-temporais da marcha por meio de um estudo comparativo entre crianças normais e crianças com paralisia cerebral (PC). Métodos: A amostra foi composta por 17 crianças divididas em dois grupos: um grupo de nove crianças com PC do tipo hemiplegia espástica e um grupo com oito crianças normais que foram avaliadas pelo mesmo pesquisador em duas sessões diferentes, com intervalo de uma semana entre as sessões. As crianças caminharam em velocidade autosselecionada e foram utilizadas seis tentativas nas sessões 1 e 2 para representar a média. Para registro dos parâmetros espaço-temporais, foi utilizado o sistema Peak Motus, com duas câmeras de vídeo SVHS com taxa de aquisição de 60 Hz. Coeficiente de correlação intraclasse (ICC) e limites de concordância de Bland-Altman foram escolhidos para análise dos dados.
Resultados: Os resultados demonstraram que as crianças com PC apresentaram menor velocidade e comprimento do ciclo do que as crianças normais para as sessões 1 e 2. Para todos os parâmetros espaço-temporais, os dois grupos apresentaram valores de ICC de
excelentes a moderados, ou seja, maior do que 0,70. Conclusão: Pode-se concluir que os dois grupos apresentaram níveis bons de
repetibilidade para todos os parâmetros analisados quando seis tentativas foram utilizadas para representar a média.
Palavras-chave: marcha; crianças; paralisia cerebral; repetibilidade.
Received: 01/06/2008 – Revised:27/09/2008 – Accepted: 22/01/2009
1 Department of Physical Therapy, Centro Universitário UNIEURO, Brasília (DF), Brazil 2 Department of Physical Therapy, Universidade de Brasília (UNB), Brasília (DF), Brazil
Correspondence to: Patrícia de Deus Dini, QE 19 Conjunto C, Casa 20, Guara II, CEP 71050-033, Brasília (DF), Brazil, e-mail: [email protected]
Introduction
Cerebral palsy (CP) is a chronic disorder that afects move-ment and posture and results from damage to an immature brain due to various pre-, peri- and post-natal factors. his kind of injury to the neurological system usually leads to abnormal motor control. Children with CP have a series of disturbances, such as muscle weakness, sensory loss and spasticity. hese neuromusculoskeletal disorders afect upright stance, balance, and the ability to walk. As a consequence, gait performance in these children is poor when compared to that of normal children, leading to diiculties in carrying out daily and even leisure activities1-4.
he current techniques of three-dimensional gait analysis allow a quantitative description of lower limb movements during gait. hus, there is a better understanding of the biome-chanics of normal human gait, which makes it possible to bet-ter identify the disorders and therefore assess them objectively. his analysis has played a signiicant role in the treatment of CP because it helps in decision-making with regard to clinical practice and also in the evaluation of the results of therapeu-tic interventions given that improving these children’s gait pattern is one of the goals of the treatment5-7. Spatiotemporal parameters are often used to evaluate gait development in chil-dren and to identify potential disorders. he analysis of these parameters, in addition to evaluating aspects of pathological gait, also quantiies post-surgical improvement or conservative treatment8,9. Nevertheless, in order to make evidence-based decisions concerning the treatment of patients with gait dis-orders, it is necessary to evaluate the repeatability of these parameters10-13.
Repeatability can be deined as the agreement between results within a short period of time, by the same examiner and using the same instrumentation14. Generally, gait evaluation data are based on the collection of attempts recorded during a single visit of the patients to the laboratory and compared to the data of the control-subjects, that is, without compromising the gait pattern. It is extremely important to ensure that these values represent the child’s locomotion pattern. Kadaba et al.15 found good levels of repeatability for the spatiotemporal pa-rameters in normal adults, by using the mean of three attempts to the gait cycle. Stolze et al.9 found excellent repeatability for normal adults for all spatiotemporal gait parameters using a mean of 15 attempts to the gait cycle, whereas normal chil-dren showed a greater variation. he authors claim that there is a lower repeatability of these parameters for children when compared to adults. herefore, the aim of the present work is to verify, by means of a comparative study, the repeatability of the spatiotemporal gait parameters in normal children and in children with CP.
Methods
he type of study design chosen was the controlled cross-sectional type.
Subjects
he sample consisted of two groups of children aged six to 13, selected in a non-probabilistic manner according to accessibility. One group was composed of nine children (six male and three female) with a previous clinical diagnosis of spastic hemiplegia CP and treated at the Child Rehabilitation Center of Universidade Católica de Brasília. he second group was composed of eight normal children (two boys and six girls) recruited by relatives and friends of the study’s super-vising researcher. he children’s guardians were informed by the researcher concerning the purpose and importance of the study and signed a consent form. Ten children with CP and ten normal children were initially selected to take part in the study. One child with CP withdrew from the study and was not able to complete it. Two children from the control group did not take part in the study because they did not receive paren-tal permission. herefore, at the end of the study, the sample totaled 17 subjects.
To be included in the study, the children had to be six to 13 years old with preserved cognition so that they could un-derstand the instructions. he children with CP also had to be able to execute an independent gait, without being aided in the locomotion or making use of orthoses, and have a previous clinical diagnosis of spastic hemiplegia CP with grade 1 spas-ticity in the Ashworth scale. he criterion for exclusion for the normal children were a clinical history of neurologic or muscu-loskeletal problems. For the children with CP, it was orthopedic surgery up to one year before taking part in the present study. he study was approved by the Research Ethics Committee of the Faculty of Health Sciences of Universidade de Brasília, on July 28, 2006, under the protocol number 033/2006.
Procedures for collection
he data collection itself consisted in ilming each child on two diferent days, called session 1 and session 2, with a 1-week interval between sessions to obtain the spatiotemporal gait pa-rameters. he data collection for each child was carried out at the same time of the day on both sessions. For the gait analysis, the Peak Motus system, version 7.2.6 (Peak Performance Inc.), was used with two high-frequency SVHS video cameras, with a 60 Hz acquisition rate. he cameras were placed 5 meters from the subject’s sagittal plane, with a minimal convergence angle between them, following the procedures established for
dimensional movement reconstruction and in accordance with the Direct Linear Transformation (DLT) method.
Upon arrival at the laboratory, the children and their guard-ians were allowed to familiarize themselves with the environ-ment where the collection was to take place. Afterwards, each child was instructed to put on a swimsuit. he children were evaluated barefoot to eliminate any inluence caused by the shoes. hen, each child had their height measurement taken, and external relexive markers were placed onto the upper and posterior part of the calcaneus, on the axis of the foot, bilaterally, for subsequent calculation of the spatiotemporal parameters. he height measurements were used for the nor-malization of the variables of the study16,17.
As the collection was being carried out, the children were instructed to walk along a 10m path, at a self-determined speed. he irst attempt was discarded and the six following valid attempts were selected for data processing. he choice of the irst six attempts was carried out to avoid the efects of fatigue, especially in children with CP. For the analysis proce-dures, the mean of the six attempts from the irst session and from the second session was calculated. All of the subjects were evaluated by the same examiner in both sessions. he data from the video images were processed by the Peak Mo-tus software. he right and left points of the calcaneus were selected for conversion into digital form. Based on these two points, it is possible to calculate the spatiotemporal variables of the gait cycle, both for the right and left sides (or plegic and nonplegic sides). In order to avoid conversion errors, the co-ordinates were iltered through a 4th order Butterworth digital ilter (in the temporal domain) on the rough coordinates of interest to the subject, with a cutof frequency set at 6 Hz be-cause good results have been found with this kind of ilter for kinematic gait data18.
he variables analyzed in the present study were stride and gait cycle length, cadence, total gait cycle, total stance phase, swing phase, and velocity. he values for gait cycle length, stride length, total gait cycle, total stance phase, swing phase and velocity were described based on absolute and normalized values. he parameters obtained for gait cycle length, stride length and velocity were normalized according to each child’s height, i.e. we obtained the ratio of absolute values to subject height. he parameters for time were normalized according to the gait cycle.
Statistical analysis
he software Statistical Package for the Social Science (SPSS) version 13.0 was used to carry out the statistical treat-ment. he Shapiro-Wilk test was used for the distribution analysis of the values for each sample to determine whether
the values had a normal distribution. Levene’s test was applied to test the homogeneity of the variances. When the analysis obtained through these two tests resulted in p>0.05, paramet-ric tests were carried out to compare the groups; however, if the analysis resulted in a p value lower than 0.05, either for the normality test or for the variance homogeneity test, non-parametric tests were carried out for the comparisons.
To characterize the sample selected for the study, proce-dures from descriptive statistics were used (mean ± standard deviation), and afterwards, the due inferences were made. To compare the measurements of the intragroup spatiotemporal parameters, either the parametric paired t test or the non-para-metric Wilcoxon test was used. For the intergroup compari-son of the same variables, we used the t test for independent samples or the non-parametric Mann-Whitney test. he level of signiicance adopted was p<0.05.
he information about the repeatability of the data ob-tained from each group of patients was analyzed by means of two procedures associated with the concordance index be-tween measurement replicas:
a) Intraclass Correlation Coeicient (ICC): for this calculation, the two-way mixed model was chosen, with a conidence interval of 95%. To interpret the ICC values, we used the value scale suggested by Menz et al.19. Values greater than 0.75 show excellent repeatability; values between 0.40-0.75, moderate/fair repeatability, and values lower than 0.40 in-dicate poor repeatability.
b) Bland-Altman method: this method was used to deine the magnitude of agreement between the measurement values of days 1 and 2 of the test. A limit agreement of 95% was chosen. When limits of agreement are calculated, “D” rep-resents the mean diference between the subjects for the variables measured on days 1 and 2; “SD diference” repre-sents the standard deviation of the diferences of the vari-ables measured on days 1 and 2. he limits of agreement set at 95% are calculated as D ± (SD diference multiplied by 2). he coeicients of repeatability recommended by Bland-Altman assume that the mean diference between the attempts is equal to zero. Nevertheless, the limits of agreement which indicate a good repeatability are also part of the researcher’s judgment20-22.
Results
he results obtained in the present study will be presented according to the following evaluated parameters: gait cycle length, stride length, velocity, cadence, gait cycle, stance phase, and swing phase. Intra- and intergroup comparisons were made by using the mean of six attempts of the gait cycle.
Inter- and intragroup comparison
Table 1 shows the data for the sample’s age and stature, grouped by the presence or absence of CP.
Table 2 shows the spatiotemporal gait parameters: velocity, cadence, gait cycle, stance phase, swing phase, and gait cycle length (absolute data) for both normal and CP children when the means of six attempts in sessions 1 and 2 are compared.
Table 3 displays the normalized values for velocity, stance phase, swing phase and gait cycle length for normal and CP children when the means of six attempts in sessions 1 and 2 are compared.
Table 4 shows the values for the comparison between the stride on the plegic side of the children with CP and the right stride of normal children (absolute and normalized data). It also shows the values for the comparison of the plegic and nonplegic stride length of children with CP (absolute and nor-malized data) when the means of six attempts on days 1 and 2 are compared.
Repeatability
Tables 5 and 6 show values for the repeatability of the spatiotemporal gait parameters: velocity, cadence, gait cycle
phase, stance phase, swing phase, and gait cycle length (abso-lute data) for the normal and CP children when the mean of six attempts made on days 1 and 2 are compared.
Table 7 shows the repeatability values for stride length on the plegic side of children with CP and stride length on the right side of normal children (absolute data) when the mean of six attempts made on days 1 and 2 are compared.
Discussion
he aim of the present study was to evaluate the spa-tiotemporal gait parameters from two days of tests, compar-ing normal children with CP children and uscompar-ing the mean of six attempts of the gait cycle. he indings show that for all spatiotemporal parameters, both groups had excellent to moderate ICC values, i.e., greater than 0.70. Because the mea-surement of these parameters constitutes an important tool for decision-making in clinical practice with CP patients, it is very important to ensure that these data reproduce the lo-comotion pattern of these children, thus generating accurate data for gait evaluation.
No statistically signiicant diferences were found (p>0.05) when comparing the means of the age and height variables between the normal and the CP groups. his is evidence that the sample was homogeneous. For intergroup comparisons, signiicant diferences (p<0.05) were found for velocity, both in the normalized and in the absolute values, in sessions 1 and 2, between normal children and those with CP. he normal chil-dren walked at a higher velocity.
hese results corroborate the study on gait maturation by Sutherland et al.23. he authors claim that the maturation of the Central Nervous System (CNS) contributes to the evolution of gait, and that the increase in velocity is proportional to the level of maturation. Because children with CP have a lesion in
Table 1. Mean (SD) and p-value for age and stature of normal and
CP subjects.
Normal (N=8) CP (N=9) p
Age (years) 9.13 (3.04) 8.89 (3.14) 0.89
Height (m) 1.32 (0.16) 1.30 (0.15) 0.86
p value is a result of the t test. Significant difference between normal and CP at p<0.05.
Table 2. Mean (SD) of spatiotemporal parameters (absolute values)
measured in two sessions with the mean of six gait attempts for normal and CP children.
Spatiotemporal
Parameters Session Normal CP
Velocity (m/s) 1 1.03 (0.14) Aa 0.81 (0.15) Ba
2 1.01 (0.14) Aa 0.81 (0.13) Ba
Cadence (strides/min)
1 124.89 (14.89) Aa 112.43 (15.98) Aa
2 119.18 (8.06) Aa 114.36 (14.07) Aa
Gait cycle time (s) 1 0.97 (0.11) Aa 1.09 (0.14) Aa
2 1.01 (0.07) Aa 1.06 (0.13) Aa
Stance phase (s) 1 0.61 (0.08) Aa 0.66 (0.09) Aa
2 0.64 (0.04) Aa 0.65 (0.09) Aa
Swing phase (s) 1 0.37 (0.04) Aa 0.43 (0.06) Ba
2 0.37 (0.04) Aa 0.42 (0.06) Aa
Stride length (m) 1 1.00 (0.18) Aa 0.87 (0.15) Aa
2 1.02 (0.18) Aa 0.85 (0.15) Aa
Means with different capital letters on the same line (inter-group comparison) or different small letters in the same column (intra-group comparison), for each gait parameter, differ statistically (p<0.05).
Table 3. Mean (SD) of spatiotemporal parameters (normalized values),
measured in two sessions, with the mean of six gait attempts for normal and CP children.
Spatiotemporal
parameters Sessions Normal CP
Velocity (m/s/height) 1 0.78 (0.07) Aa 0.62 (0.11) Ba
2 0.76 (0.05) Aa 0.62 (0.11) Ba
Stance phase (% of cycle)
1 62.34 (2.36) Aa 60.91 (2.09) Aa
2 63.56 (1.86) Ab 60.68 (3.14) Ba
Swing phase (% of cycle)
1 37.66 (2.36) Aa 39.08 (2.07) Aa
2 36.44 (1.86) Ab 39.34 (3.15) Ba
Gait cycle length (% of height)
1 75.95 (6.79) Aa 66.88 (5.83) Ba
2 77.20 (6.66) Aa 65.23 (6.67) Ba
Means with different capital letters on the same line (inter-group comparison) or different small letters in the same column (intra-group comparison) for each gait parameter differ statistically (p<0.05).
the CNS and changes in motor development, they are expected to have lower gait velocities.
Steinwender et al.24 also found a lower velocity in children with CP when compared with normal children. he values
found were 1.33 m/s and 1.24 m/s for normal children and chil-dren with CP, respectively. he authors justify that the limita-tion of movement in children with CP due to spasticity may be a contributing factor for the reduced velocity. Spasticity is the
Table 4. Mean (SD) of stride length (absolute and normalized values) measured in two sessions, with the mean of six gait attempts for normal and
CP children.
Session Normal CP
Right stride (m) Plegic stride (m) Nonplegic stride (m)
Absolute values (m) 1 0.52 (0.09) Aa 0.44 (0.08) Aa 0.44 (0.08) Aa
2 0.53 (0.09) Aa 0.43 (0.08) BCa 0.43 (0.08) Ca
Normalized values (% of height) 1 38.87 (3.41) Aa 33.50 (2.88) BCa 33.70 (3.70) Ca
2 39.78 (3.99) Aa 32.50 (3.49) BCa 32.73 (3.39) Ca
Means with different capital letters on the same line (inter-group comparison) or different small letters in the same column (intra-group comparison) for each parameter differ statistically (p<0.05).
Table 5. Difference between means (D), SD of differences (SD diff.), Bland-Altman limits of agreement (LOA), intra-class correlation coefficient
(ICC) and 95% confidence interval (CI) for repeatability of absolute values of normal children for spatiotemporal parameters when the mean of six gait attempts on days 1 and 2 are compared.
Spatiotemporal parameters D SD diff. Limits of agreement Bland and Altman 95% (LOA) LOA range ICC [95% CI]
Correlation
Velocity (m/s) 0.03 0.09 0.18 [-0.15; 0.20] 0.35 0.8 [0.29; 0.96]
Cadence (strides/min) 5.5 8.47 16.94 [-11.10; 22.10] 33.20 0.74 [0.14; 0.94]
Gait cycle time (s) -0.03 0.06 0.12 [-0.16; 0.08] 0.24 0.76 [0.19; 0.95]
Stance phase (s) -0.04 0.05 0.10 [-0.12; 0.05] 0.65 0.72 [0.11; 0.94]
Swing phase (s) -0.01 0.02 0.04 [-0.05; 0.04] 0.09 0.85 [0.42; 0.97]
Gait cycle length (m) -0.02 0.05 0.10 [-0.11; 0.08] 0.19 0.96 [0.83; 0.99]
D = the mean difference in each parameter between days 1 and 2 for all subjects. SD diff. = the standard deviation for the differences in each parameter between days 1 and 2 for all subjects.
Table 7. Difference between means (D), SD of differences (SD diff.), Bland-Altman limits of agreement (LOA), intra-class correlation coefficient
(ICC) and 95% confidence interval (CI) for repeatability of absolute values of normal and CP children for the parameter of right stride length (normal children) and plegic stride length (CP children) when the mean of six gait attempts on days 1 and 2 are compared.
Spatiotemporal parameters D SD diff. Limits of agreement Bland-Altman 95% (LOA) LOA range ICC [95% CI]
Correlation
Right stride (m) -0.01 0.03 0.06 [-0.07; 0.04] 0.11 0.96 [0.80; 0.99]
Plegic stride (m) 0.01 0.04 0.08 [-0.06; 0.09] 0.15 0.89 [-0.09; 0.88]
D = the mean difference in each parameter between days 1 and 2 for all subjects. SD diff. = the standard deviation for the differences in each parameter between days 1 and 2 for all subjects.
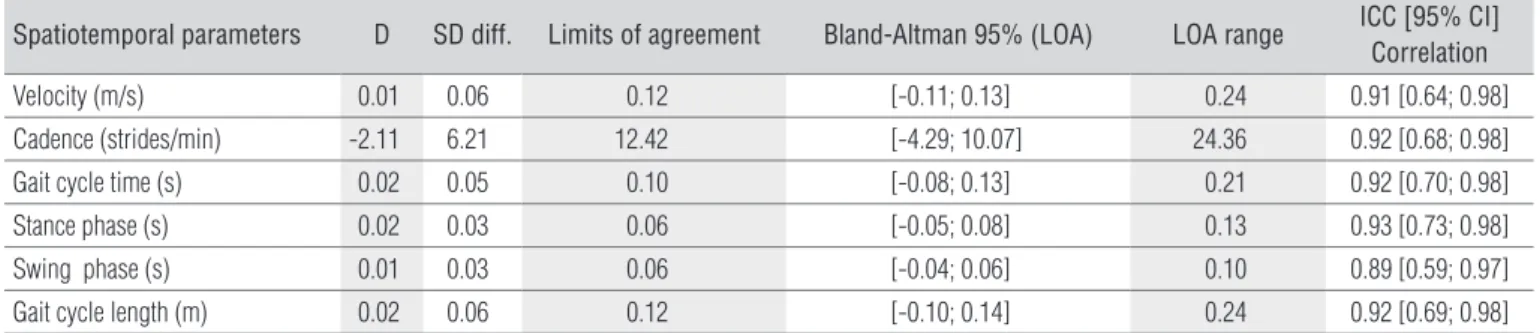
Table 6. Difference between means (D), SD of differences (SD diff.), Bland-Altman limits of agreement (LOA), intra-class correlation coefficient
(ICC) and 95% confidence interval (CI) for repeatability of absolute values of CP children for spatiotemporal parameters when the mean of six gait attempts on days 1 and 2 are compared.
Spatiotemporal parameters D SD diff. Limits of agreement Bland-Altman 95% (LOA) LOA range ICC [95% CI]
Correlation
Velocity (m/s) 0.01 0.06 0.12 [-0.11; 0.13] 0.24 0.91 [0.64; 0.98]
Cadence (strides/min) -2.11 6.21 12.42 [-4.29; 10.07] 24.36 0.92 [0.68; 0.98]
Gait cycle time (s) 0.02 0.05 0.10 [-0.08; 0.13] 0.21 0.92 [0.70; 0.98]
Stance phase (s) 0.02 0.03 0.06 [-0.05; 0.08] 0.13 0.93 [0.73; 0.98]
Swing phase (s) 0.01 0.03 0.06 [-0.04; 0.06] 0.10 0.89 [0.59; 0.97]
Gait cycle length (m) 0.02 0.06 0.12 [-0.10; 0.14] 0.24 0.92 [0.69; 0.98]
D = the mean difference in each parameter between days 1 and 2 for all subjects. SD diff. = the standard deviation for the differences in each parameter between days 1 and 2 for all subjects.
result of a pathological increase in muscle tonus, hyperrelexia and loss of inhibitory control of antagonist muscles. It is gener-ally accompanied by other motor dysfunctions such as lack of coordination, weakness, muscle atrophy, loss of control of se-lective movements, dexterity, and co-contraction25. his is also in agreement with the results found in the present study. Abel and Damiano26 found higher velocity values in normal children compared to children with spastic diplegia CP. his reinforces the hypothesis that associates the impairment of CP children and the execution of activities such as walking. Pirpiris et al.27 state that gait velocity is reduced in proportion to the subject’s degree of motor impairment and that one of the features of patients with neuromuscular disorders is lower velocity. Raimundo et al.28,in their study on gait velocity in normal chil-dren aged four to six, found values of 1.03 m/s (absolute) and 0.90 m/s/height (normalized).
With regard to gait cycle length, only the normalized values showed signiicant diferences between the groups on both days of tests, with shorter gait cycle lengths for the children with CP. he diferences in gait cycle length between normal and CP children may be related to a lack of stability of the sup-porting limb which is found in the CP children, due to changes in motor development, as well as limitations in range of motion in joints such as the hip, knee, and ankle. he children in the present study had been diagnosed with hemiplegia, which is characterized by motor deicit and unilateral spasticity that afects the upper and lower limbs contralateral to the afected brain hemisphere. he hemiplegic child moves preferably by favoring their normal hemibody and has a deicit in body align-ment, which makes it diicult to transfer the weight onto the afected side and justiies the present indings2,29. Steinwender et al.30 also found higher values for velocity and gait cycle length in normal children when compared with those with CP. Abel and Damiano26 used three attempts of the gait cycle to calculate the mean and found that, for normalized values, the children with CP had a shorter gait cycle length than the normal children.
he total stance phase comprises the sum of the simple and double stance phases. he duration of the limb’s stance phase is an indicator of stability. A reduction of this period during the gait cycle may result from muscular fatigue or a lack of motor control23. Diferences were found between the groups for the normalized stance phase in session 2 with a shorter duration for children with CP. his may be explained by a reduction in the simple stance phase of the plegic limb because these chil-dren often have muscle weakness and favor the nonplegic limb, as described previously. Although the statistical diference only occurred on the second day of testing, which may be a sign of variability, it was noted that on the irst day the children with CP also scored lower means for the duration of the stance phase.
In their study on children with CP, Sorsdahl, Moe-Nilssen and Strand8 state that the simple stance phase of the plegic limb is shorter than the duration of the simple stance phase of the nonplegic limb. Abel and Damiano26 found greater values for the duration of the stance phase and lower values for the swing phase in normal children.
For the stride length with normalized values, there was a signiicant diference between the stride length of normal chil-dren and the length of the plegic stride of chilchil-dren with CP on both days. However, for the absolute values, only the second day of tests showed a signiicant diference for this parameter. his result once again reinforces the presence of changes in the motor development presented by CP children in relation to normal children, and shows some degree of gait impairment.
With regard to the intragroup comparison, only the nor-malized values for the stance phase and for the swing phase had signiicant diferences between the two days of testing for the group of normal children, which did not occur for the CP children. his diference may be justiied by the subject’s natural variability because normal children, having better motor control, also have a more extensive motor repertoire and a greater capacity to change the locomotor pattern. Stolze et al.9 found signiicant diferences between the two days of testing for normal children, but only in the duration of the stance phase. he authors explain that this slight reduc-tion in the stance phase may have been caused by a marginal increase in the velocity on the second day of testing due to the subject’s familiarization with the protocol. In the present study, there was a slight increase in the duration of the stance phase, which can also be explained by the small reduction in velocity on the second day of testing. Mackey et al.3 evaluated the spatiotemporal parameters of children with hemiplegic CP and with approximately the same age as those of the pres-ent study. he authors claim they did not ind any signiicant diferences between parameters of stride length, gait cycle length, cadence and velocity, which is in agreement with the results of the present study.
According to the results, the ICC showed excellent levels of repeatability for all parameters analyzed when comparing the mean of six attempts on the two days of testing, except for the stance phase and cadence of the normal children who had moderate repeatability. Nevertheless, the Bland-Altman method exhibited acceptable variations in the limits of agree-ment for all the parameters analyzed, which indicates a good repeatability of the data. While analyzing the repeatability of the spatiotemporal gait parameters of normal children, horpe, Dusing and Moore22 found levels of repeatability for children aged four to eight, i.e. ICC values ranging from moderate to ex-cellent: velocity (0.74), cadence (0.84), stride length (0.82) and gait cycle length (0.81). For children aged eight to 11, they found
a level of repeatability ranging from poor to excellent: velocity (0.73), cadence (0.93), stride length (0.40) and gait cycle length (0.41). he authors explained that the poor level of repeatability in stride and gait cycle length for this age group may be due to the fact that these children felt more at ease on the second day of tests, which caused them to walk faster.
Although the ICC values had excellent levels of repeat-ability for most of the parameters, the normal children had a tendency to score lower ICC values than the children with CP. he justiication may be based on the fact that children with CP have less freedom of movement, hence a smaller natural variability in their locomotion pattern, which increases their capacity to reproduce the same movement at each new ses-sion. In the gait analysis of children with CP aged two to 15, Sorsdahl, Moe-Nilssen and Strand8, although they used a difer-ent protocol, they found excelldifer-ent repeatability, i.e. great levels of ICC for the following variables: cadence (0.94), length of the plegic stride (0.95), gait cycle length (0.94), and simple stance phase (0.89). Maynard et al.31 suggest that a minimum of three
gait cycles may be used as a mean when one wants to evaluate the repeatability. Nevertheless, Steinwender et al.24 compared the repeatability of gait in normal children, as well as in chil-dren with CP using the mean of ten attempts, and both groups showed high variability.
Conclusions
he results showed that the children with CP had lower ve-locity and gait cycle length values when compared to the nor-mal children in sessions 1 and 2. Both the nornor-mal children and those with CP had an excellent to moderate repeatability for all the parameters analyzed. Considering the results obtained in this study, it can be concluded that the gait parameters recorded in the laboratory with a one-week interval have suf-icient repeatability and serve as a comparative reference for normal children as well as children with spastic hemiplegia CP, when six attempts are used.
1. Bobath K. Uma base neurofisiológica para o tratamento da paralisia
cerebral. 2a ed. São Paulo: Manole; 1984.
2. Yokochi K, Yokochi M, Kodama K. Motor function of infants with spastic
hemiplegia. Brain Dev. 1995;17(1):42-8.
3. Mackey AH, Walt SE, Lobb GA, Stott SN. Reliability of upper and lower
limb three-dimensional kinematics in children with hemiplegia. Gait Posture. 2005;22(1):1-9.
4. O’Byrne JM, Jenkinson A, O’Brien TM. Quantitative analysis and
classification of gait patterns in cerebral palsy using a three-dimensional motion analyser. J Child Neurol. 1998;13(3):101-8.
5. DeLuca PA, Davis RB 3rd, Ounpuu S, Rose S, Sirkin R. Alterations in surgical decision making in patients with cerebral palsy based on
three-dimensional gait analysis.J Pediatr Orthop. 1997;17(5):608-14.
6. Doderlein L, Wolf S. Der stellenwert der instrumentellen ganganalyse bei
der infantilen zerebralparese. Orthopade. 2004;33(10):1103-18.
7. Gage JR. Gait analysis. An essential tool in the treatment of cerebral palsy.
Clin Orthop Relat Res.1993;288:126-34.
8. Sorsdahl AB, Moe-Nilssen R, Strand LI. Test-retest reliability of spatial and temporal gait parameters in children with cerebral palsy as measured by an electronic walkway. Gait Posture. 2008;27(1):43-50.
9. Stolze H, Kuhtz-Buschbeck JP, Mondwurf C, Johnk K, Friege L. Retest reliability of spatiotemporal gait parameters in children and adults. Gait Posture. 1998;7(2):125-30.
10. Bruton A, Conway JH, Holgate ST. Reliability: what is it, and how is it measured? Physioterapy. 2000;86(2):94-9.
11. Barker S, Craik R, Freedman W, Herrmann N, Hillstrom H. Accuracy, reliability, and validity of a spatiotemporal gait analysis system. Med Eng Phys. 2006;28(5):460-7.
12. Kirkpatrick M, Wytch R, Cole G, Helms P. Is the objective assessment of cerebral palsy gait reproducible? J Pediatr Orthop. 1994;14(6):705-8.
13. Skaggs DL, Rethlefsen SA, Kay RM, Dennis SW, Reynolds RA, Tolo VT. Variability in gait analysis interpretation. J Pediatr Orthop. 2000;20(6): 759-64.
14. Agência Nacional de Vigilância Sanitária - ANVISA. Guia para validação de métodos analíticos e bioanalíticos. Resolução RE nº 899, de 29/05/2003.
15. Kadaba MP, Ramakrishnan HK, Wootten ME, Gainey J, Gorton G, Cochran GV. Repeatability of kinematic, kinetic, and electromyographic data in normal adult gait. J Orthop Res. 1989;7(6):849-60.
16. O’Malley MJ. Normalization of temporal-distance parameters in pediatric gait. J Biomech. 1996;29(5):619-25.
17. Stansfield BW, Hillman SJ, Hazlewood ME, Lawson AM, Mann AM, Loudon IR, et al. Normalisation of gait data in children. Gait Posture. 2003;17(1):81-7.
18. David AC. Aspectos biomecânicos do andar em crianças: cinemática e cinética. [Tese].Santa Maria (RS). Universidade Federal de Santa Maria – UFSM; 2000.
19. Menz HB, Latt MD, Tiedemann A, Mun San Kwan M, Lord SR. Reliability of the GAITRite walkway system for the quantification of temporo-spatial parameters of gait in young and older people. Gait Posture. 2004;20(1):20-5.
221
20. Bland JM, Altman DG. Statistical methods for assessing agreement between two methods of clinical measurement. Lancet. 1986;1(8476):307-10.
21. Monaghan K, Delahunt E, Caulfield B. Increasing the number of gait trial recordings maximises intra-rater reliability of the CODA motion analysis
system.Gait Posture. 2007;25(2):303-15.
22. Thorpe DE, Dusing SC, Moore CG. Repeatability of temporospatial gait measures in children using the GAITRite electronic walkway. Arch Phys Med Rehabil. 2005;86(12):2342-6.
23. Sutherland DH, Olshen R, Cooper L, Woo SL. The development of mature gait. J Bone Joint Surg Am. 1980;62(3):336-53.
24. Steinwender G, Saraph V, Scheiber S, Zwick EB, Uitz C, Hackl K. Intrasubject repeatability of gait analysis data in normal and spastic children. Clin Biomech (Bristol, Avon). 2000;15(2):134-9.
25. Fonseca LF, Pianetti G, Xavier CC. Compêndiodeneurologiainfantil. Rio
de Janeiro: Guanabara Koogan; 2002.
26. Abel MF, Damiano DL. Strategies for increasing walking speed in diplegic cerebral palsy. J Pediatr Orthop. 1996;16(6):753-8.
27. Pirpiris M, Wilkinson AJ, Rodda J, Nguyen TC, Baker RJ, Nattrass GR, et al. Walking speed in children and young adults with neuromuscular
disease: comparison between two assessment methods.J Pediatr Orthop.
2003;23(3):302-7.
28. Raimundo AKS, Dini PD, David AC, Moreira D. Comparação da velocidade da marcha de crianças saudáveis em dois ambientes. Efdeportes [periódico da internet]. 2006 Agosto. [ acesso em 20/08/2007; 11(99):[aproximadamente 3p]. Disponível em: URL: http://www. efdeportes.com/efd99/marcha.htm
29. Chagas EF, Tavares MCGCF.A simetria e transferência de peso do
hemiplégico: relação dessa condição com o desempenho de suas atividades funcionais. Rev Fisioter Univ São Paulo. 2001;8(1): 40-50.
30. Steinwender G, Saraph V, Zwick EB, Steinwender C, Linhart W. Hip
locomotion mechanisms in cerebral palsy crouch gait. Gait Posture.
2001;13(2):78-85.
31. Maynard V, Bakheit AM, Oldham J, Freeman J. Intra-rater and inter-rater reliability of gait measurements with CODA mpx30 motion analysis system. Gait Posture. 2003;17(1):59-67.