O
RIGINALA
RTICLE Revista Brasileira de FisioterapiaUse of electromyography to assess pain in
the upper trapezius and lower back muscles
within a fatigue protocol
Uso da eletromiografia na análise de dor dos músculos trapézio superior
e lombares durante protocolo de fadiga
Candotti CT1,2, Loss JF3, La Torre M2, Melo MO3, Araújo LD2, Marcks VV2
Abstract
Objective: The aim of this study was to investigate whether muscle fatigue indices obtained using surface electromyography and calculated in the time and frequency domains would be capable of objectively diagnosing pain anddiscriminating between subjects with and without pain in the upper trapezius muscle and the lower back muscles. Methods: Forty-seven individuals underwent a muscle fatigue test for thirty-five seconds at 80% of themaximal voluntary contraction (MVC), while EMG and muscle force data were recorded. The RMS value and the median frequency (MF) were calculated within consecutive one-second windows. Linear regression analysis was used to obtain the slope coefficients and the respective y-axis intercept values, which were considered to be localized muscle fatigue indices. Results: In the frequency domain, the slope coefficients were negative for both muscles, while in the time domain, the coefficient for the upper trapezius was positive and the coefficient for the lower back muscles was negative (p<0.01). Significant differences were also found in the frequency domain between subjects with and without pain in the upper trapezius (p<0.01). The subjects with pain had significantly lower force values than the subjects without pain (p<0.05), in both the upper trapezius and the lower back muscles.Conclusion: The force values associated with the fatigue indices (MF slope and y-axis intercept) were able to predict the presence of pain in the upper trapezius (p<0.05), but not in the lower back muscles.
Key words: electromyography; fatigue; pain; upper trapezius muscle; lower back muscles.
Resumo
Objetivo: A proposta do estudo foi investigar se índices de fadiga, obtidos a partir de eletromiografia de superfície, calculados no domínio do tempo e da frequência, são capazes de diagnosticar a dor objetivamente, discriminando entre sujeitos com e sem dor no trapézio superior e nos músculos lombares. Métodos: Quarenta e sete indivíduos foram submetidos a um teste de fadiga muscular por 35s a 80% da contração voluntária máxima (CVM), enquanto EMG e força muscular foram registradas. O valor RMS e a mediana da frequência (MF) foram calculados em janelas consecutivas de 1s. Análise de regressão linear foi utilizada para obter os coeficientes de inclinação e seus respectivos valores de interseção no eixo y, os quais foram considerados índices de fadiga muscular localizada. Resultados: Os coeficientes de inclinação analisados no domínio da frequência apresentaram comportamento similar, sendo negativos para ambos os músculos, enquanto que, no domínio tempo, o trapézio superior apresentou coeficientes positivos, e músculos lombares, coeficientes negativos (p<0,01). Diferenças significativas também foram identificadas no domínio da frequência entre os sujeitos com e sem dor no trapézio superior (p<0,01). Os indivíduos com dor apresentaram valores de força significativamente menores que os sujeitos sem dor (p<0,05), tanto nos músculos lombares quanto no trapézio superior. Conclusão: Os valores de força associados aos índices de fadiga (inclinação da MF e intersecção do eixo y) foram hábeis para predizer a presença de dor no trapézio superior (p<0,05), mas não nos músculos lombares.
Palavras-chave: eletromiografia; fadiga; dor; trapézio superior; músculos lombares.
Received: 01/05/2008 – Revised: 16/09/2008 – Accepted: 02/12/2008
1 Physical Therapy Course, Universidade do Vale do Rio dos Sinos (UNISINOS), São Leopoldo (RS), Brazil 2 Physical Education Course, UNISINOS
3 Graduate Program on Human Movement Science, Universidade Federal do Rio Grande do Sul (UFRGS), Porto Alegre (RS), Brazil
Correspondence to: Jefferson Fagundes Loss, Rua Felizardo, 750, CEP 90690-200, Porto Alegre (RS), Brazil, e-mail: [email protected]
1 1
Introduction
Localized muscle fatigue has been extensively studied over recent years and has been indicated as a factor in chronic
pain-related muscle conditions1-4 as subjects with muscle pain show
reduced muscle endurance and force, probably due to lack of
use because of the pain3,5. Despite the large number of studies
on associations between pain and fatigue, questions regarding the cause and efect relationship remain. Traditionally, clinical diagnoses of muscle pain have been made by physicians or physical therapists using subjective evaluation methods such as palpation, anamnesis and the Borg scale. Moreover, the evolution of pain within physical therapy treatment is followed up subjectively, i.e. it depends on patients’ reports and physical therapists’ interpretations.
hus, in searching for objective diagnoses, electromyog-raphy (EMG) has been proposed as an alternative method for assessing the muscle pain associated with localized muscle fatigue. Fatigue testing using more than 30% of the maximal voluntary contraction (MVC) and monitored using surface EMG in the frequency and time domains is believed to ac-curately detect the fatigue process by measuring the median
frequency (MF) and root mean square (RMS), respectively6.
Typically, as the fatigue process progresses, the MF tends to
decrease7 and RMS to increase8,9, thus relecting a decrease in
the iring rate of the potential action of the motor unit (MU) that is recruited during muscle contraction and changes to the discharge properties, such as in relation to the
synchroniza-tion and recruitment of motor units10-13. Based on spectral and
temporal variables, indices for muscle fatigue during isometric
contractions have been proposed3,7.
here is considerable evidence in the literature to show that the behavior of the MF and RMS during fatigue protocols
changes in individuals with low back pain1,3,7,14-16.However,
there is no conclusive evidence to demonstrate that fatigue testing is able to evaluate back pain in these studies.
Furthermore, there is evidence to suggest that upper trape-zius pain is as much as 84% more frequent than pain in other
body muscles17. Unfortunately, however, few studies have been
carried out on the behavior of the upper trapezius muscle while conducting protocols to investigate local muscle fatigue.
Hence, it seems to be of considerable value to investigate whether early manifestations of muscle fatigue identiied in
subjects with lumbar pain3,4 can also be observed in subjects
with trapezius pain when undergoing examination using fatigue protocols. herefore, the present study attempts to contribute towards developing a means of objectively monitoring muscle pain in lower back and shoulder-neck muscles. hus, the aim
of this study was to investigatewhether muscle fatigue indices
obtained using surface EMG and calculated in the time and frequency domains would be capable of objectively diagnosing pain and discriminating between subjects with and without pain in the upper trapezius muscle and the lower back muscles.
Methods
Subjects
Fifty-seven university students who performed physical activity regularly were analyzed. he subjects were included in one of the following four groups: (1) with upper trapezius pain (n=15), (2) without upper trapezius pain (n=14), (3) with
lum-bar pain (n=18) and (4) without lumlum-bar pain (n=10).he
inclu-sion criterion was multiple episodes of pain in the lower back or upper trapezius muscles within the preceding three months, characterized as chronic pain (daily or almost daily). he sub-jects were assessed and recruited by a physical therapist. he exclusion criteria were as follows: previous surgery; symptoms of nerve root engagement (i.e. pain distal to the knee); spon-dylolisthesis; spinal stenosis; inlammatory disease; or cancer. his study was approved by the ethics committee of Universi-dade do Vale do Rio dos Sinos (03/052) and the subjects signed a written consent form. Table 1 presents the subjects’ mean age, body mass and height.
Protocol
he right and left upper trapezius muscles were simulta-neously subjected to isometric contraction with the subject’s shoulders secured by leather straps ixed to the ground. hus, seated on a chair, the subjects raised both shoulders against
Table 1. Mean values and standard errors of subjects’ age, body mass and height. Groups: (1) with upper trapezius pain; (2) without upper trapezius pain; (3) with lumbar pain; (4) without lumbar pain.
Group 1 Group 2 Group 3 Group 4
Men (n=4)
Women (n=11)
Men (n=10)
Women (n=4)
Men (n=8)
Women (n=10)
Men (n=7)
Women (n=3)
Age (years) 25.2±1.9 27.9±2.7 23.1±1.2 30.5±4.7 26.1±1.9 26.9±2.8 25.3±1.4 28.5±5.3 Mass (kg) 73.2±4.5 57.8±2.7 71.6±3.0 58.0±4.6 75.9±4.1 63.9±3.4 69.6±3.7 66.2±2.7 Height (cm) 176.7±3.7 164.5±2.2 173.3±1.5 161.5±2.8 178.2±2.4 163.2±2.9 171.0±2.7 160.2±2.6
the resistance described above, although a load cell was only attached to the right strap. To evaluate the lower back muscles, trunk isometric extension was performed in a prone horizontal position on the exercise bench, with the lower back, hip and knees securely ixed by straps. All the subjects were secured at the level of the scapula by a leather strap, which was attached to the load cell. A steel wire was then attached to the load and ixed to the ground. All the subjects performed the evaluation protocol once.
he protocol consisted of measuring the maximal voluntary contraction (MVC) prior to the fatigue test, three times for ap-proximately ive seconds, with a two-minute interval between tests. he highest value obtained was used to calculate the submaximal level at 80% of the MVC. he fatigue test was per-formed two minutes after the last MVC test. his test consisted of maintaining the calculated submaximal level at 80% of the MVC for thirty-ive seconds. An oscilloscope (Minipa MO, model 1225, Minipa Electronics Co. Ltd., Shanghai, China) was used to provide visual feedback, and the subjects received strong verbal encouragement during the MVC and the fatigue test.
Although no subjective assessment of fatigue was made, the subjects showed exhaustion at the end of the protocol. Moreover, although the force levels for the upper trapezius and lower back muscles used in this protocol were far greater
than those normally used in daily and occupational activities18,
evaluation of the functional condition of these muscles (pain
and fatigability) requires higher force levels. hus, the force
level corresponding to 80% of the MVC was chosen because the protocol aimed to trigger muscle fatigue. his igure has
been used in similar studies1,3,7,15,19.
Data acquisition
he force and EMG signals were acquired simultaneously while conducting the protocol, by using a Pentium 200MHz PC-compatible microcomputer, through a converting 12-bit AD board (Lynx Tecnologia Eletrônica Ltda., São Paulo, Brazil), with a sampling frequency of 1000Hz per channel. he force sig-nals were obtained using a load cell instrumented with strain gauges (model S-200, Alfa Instrumentos Eletrônicos Ltda., São Paulo, Brazil) connected to the same A/D board converter, so that the force and EMG signals would be automatically syn-chronized. he EMG activity was recorded bilaterally from the longissimus and iliocostalis lumbar muscles (at the levels of the irst and the ifth lumbar vertebrae respectively), and from the right upper trapezius (at a point two-thirds of the distance
from thespinous process of the seventh cervical vertebrae
to-wards the lateral edge of the acromion), in accordance with the
“Standards for reporting EMG data”20. Disposable passive
sur-face electrodes (Ag/AgCl; 1.0 cm in diameter) were placed in a
single diferential coniguration on the bellies of the muscles, observing the supposed alignment of the muscle ibers. he reference electrode was placed on the left wrist, over the ulnar styloid process. he preparation for surface EMG detection included shaving the skin and applying alcohol to cleanse the skin. he impedance between the electrodes was checked and was accepted when maintained at less than 5 kohms. Record-ings were made with the aid of a sixteen-channel EMG system (Model EMG-800C, EMG System do Brasil Ltda, São José dos Campos, Brazil) with preampliiers ( ixed gain of 20) located approximately 10 cm from the electrodes. he input impedance of the system was 10 Gohms; the common mode rejection rate (CMRR) was greater then 100 dB (at 60Hz); and the
signal-to-noise ratio (SNR) was 3.0 µvolts RMS.
Data processing and analysis
Force and EMG data were analyzed using self-developed data acquisition software (SAD32; version 2.61.07mp, 2002). he raw EMGs were initially subjected to bandpass iltering (Butterworth, third order, 20-500Hz), and then the EMG signal (including the MVC test) was smoothed by means of a moving window RMS averaging process using one-second Hamming
windows. he iltered EMG signal was also analyzed in the
frequency domain: the median frequency (MF) was calculated from the power density spectrum obtained after one-second Hamming windowing, using the Fast Fourier Transform (FFT) technique. he EMG signal from each muscle was normalized using the highest RMS value obtained during its respective MVC test (maximum value from smoothed signal) in the time domain, and using the maximum frequency obtained
dur-ing its respective MVC test21. he initial two seconds and the
inal three seconds of the test recording were rejected. Con-sequently, thirty windows remained, which were represented by their corresponding RMS and MF values attributed to the center of each window.
Linear regression analysis was used on these thirty points, and a straight-line equation was obtained for each muscle. his equation supplied the linear slope coeicient and the y-axis intercept value, which were both considered to be fatigue
indices14,16,22. For inclusion in the study, the determination
coeicient (r2) obtained by linear regression had to be greater
than or equal to 0.6. hus, the EMG response from the fatigue protocol was expressed using four muscle fatigue indices:
1. he slope coeicient (αF) of the straight line that best itted
all thirty MF values2;
2. he slope coeicient (αT) of the straight line that best itted
all thirty RMS values;
3. he y-axis intercept (yF) of the straight line that best itted
all thirty MF values2;
4. he y-axis intercept (yT) of the straight line that best itted all thirty RMS values.
Statistical analysis
he data obtained were analyzed using the SPSS 10.0 software. he Shapiro-Wilk test was used to investigate and conirm that the data presented normal distribution, and Levine’s test to show that the variances were homogenous. One-way variance (ANOVA) was applied in order to check for possible diferences in the fatigue indices of the four lower back muscles. As there were no signiicant diferences in the fatigue rates between the four lower back muscles (right and left longissimus and right and left iliocostalis lumbar), a simple arithmetic mean was calculated, in which these four muscles were considered as a single lower back muscle group. To determine the presence or otherwise of diferences in the
behavior of the force and fatigue indicesbetweenthe lower
back muscle group and the right upper trapezius muscle, the
t test was performed on independent samples. To assess the
ability of the force and fatigue indices to diferentiate between subjects with and without pain in the lower back muscles and the right upper trapezius muscle, discriminant analysis was performed: (1) Wilk’s Lambda test to evaluate the homogene-ity of the variances; (2) canonical correlation to investigate the linear combination of the variables; (3) stepwise Wilk’s Lambda discriminant analysis to classify the individuals of
each group; and (4) the predicted score for each group23. he
signiicance level adopted was 0.05.
Results
Table 2 shows the force values obtained during the MVC test, according to gender. Significant differences between the subjects with and without pain were found for the up-per trapezius (p=0.011) and lower back muscles (p=0.044). Low force values were found for subjects with pain, when men were compared with men, women with women and also without gender discrimination. Comparison of the force values for the upper trapezius muscle and the lower back muscle group showed that there was no significant
difference, but a tendency for the lower back muscle group to show higher force values was noted.
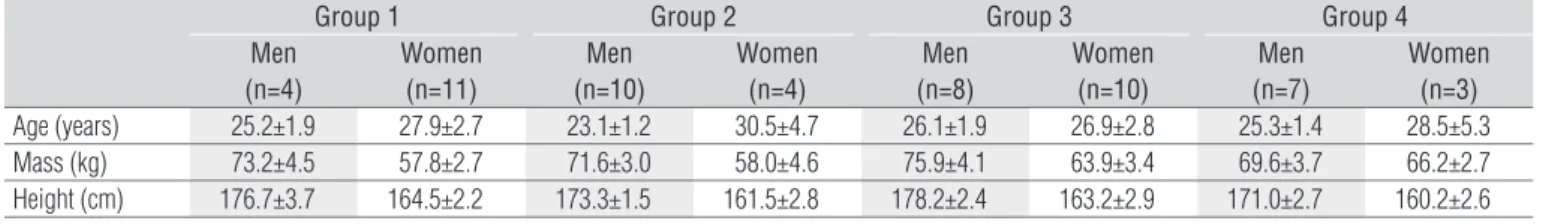
Figure 1 shows the typical behavior of the MF for the right upper trapezius muscle of two subjects, one with and the other without pain. Note that in both cases, the MF tended to dimin-ish over the course of the fatigue test.
Figure 2 shows that the right upper trapezius and the lower back muscles displayed similar EMG signal behavior
in the frequency domain, i.e. αF indicated a trend towards a
lower MF during the test. Comparison between the groups with and without pain showed that there was only a
sig-niicance diference in αF in the upper trapezius (Figure 2).
However, the behavior of the EMG signal in the time domain was signiicantly diferent between the right upper trapezius
and lower back muscles for αT (p<0.001). he upper trapezius
muscle presented a positive slope coeicient while the lower back muscle group presented a negative slope coeicient, thus indicating higher and lower RMS values, respectively (Figure 3). Comparison between the groups with and without pain showed that there was no signiicant diference in either of the muscles analyzed (Figure 3). Discriminant analysis was used in order to classify the subjects into two groups: with pain and without pain, using the fatigue rates and the force values obtained from the MVC. he data were found to present homogeneity of variance. he results from the discriminant analysis in the frequency and/or time domain showed that for the lower back muscle group, none of the fatigue indices and force values were able to discriminate between subjects with and without low back pain. he results of this discriminant analysis in the time domain showed that, for the trapezius muscle, the independent variables were not able to correctly classify the subjects. Analysis in the frequency domain indi-cated that for the upper trapezius muscle, two fatigue indices
(yF and αF) and the force value were able to correctly
clas-sify 69% of the subjects [WL=0.723; χ2=8.256; df=3; p=0.041]
(Table 3). When analysis in the time and frequency domains were used together in the discriminant analysis, neither the fatigue indices nor the force value were able to discriminate between groups with and without pain in the upper trape-zius muscle. When the force variable was removed from the
Table 2. Mean values and standard errors of the force (N) from the upper trapezius and lower back muscle group for subjects with and without pain.
With pain Without pain
Men Women Men Women
Upper Trapezius 535±96 299±24 630±71 311±34 Lower Back Muscles 592±97 321±29 633±67 404±40
Table 3. Discriminant analysis: correct classification of the subjects with and without pain in the upper trapezius muscle. Variables in descending order of discriminating power.
Variables used for correct classification
Percentile of correct classificationa:
Upper Trapezius Muscle
Canonical correlation Group
with pain
Group without pain
Force - y F - αF 73.3% 64.3% 0.526
a 69% of originally grouped cases were correctly classified.
discriminant analysis, no signiicant result was obtained, i.e. the fatigue indices were unable to discriminate between the groups with and without pain.
Discussion
he motive behind this study was not merely to discrimi-nate between subjects with and without pain, but to contribute towards developing a means for objectively monitoring muscle pain in the lumbar, shoulder and neck regions. he results will be analyzed as four topics: (1) force values in the MVC; (2) EMG behavior in the frequency domain; (3) EMG behavior in the time domain; and (4) discrimination between subjects with and without pain.
Force values in the MVC
he group with lower back pain presented force values 24.7% lower than in the group without lower back pain. he percentage of this diference was greater in the trapezius muscle, for which the group with pain exerted 36% less force than did the group without pain. It has been found that subjects with pain exert submaximal force and not the “true” maximal force during MVC testing, because of the pain
itself15. his behavior may be relected in the results from
fatigue testing, i.e. subjects’ abilities or lack of ability to ac-tivate muscle ibers suiciently to achieve fatigue could be a serious problem when protocols are based on MVC. Because signiicant diferences between the groups with and without pain were found, it is suggested that the results from the pres-ent study (Table 2) are in agreempres-ent with those mpres-entioned above, considering that the subjects with pain did not exert maximal force during the MVC test in either muscle that was evaluated. Nevertheless, it is speculated that the subjects in the present study may have reached localized muscle fatigue while performing the evaluation protocol.
Despite the controversy relating to lower back pain, which focuses on the interpretation of changes to muscle activity in subjects with pain, the basic theory of one of the models proposed is that the pain reduces muscle activation when the muscle acts as an agonist and increases muscle
activa-tion when it acts as an antagonist. his pain adaptation model
postulates that the changes in motor recruitment may be due to some type of strategic control that the nervous system ex-erts through speciic neural pathways. In this, the feedback of aferents can, via both inhibitory and excitatory interneu-rons, excite or inhibit the alpha motor neuinterneu-rons, depending on the motor command. he efects of this neural mechanism suggest that there is a reduction in agonist activation and
Figure 1. Typical behavior of the MF in upper trapezius muscle for two subjects: (A) with pain and (B) without pain.
-1.5 -1.0 -0.5 0.0
With pain Without pain With pain Without pain
Slope coefficients of MF
Upper trapezius Lower back muscles
*
Figure 2. Means and standard errors of MF slope coefficients (αF) for both groups (with and without pain) for upper trapezius and lower back muscles.
*p<0.05.
Slope coef
ficients of RMS
* * 1.5 1.0 0.5 0.0 -0.5 -1.0
With pain Without pain With pain Without pain
Upper trapezius Lower back muscles
Figure 3. Means and standard errors of RMS slope coefficients (αT) for both groups (with and without pain) for upper trapezius and lower back muscles.
*p<0.01.
y = -1.5672x + 104.48 R2 = 0.8837 50 60 70 80 90 100
0 5 10 15 20 25 30 35 Time (s) M e d ia n Fr e q u e n c y ( % ) 50 60 70 80 90 100
y = -0.7041x + 96.352 R2 = 0.7365 Time (s) M e d ia n Fr e q u e n c y ( % )
0 5 10 15 20 25 30 35 B A
an increase in antagonist activation24. hus, it is suggested that pain can afect voluntary activity in painful muscles (the upper trapezius as the agonist for scapula elevation and the lower back muscles as agonists for trunk extension), in order to prevent injury through inappropriate muscle contraction.
Based on the above theory, it can be supposed that the fact that the subjects with pain did not exert maximal force during MVC testing might be associated with a kind of pro-tection mechanism. Although there is no widely accepted explanation for this, it is interesting to speculate that the existence of a relationship between force and motor unit
recruitment25 might be the cause for such a discrepancy in
the MVC between the groups, thus suggesting that selective adaptation occurs at fatigue levels. Hence, the fact that the group with pain did not exert maximal force capacity may have inluenced the outcome, thereby changing the muscle fatigue quantiication and, consequently, resulting in less ac-curate classiication of the subjects.
he upper trapezius muscle and lower back muscle group
have been associated with chronic muscle pain26, and it has
been supposed that dynamic reorganization of EMG activity takes place in the presence of pain. hus, a new form of synergy is developed, resulting in minimization of the use of the
pain-ful muscles27. Further studies are needed to investigate pain
in other muscles, such as the upper trapezius muscle, using a method other than MVC in order to determine the level of sus-tained contraction and to minimize any possible efect from a supposed pain protection mechanism.
EMG behavior in the frequency domain
Traditionally, the Fast Fourier Transform technique (FFT) has been used to analyze the behavior of the EMG signal dur-ing fatigue tests involvdur-ing sustained isometric contraction,
althoughparametric methods of power spectrum estimation
may also be used (AR, MA and ARMA). he behavior of the MF throughout the duration of muscle contraction while conducting the fatigue protocols was conirmed from linear regression analyses, which supplied the linear slope coei-cient of the MF curve (Figures 1 and 2). A negative slope coef-icient indicated that while performing the fatigue protocol there was a decrease in the MF (Figure 2). It has been docu-mented that establishing a fatigue process in the lower back muscles causes compression of the EMG spectrum towards low frequencies, while MF decreases. However, this behavior seems to difer between subjects with lower back pain and subjects without pain, such that subjects with pain tend to show a higher slope coeicient, i.e. greater decreases in the MF curve. Consequently, compared with individuals without lower back pain, subjects who sufer from lower back pain
show muscle dysfunction and early myoelectrical
manifesta-tions of muscle fatigue28. In the present study, a negative MF
slope coeicient was found in all cases, although a signiicant diference between subjects with and without pain was only obtained for the upper trapezius muscle (Figure 2).
It has been suggested that muscle fatigue may be a fac-tor related to the muscle disorders that are associated with
chronic pain1. However, in order to make such an
associa-tion, fatigue needs to be understood as a continuous process that starts with the initiation of neuromuscular activity and is capable of causing changes to electrical activity, electrical propagation, excitation-contraction coupling and various
elements of the contraction process. Some authors29-31 have
suggested that during sustained isometric contraction with 50% of maximal force or greater, the accumulation of lac-tic acid leads to decreased pH in contracting muscles. his accumulation also inhibits the excitability of the muscle membrane, thereby causing a decrease in the iring rate and, consequently, a decrease in MF.
EMG behavior in the time domain
he occlusion of blood low due to intramuscular pressure
during static contraction31 leads to a reduction in the oxygen
supply to the active muscle. Consequently, glycolytic metabo-lism increases, and there is an accumulation of lactate. In order to compensate for this situation and maintain force lev-els, recruitment of new motor units (MUs) can be expected. his motor unit recruitment is relected in the EMG signal amplitude and, therefore, can be identiied by calculating
the root mean square (RMS)8. he increase in RMS is related
to the recruitment of additional motor units and also an in-creased iring rate, and these are necessary to compensate
for the loss of force19. he spectral compression produced by
the slower conduction of action potential also increases the
RMS32. In the present study, this behavior was noted in the
upper trapezius muscle.
In contrast, some studies have indicated that the RMS value
behaves diferently. For example, Gerdle et al.6 reported that
the RMS value showed various patterns within the same group (increased, unchanged or decreased) during the fatigue phase. Such divergences may arise from diferences in characteristics between individual subjects, such as the subject’s resistance to fatigue, the contraction properties of the skeletal muscle, muscle iber composition, enzyme activity levels, diferences in metabolic systems and diferences in signal processing. Despite the characteristics of individual subjects, divergent RMS behavior was consistent with the muscle group in the present study. he RMS increased in the right upper trapezius, but decreased in the lower back muscle, for groups with and
1. Roy SH, De Luca CJ, Casavant DA. Lumbar muscle fatigue and chronic lower back pain. Spine. 1989;14(9):991-1001.
2. Roy SH, Bonato P, Knaflitz M. EMG assessment of back muscle function during cyclical lifting. J Electromyogr Kinesiol. 1998;8(4):233-45.
3. Larivière C, Arsenault BA, Gravel D, Gagnon D, Loisel P. Surface electromyography assessment of back muscle intrinsic properties. J Electromyogr Kinesiol. 2003;13(4):305-18.
4. Falla D, Farina D. Muscle fiber conduction velocity of the upper trapezius muscle during dynamic contraction of the upper limb in patients with chronic neck pain. Pain. 2005;116(1-2):138-45.
5. Mannion AF. Fibre type characteristics and function of the human paraspinal muscles: normal values and changes in association with low back pain. J Electromyogr Kinesiol. 1999;9(6):263-377.
6. Gerdle B, Larsson B, Karlsson S. Criterion validation of surface EMG variables as fatigue indicators using peak torque: a study of repetitive maximum isokinetic knee extensions. J Electromyogr Kinesiol. 2000;10(4):225-32.
7. De Luca CJ. Use of the surface EMG signal for performance evaluation of back muscles. Muscle Nerve. 1993;16(5):210-6.
without pain (Figure 3). he reason for this divergence remains
unclear because the iber composition was similar18, the signal
processing was the same and there was no information regard-ing enzyme activity or diferences in metabolic systems within this protocol.
Discrimination between subjects with and
without pain
Both the MF slope coeicient and the y-axis intercept value from the straight line have been used as localized muscle fa-tigue indices that have the ability to distinguish between
sub-jects with and without pain14,15,22,33. In the present study, correct
classiication of 73.3% of the subjects with upper trapezius pain
was only achieved when the forcevalue was associated with the
fatigue indices obtained from analysis in the frequency domain (Table 3). When a new discriminant analysis was performed and the force variable was extracted, no signiicant result was obtained. It seems that the force values had a fundamental role in achieving the results described above. hese indings are in
agreement with Elfving, Dedering & Németh15.
In contrast to other reports in the literature1,15,22,33,34,
the present study was unable to discriminate subjects with low back pain. Assuming that EMG amplitude is a source of
information on localized muscle fatigue, it was hypothesized that an increase in the RMS value during isometric testing could be an indication of muscle fatigue. he results from this study did not conirm this hypothesis because the fatigue indices obtained from analysis in the time domain were not capable of discriminating between subjects with and without pain in the upper trapezius and lower back muscles. he di-vergent RMS behavioral patterns (Figure 3) may explain the failure to discriminate between subjects using fatigue indices in the time domain. It is notable that there is still much de-bate concerning the use of the RMS value as an indicator of muscle fatigue.
In summary, regarding the analyzed sample, the behavior of the upper trapezius muscle and lower back muscle group was seen to be similar when assessment was based on the MF slope coeicient (negative slope coeicient for both muscles) and divergent when the assessment was based on the RMS value (positive slope coeicient for the upper trapezius and negative slope coeicient for the lower back muscles). Concerning the capacity of the fatigue indices to discriminate between subjects with and without pain, the results showed that force values as-sociated with fatigue indices (MF slope and y-axis intercept) were able to predict the presence of pain in the upper trape-zius, but not in the lower back muscle group.
8. Vaz MA, Zhang YT, Herzog W, Guimarães AC, Macintosh BR. The behavior of human rectus femoris and vastus lateralis during fatigue and recovery: an electromyographic and vibromyographic study. Electromiogr Clin Neurophys. 1996;36(4):221-30.
9. Adam A, De Luca CJ. Recruitment order of motor units in human vastus lateralis muscle is maintained during fatiguing contraction. J. Neurophysiol. 2003;90(5):2919-27.
10. Viitasalo JH, Komi PV. Signal characteristics of EMG during fatigue. Eur J Appl Physiol Occup Physiol. 1977;37(2):111-21.
11. Moritani T, Nagata A, Muro M. Eletromyographic manifestations of muscular fatigue. Med Sci Sports Exerc. 1982;14(3):198-202.
12. Häkkinen K, Komi PV. Effects of fatigue and recovery on electromyophic and isometric force-and relaxation force- and relaxation-time characteristics of human skeletal muscle. Eur J Appl Physiol Occup Physiol. 1986;55(6):588-96.
13. Takaishi T, Yasuda Y, Moritani T. Neuromuscular fatigue during prolonged pedalling exercise at different pedalling rates. Eur J Appl Physiol Occup Physiol. 1994;69(2):154-8.
7
14. Candotti CT, Guimarães ACS, Cardoso MFS. Detection of low-back pain in volleyball players and non-athletes using EMG. Braz J Biomech. 2000;1(1):15-9.
15. Elfving B, Dedering A, Németh G. Lumbar muscle fatigue and recovery in patients with long-term low-back trouble-electromyography and health-related factors. Clin Biomech. 2003;18(7):619-39.
16. Marcks V, La Torre M, Aguiar T, Breyer M, Melo MO, Candotti CT. Analysis of fatigue in the upper trapezius muscle through electromyography in subjects with and without pain. Bulletin FIEP. 2005;75(1):579-82.
17. Yunus M, Masi AT, Calabro JJ, Miller KA, Feigenbaum SL. Primary fibromyalgia (fibrositis): clinical study of 50 patients with matched normal controls. Semin Arthrists Rheum. 1981;11(1):151-71.
18. Mork PJ, Westgaard RH. Long-term electromyographic activity in upper trapezius and low back muscles of women with moderate physical activity. J Appl Physiol. 2005;99(2):570-8.
19. Kleine BU, Schumann NP, Stegeman DF, Scholle HC. Surface EMG mapping of the human trapezius muscles: the topography of monopolar and bipolar surface EMG amplitude and spectrum parameters at varied forces and in fatigue. Clin Neurophysiol. 2000;111(4):686-93.
20. Standards for reporting EMG data. J Electromyogr Kinesiol. 1997;7(2):I-II.
21. Basmajian JV, De Luca CJ. Muscle alive: their functions revealed by electromyography. 5ª ed. Baltimore: Williams and Wilkins; 1985.
22. Candotti CT, Loss JF, Guimarães ACS. Effects of a muscle relaxation program on low-back pain of gymnasts: an electromyographic study. Rev Bras Biomec. 2005;6(10):19-26.
23. Ntoumanis N. A step-by-step guide to SPSS for sport and exercise studies. Florence, KY: Routledge; 2001.
24. Lund JP, Donga R, Widmer CG, Stohler CS. The pain-adaptation model: a discussion of the relationship between chronic musculoskeletal pain and motor activities. Can J Physiol Pharmacol. 1991;69(5):683-94.
25. Kraemer WJ, Ratames NA. Fundamentals of resistance training: progression and exercise prescription. Med Sci Sports Exerc. 2004;36(4):674-88.
26. Millerad E, Ericson MO, Nisell R, Killbom A. An electromyographic study of dental work. Ergonomics. 1991;34(7):953-62.
27. Madeleine P, Lundager B, Voigt M, Arendt-Nielsen L. Shoulder muscle co-ordination during chronic and acute experimental neck-shoulder pain. An occupational pain study. Eur J Appl Physiol Occup Physiol. 1999;79(2):127-40.
28. van Dieën JH, Oude Vrielink HE, Housheer AF, Lötters FB, Toussaint HM. Trunk extensor endurance and its relationship to electromyogram parameters. Eur J Appl Physiol. 1993;66(5):388-96.
29. Seburn KL, Sanderson DJ, Belcastro AN, McKenzie DC. Effect of manipulation of plasma lactate on integrated EMG during cycling. Med Sci Sports Exerc. 1992;24(8):911-6.
30. Tsuboi T, Satou T, Egawa K, Izumi Y, Miyazaki M. Spectral analysis of electromyogram in lumbar muscles: fatigue induced endurance contraction. Eur J Appl Physiol Occup Physiol. 1994;69(4):361-6.
31. Masuda K, Masuda T, Sadoyama T, Inaki M, Katsuta S. Changes in surface EMG parameters during static and dynamic fatiguing contractions. J Electromyogr Kinesiol. 1999;9(1):39-46.
32. Merletti R, Lo Conte LR. Surface EMG signal processing during isometric contraction. J Electromyogr Kinesiol. 1997;7(4):241-50.
33. Roy SH, De Luca CJ, Snyder-Mackler L, Emley MS, Crenshaw RL, Lyons JP. Fatigue, recovery, and low back pain in varsity rowers. Med Sci Sports Exerc. 1990;22(4):463-9.
34. Candotti CT, Loss JF, Pressi AM, Castro FAS, La Torre M, Melo Mde O, et al. Electromyography for assessment of pain in low back muscles. Phys Ther. 2008;88(9):1061-7.