Two cryptic anatectic events within a syn-collisional granitoid from the
Araçuaí orogen (southeastern Brazil): Evidence from the
polymetamorphic Carlos Chagas batholith
M.G. Melo
a,b,⁎
, G. Stevens
b, C. Lana
a,1, A.C. Pedrosa-Soares
c,1, D. Frei
b, F.F. Alkmim
a,1, L.A. Alkmin
aaApplied Isotope Research Group, Departamento de Geologia, Escola de Minas, Universidade Federal de Ouro Preto, Campus Universitário Morro do Cruzeiro s/n, 35400-000 Ouro Preto, MG, Brazil bCentre for Crustal Petrology, Department of Earth Sciences, Stellenbosch University, Private Bag X1, Matieland 7602, South Africa
cUniversidade Federal de Minas Gerais, IGC
–CPMTC, Campus Pampulha, 31270-901 Belo Horizonte, MG, Brazil
a b s t r a c t
a r t i c l e
i n f o
Article history:
Received 15 February 2016 Accepted 9 October 2016 Available online 19 October 2016
From the earliest (ca. 630 Ma) pre-collisional plutons to the latest (ca. 480 Ma) post-collisional intrusions, the Araçuaí orogen (SE Brazil) records an outstanding succession of granite production events in space and time. The Carlos Chagas batholith (CCB) is the largest (~14,000 km2) granitic body ascribed to the collisional plutonism
(G2 supersuite) in the back-arc region of the Araçuaí orogen, to the east of the Rio Doce magmatic arc. A wide range of monazite and zircon ages (N725 Ma to ca. 490 Ma) have been found in CCB granites, recording a rich his-tory of crustal recycling and inheritance, magmatic crystallization and anatexis. The CCB includes a dominant granite richer in garnet than in biotite, in which three mineral assemblages can be identified: 1) Qz + Pl + Kfs + Bt + Grt + Ilm ± Rt; 2) Qz + Pl + Kfs + Bt + Grt + Ilm + Sil; and 3) Qz + Pl + Kfs + Bt + Grt + Ilm + Sil + Spl. Rocks which contain mineral assemblage 2 and 3 all contain two generations of garnet. Textural evidence for the presence of former melt, recognized in all studied CCB samples, includes: silicate melt inclusions in poikiloblastic garnet, pseudomorphed thin films of melt surrounding both generations of garnet, pseudomorphed melt pools adjacent to garnet and biotite, and plagioclase and quartz with cuspate-lobate shapes occurring among matrix grains. Both generations of garnet crystals (Grt1and Grt2) are unzoned in terms of major
element concentration, contain small rounded inclusions of Ti-rich biotite and, in addition, the Grt2crystals also
contain inclusions of remnant sillimanite needles. Microstructural evidence, in combination with mineral chem-istry, indicates that the garnet crystals grew during two distinct metamorphic-anatectic events, as the peritectic products offluid-absent melting reactions which consumed biotite, quartz and plagioclase, in the case of Grt1,
and which consumed biotite, quartz, plagioclase and sillimanite in the case of Grt2.P–Tpseudosections calculated
via Theriak-Domino, in combination with in situ U–Pb monazite and zircon dating, provide new constraints on the thermal evolution of the back-arc region of the Araçuaí orogen. Data from assemblage 1 suggestsP–T
condi-tions for thefirst granulite-facies metamorphic event (M1) at 790–820 °C and 9.5–10.5 kbar, while the assem-blage 2 recordsP–Tconditions for a second granulite-facies metamorphism (M2) of around 770 °C and
6.6 kbar. Monazite and zircon within garnets from the different assemblages give age peaks at 570–550 Ma (M1) and 535–515 Ma (M2), recording two anatectic events in the CCB during a single orogenic cycle. The PT conditions for these metamorphic events can be related to: i) M1, striking crustal thickening, probably involving thrusting of the magmatic arc onto the back-arc region; and ii) M2, decompression related to the gravitational collapse of the Araçuaí orogen.
© 2016 Elsevier B.V. All rights reserved. Keywords:
Multiple anatectic event Garnet
Granulite facies metamorphism Monazite and zircon dating Araçuaí orogen
1. Introduction
Crustal differentiation is an important process in the stabilization of the continental crust. There is widespread consensus that the rocks forming the lower continental crust record at least one cycle of partial
melting (N800 °C; e.g.Brown, 1994, 2010). The resultant granitic
magmas migrate upwards, enriching the upper crust in SiO2, K2O and
Na2O, and leaving the lower crust dehydrated, more refractory and
enriched in Al2O3, FeO, MgO and CaO (Brown, 2013; Brown and
Rushmer, 2006; Petford et al., 2000). ⁎ Corresponding author at: Applied Isotope Research Group, Departamento de Geologia,
Escola de Minas, Universidade Federal de Ouro Preto, Campus Universitário Morro do Cruzeiro s/n, 35400-000 Ouro Preto, MG, Brazil.
E-mail addresses:[email protected](M.G. Melo), [email protected](A.C. Pedrosa-Soares).
1Fellow of the Brazilian Research Council (CNPq).
http://dx.doi.org/10.1016/j.lithos.2016.10.012 0024-4937/© 2016 Elsevier B.V. All rights reserved.
Contents lists available atScienceDirect
Lithos
In long-lived orogenic systems some rocks may record more than
one cycle of tectonic burial with partial melting at depth (Jeon et al.,
2012; Richter et al., 2016). Likewise, early orogenic granites (sensu lato), emplaced into the upper crust, may be buried together with overlying sedimentary and volcanic sequences to lower crustal levels, and recycled in the lower crust as the orogeny evolves. This recurring process of partial melting may have contributed to the formation of vast amounts of S-type granite and has been documented in a number
of orogenic systems, such as the Lachlan fold belt (Chappell and
White, 1974), the Aracuaí Orogen (Pedrosa-Soares et al., 2001, 2011),
and the Tasmanide orogenic system (Collins and Richards, 2008).
In the Ediacaran-Cambrian Araçuaí orogen, there is evidence of at least three regional anatectic events that formed the S-type granites
included in the G2 (ca. 585–545 Ma), G3 (ca. 545–530 Ma) and G4
supersuites (ca. 530–500 Ma) (De Campos et al., 2004, 2016; Gradim
et al., 2014; Pedrosa-Soares et al., 2001, 2011; Richter et al., 2016; Tedeschi et al., 2016). No previous studies have investigated the poten-tial anatectic recycling of older granites through detailed study of their mineralogy, mineral textures, mineral chemistry and geochronology. This study investigates the petrogenesis of the Carlos Chagas batholith
(CCB), a very large body (~14,000 km2) composed of peraluminous,
S-type granites that formed during the syn-collisional stage of the Araçuaí orogen, with a view to better understanding crustal recycling during a long-lived orogeny. We present new petrographic evidence, as well as major and trace element mineral chemistry which documents garnet
growth during two separate partial melting episodes in the CCB. U–Pb
in situ monazite and zircon dating allow the timing of the high-grade metamorphic events that produced the garnet crystals to be constrained.
In addition, P–T–t paths for the two successive metamorphic events
are quantified in order to explain how granitic bodies, possibly initially
intruded into the upper crust, can experience more than one cycle of mid- to lower crustal tectonic recycling.
2. Geotectonic and regional setting
The Araçuaí orogen of southeastern Brazil together with its
coun-terpart located in southwestern Africa, the West Congo belt (Fig. 1),
form an orogenic system that developed during the Brasiliano–
Pan-African orogeny between the São Francisco and Congo cratons (Alkmim et al., 2006; Pedrosa-Soares et al., 2001, 2008). Formed dur-ing the amalgamation of Western Gondwana in Ediacaran to Cambri-an time, the Araçuaí-West Congo orogenic system was split into two distinct belts by the opening of the South Atlantic Ocean in the
Creta-ceous (Fig. 1). The West Congo belt inherited important rift to
proxi-mal passive margin sequences of the precursor basins, which show
low grade metamorphism and no orogenic igneous rocks (Tack
et al., 2001). On the other hand, the Araçuaí orogen inherited two thirds of the orogenic system, including rift-related to distal passive margin and oceanic sequences with ophiolitic bodies of the precursor basin system, and the Rio Doce magmatic arc, as well as the collisional
and post-collisional igneous suites (Pedrosa-Soares et al., 2001, 2008,
2011). The huge quantity of orogenic granites in the Araçuaí orogen
can be grouped intofive regional supersuites based onfield
relation-ships, structural features and geochemical and geochronological data.
These are: G1 (Rio Doce magmatic arc, ca. 630–585 Ma), G2 (ca. 585–
545 Ma), G3 (ca. 545–530 Ma), G4 (ca. 530–500 Ma), and G5 (ca. 525–
480 Ma) (see synthesis, and updated geochemical and geochronological
data inBelém, 2014; De Campos et al., 2016; Gradim et al., 2014;
Pedrosa-Soares et al., 2011; Peixoto et al., 2015; Richter et al., 2016; Silva et al., 2011; Tedeschi et al., 2016). Most collisional peraluminous granites ascribed to the G2 supersuite, like the Carlos Chagas batholith, occur in the northern back-arc region to the east of the Rio Doce arc (G1 supersuite), and along the northeastern sector of the Araçuaí orogen (Figs. 1 and 2).
The Carlos Chagas batholith, extends in a N-S direction between
latitudes 17°S and 19°30′S in the states of Espírito Santo, Minas Gerais
and Bahia. Cropping out over an area of approximately 14,000 km2, it
is one of the largest bodies of S-type granite in the world. Thefirst
characterization and delimitation of such a large amount of S-type gran-ite resulted from systematic geological mapping covering the whole
area of the batholith (Castañeda et al., 2006; Gradim et al., 2014;
Pedrosa-Soares et al., 2001, 2006, 2007; Pinto et al., 2001; Queiroga et al., 2012; Roncato, 2009; Roncato et al., 2012; Sampaio et al., 2004). These publications also characterize the CCB lithotypes, and describe
their mainfield, petrographic, structural and lithochemical features
(see below).
The typical CCB rocks are coarse-grained S-type granites rich in
K-feldspar megacrysts and relatively poor in mafic minerals, the
so-called Carlos Chagas leucogranite. Macroscopically, the batholith shows striking structural variations from non-deformed granites with well-preserved igneous fabrics to increasingly deformed varieties
showing the regional ductile foliation (Cavalcante et al., 2013; Gradim
et al., 2014; Pedrosa-Soares et al., 2011). The deformed CCB granites frequently show post-kinematic leucosomes of garnet- and cordierite-bearing leucogranite (G3) in the form of veins and patches, overprinting
the regional foliation Sn (Gradim et al., 2014; Pedrosa-Soares et al.,
2011). The G3 leucosomes generally show gradational contacts in
rela-tion to the host G2 granite, suggesting an autochthonous origin for the G3 melt. Locally, sharp contacts between G3 veins and the host G2
gran-ite can occur, indicating mobility of the G3 melt (Gradim et al., 2014;
Pedrosa-Soares et al., 2011; Roncato, 2009). The G3 leucogranites show many remnants of the host G2 granite, in the form of paleosome
(restites) and biotite-sillimanite-rich schlieren (Pedrosa-Soares et al.,
2006; Roncato, 2009). The U–Pb ages of G2 and G3 from the same
out-crops (Fig. 2) show that G3 leucogranites (ca. 545–530 Ma) are 40 Ma to
50 Ma younger than the older Carlos Chagas and Ataléia granites (Gradim et al., 2014; Pedrosa-Soares et al., 2011; Silva et al., 2002, 2011).
Foliated peraluminous granites of the G2 Ataléia suite (ca. 590–
570 Ma) and granulite facies paragneiss complexes (Jequitinhonha
and Nova Venécia;Gradim et al., 2014; Moraes et al., 2015; Richter
et al., 2016) surround and underlie the CCB, and also appear as isolated
massifs in erosional windows within the batholith (Fig. 2). The contact
of the CCB with its host rocks varies from intrusive to gradational, with the Nova Venécia and Jequitinhonha paragneisses, to gradational
or sharp, with the Ataléia foliated granites, and is defined by shear
zones in some places. However, no evidence of large displacements along the CCB contacts has been described. Regionally, the CCB is relatively poor in xenoliths of the host rocks, which tend to be more common along the batholith borders.
The batholith was intruded by a number of plutons, dikes and veins composed of granitic, charnockitic and gabbroic rocks of the
post-collisional (525 Ma–490 Ma) G5 supersuite (Belém, 2014; De Campos
et al., 2004, 2016; Gradim et al., 2014). G5 intrusions cut the regional and local structures of the CCB rocks, and locally imposed high-grade
metamorphic recrystallization on their host rocks (Belém, 2014; De
Campos et al., 2016; Pedrosa-Soares et al., 2011; Queiroga et al., 2012; Roncato et al., 2012).
Ages of magmatic crystallization from 576 ± 8 Ma to 568 ± 5 Ma
(uncertainties reported as 2σ) for the CCB have been constrained by
several SHRIMP and LA-ICP-MS zircon U–Pb studies (Gradim et al.,
2014; Silva et al., 2002, 2011; Vauchez et al., 2007). The youngest meta-morphic age (549 ± 28 Ma) from the ultramylonite, together with the age (546 ± 7 Ma) of a garnet-cordierite granite (G3) forming leucosomes that overprint a foliated Carlos Chagas leucogranite were
suggested to constrain the end of the collisional stage (Gradim et al.,
2014). However,Noce et al. (2004),Pedrosa-Soares et al. (2011), and
Silva et al. (2002, 2011)reported ages as young as 532 ± 11 to 531 ± 10 Ma for G3 granites. To some extent, the uncertainties on some of the age data from these previous studies make the interpretations of the timing of crystallization, metamorphism and possible anatexis speculative.
3. Sampling and petrography
Representative samples were collected over an extensive area of the
CCB (Fig. 2), with most samples being sourced from large dimension
stone quarries and road cuts. Petrographic studies were carried out on
sixty-four thin sections, including the thirty-five thin sections
previous-ly studied byCastañeda et al. (2006),Gradim et al. (2007),Queiroga
et al. (2012)andRoncato et al. (2012). Three different mineral assem-blages characterize the Carlos Chagas leucogranite from the G2
supersuite (mineral abbreviation afterWhitney and Evans, 2010):
Assemblage 1: Qz + Pl + Kfs + Bt + Grt + Ilm ± Rt Assemblage 2: Qz + Pl + Kfs + Bt + Grt + Ilm + Sil Assemblage 3: Qz + Pl + Kfs + Bt + Grt + Ilm + Sil + Spl
17
19º 18º 17º 16º
21º 40º
15º 40º 42º
44
Atlantic
Ocean
Vitória Almenara
Araçuaí
NV NV
NV J
J J
42º
TQ
TQ
TQ
TQ TQ
TQ
Colatina
Manhuaçu
Africa
Araçuaí-West Congo orogenic system
South
America
SÃO FRANCISCO - BRAZIL
Study region
AFRICA
WEST
CONGO
BEL T
100 km
ARAÇUAÍ OROGEN
- CONGO CRA
TON
Ribeira Or ogen
2º
10º
15º
21º 42º
Nanuque
Governador Valadares Cenozoic covers
TQ
Pre-Neoproterozoic units
Study region (dashed line rectangle; see Fig. 2) and the m a i n o c c u r r e n c e a r e a (dotted line polygon) of Carlos Chagas leucogranites Neoproterozoic rocks related to precursor and orogenic basins. Paragneiss complexes: J, Jequitinhonha; Nv, Nova Venécia
Ophiolite bodies: ca. 660-600 Ma
Undivided rock-assemblage: forearc deposits, accretionary wedge and basement rocks Arc-related volcanic-sedimentary deposits
Or
ogenic Plutonism
Post-collisional (G4, G5): ca. 530 - 480 Ma
Syn-collisional (G2), and late to post-collisional (G3): ca. 585 - 530 Ma
Pre-collisional (G1) ca. 630 - 585 Ma
Rio Doce ar
c
20º
Fig. 1.Simplified geological map of the Araçuaí orogen (modified fromPedrosa-Soares et al., 2011), showing location of the study region (dashed rectangle) and the main occurrence area
(dotted polygon) of the Carlos Chagas leucogranites.
Fig. 2.Simplified geological map for the study region (compiled from 1:100.000 scale maps published byBaltazar et al., 2010; Castañeda et al., 2006; Gradim et al., 2007; Pinto et al., 2001; Queiroga et al., 2012; Roncato et al., 2012), showing the area covered by Carlos Chagas leucogranites, location of samples (CC) analyzed in this study, and compiled U–Pb geochronological data from: a,Silva et al. (2002, 2011); b,Pedrosa-Soares et al. (2011); c,Gradim et al. (2014); d,De Campos et al. (2016); e,Vauchez et al. (2007); f,Pedrosa-Soares et al. (2006).
Scanned images of the thin sections were used in conjunction with
the software programme ImageJ (Rasband, 1997–2012) to determine
the modal proportions of the minerals which are presented inTable 1.
Fig. 3shows the macroscopic features of representative rock samples from each mineral assemblage type.
3.1. Assemblage 1
The samples comprise foliated and non-foliated, very coarse- to coarse grained granites with abundant euhedral K-feldspar megacrysts (Fig. 3a,b). Many large outcrops show that the non-deformed facies with macroscopically well-preserved igneous fabrics progressively grade into the deformed facies. The mineral assemblage in both foliated and non-foliated varieties is characterized by large garnet porphyroblasts Table 1
Mineral modal proportions (in vol.%) based on the thin sections.
Assemblages Qz Pl Kfs Bt Grt Sil Hc
1 29–45 8–15 22–43 2–5 4–18 – –
2 22–37 15–22 17–28 1–4 3–15 1–5 –
3 25–41 17–24 28–39 0.5–3 4–10 0.5–2 b1
(a)
(b)
(c)
(d)
(f)
(h)
1 cm G2
G3 Kfs
Kfs Grt
Grt
Grt
1 cm
G3
G2
3 cm
(e)
(g)
Fig. 3.Macroscopic features in rocks from mineral assemblages 1 (a,b), 2 (c–f) and 3 (g,h). Note that most examples are deformed to some degree. (a) Very coarse-grained granite showing
fabrics interpreted to record a transition from magmatic deformation marked by the alignment of K-feldspar megacrysts, to solid-state recrystallization of interstitial quartz and K-feldspar. (b) Regional foliation (Sn) marked by biotite in the granite. (c) Weakly deformed leucogranite showing euhedral to subhedral garnet crystals. (d) Sigma shape of K-feldspar grains in sillimanite- and garnet-bearing leucogranite. (e) G3 leucogranite vein (dashed line) cutting the G2 granite. (f) Dashed lined delimited G3 garnet-bearing leucogranite patches. (g) Mylonite showing feldspar porphyroclasts surrounded by a quartz-rick matrix. (h) Highly deformed mylonitic leucogranite, with foliation marked by sillimanite needles, greenish spinel and quartz ribbons.
crystals in a coarse- to very coarse-grained biotite-bearing
quartz-feldspathic matrix (Fig. 4a). The accessory assemblage is dominated by
rutile, ilmenite, zircon, monazite and apatite, followed in abundance by
sulfide phases (e.g. pyrite, chalcopyrite and sphalerite). The majority of
garnet porphyroblasts (Grt1, 5–35 mm) are poikiloblastic and contain
numerous inclusions (40–380μm) of rounded biotite, lobate and rounded
quartz (Fig. 4b,c), as well as the accessory minerals (ilmenite, rutile,
apatite, zircon and monazite). Thinfilms of quartz and plagioclase occur
along the boundaries of garnet and euhedral rutile crystals (Fig. 4d).
Ad-ditionally, thinfilms of quartz are also observed between plagioclase
grains in the matrix (Fig. 4e).
Three textural varieties of biotite are recognized in these samples.
Thefirst type is characterized by rounded inclusions in poikiloblastic
garnet, as mentioned above (Fig. 4b,c). Matrix biotite consists of small
single crystals and/or clots of crystals (0.1–1.7 mm) aligned with the
regional foliation (Fig. 4a,e). Zircon is a common inclusion in these
biotite crystals and some grains show rims that have been partially
altered to ilmenite. The last type (0.16–1.2 mm) occasionally occurs at
the margins of the larger garnet crystals (Fig. 4a,c).
Plagioclase and quartz in the matrix commonly have sutured
bound-aries typical of grain boundary migration at high-temperature (Fig. 4f).
K-feldspar occurs mainly as megacrysts in the matrix (up to 12 cm) and surrounding garnet crystals. Euhedral K-feldspar crystals are common in all but the most strongly deformed granites, presumably due to strain partitioning preferentially into the surrounding quartz-bearing matrix.
3.2. Assemblages 2 and 3
Mineral assemblages 2 and 3 are only found in the deformed Carlos Chagas leucogranite that vary progressively from foliated granites with
an incipient augen structure to mylonitic granites (Fig. 3c–h). The
foliation around sigmoidal porphyroclasts of K-feldspar and garnet are a result of anastomosing foliation and form augen structure. Moreover, the ductile deformation is attested by presence of quartz ribbons, recrystallization tails around (rotated or not) garnet and feldspar porphyroclasts, and mineral trails of sillimanite needles and green
spi-nel. Generally, the biotite content decreases (from 5 vol.% tob1 vol.%)
with increasing deformation. Deformed granites exhibiting the regional foliation Sn largely predominates in the Carlos Chagas batholith.
The samples differ from assemblage 1 by the presence of sillimanite in a foliation that wraps around the biotite-bearing garnet porphyroblasts
(Grt1) and by formation of a second generation of garnet (Grt2)
(Fig. 5a,b). In these samples, matrix sillimanite forms prismatic aggregates with inclusions of rounded plagioclase. In addition, corroded plagioclase
occurs adjacent to sillimanite prisms. Grt2occurs as smaller euhedral/
subhedral crystals (0.1–0.6 mm) with inclusions of sillimanite needles
that are aligned with foliated matrix sillimanite (Fig. 5a).
Distinct textural types of biotite are also identified in assemblages 2
and 3. Matrix biotite commonly shows evidence of having formed through reactions between melt and ferromagnesian minerals in
that it commonly occurs in symplectites with quartz (Fig. 5c). The
100 µm
(b)
(a)
(c)
(d)
(e)
(f)
100 µm
Qz
Qz Pl
Qz
Rt
Grt1
Ilm Bt2
Bt2
Bt3
Bt2
Pl
Pl Qz
Grt1
Grt1
Grt1
Qz+Pl+Kfs Bt3
Bt2
Bt1
Qz
Qz
Bt1
100 µm 5 mm
200 µm
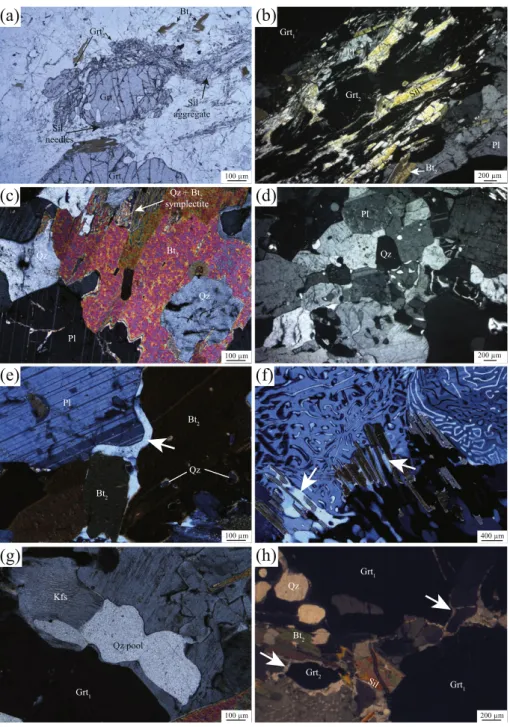
Fig. 4.Photomicrographs of microstructures in rocks from assemblage 1. (a) Scanned thin section showing garnet porphyroblasts in a biotite-bearing quartz-feldspathic matrix. (b) Garnet
porphyroblasts (Grt1) in the foliated granite, showing rounded biotite and quartz inclusions. (c) Multiple rounded and quartz biotite inclusions in garnet, which are likely to be the consequence of a biotite melting reaction. (d) BSE image showing thinfilms of plagioclase (white arrows) along garnet boundaries and surrounding euhedral rutile crystals. (e) Quartz
quartzofeldspathic matrix generally shows evidence for high tempera-ture intracrystalline deformation and recrystallization, such as undulose extinction and development of subgrains in quartz, irregular twinning
in plagioclase and polygonal grains of quartz and plagioclase (Fig. 5d).
Intergrowths of myrmekite and albite in K-feldspar are common. Pla-gioclase and quartz with cuspate-lobate shapes occur as interstitial
phases (Fig. 5e). Quartz-filled former melt pools are observed adjacent
to garnet and biotite (Fig. 5f,g). Pseudomorphed thin meltfilms
com-monly occur surrounding both generations of garnet crystals (Fig. 5h).
In contrast to assemblage 2, the assemblage 3 shows spinel as dark-green, elongated, subhedral to rounded grains typically surrounded garnet and occasionally included in sillimanite and garnet.
4. Mineral chemistry
The mineral chemistry of garnet, biotite, plagioclase, K-feldspar, spi-nel and ilmenite is listed in Supplementary data (Table 1); the analytical methodology is reported in Supplementary material. The end-member
concentrations were calculated as: XAlm = Fe2 +/(Fe2++Mg +
Mn + Ca), XPy = Mg/(Fe2++Mg + Mn + Ca), XSpss = Mn/
(Fe2++Mg + Mn + Ca), X
Grs= Ca/(Fe2++Mg + Mn + Ca), Mg# =
Mg/(Mg + Fe2+), X
An = Ca/(Ca + Na + K), XAb = Na/(Ca +
Na + K), XOr= K/(Ca + Na + K) and XGhn= Zn/(Zn + Mg + Fe2+).
Fe3+concentration in garnet, ilmenite and spinel was calculated using
the general equation ofDroop (1987).
(a)
(b)
(c)
(d)
(e)
(g)
(f)
(h)
Qz + Bt2
symplectite
Bt2
Pl
100 µm
Qz
Grt1
Grt1 Grt2
Sil aggregate Sil
needles
Bt2
100 µm
Qz
200 µm
Pl
Qz Grt1
Grt2 Sil
Pl
Bt2
Pl
200 µm
Bt2
Bt2
Pl
Qz
Qz pool
Grt1
Kfs
Grt1
Grt1
Bt2
Grt2
Sil
Qz
100 µm 200 µm
100 µm 400 µm
Fig. 5.Photomicrographs of microstructures observed in rocks from assemblages 2 and 3. (a) Two different textural varieties of garnet and their relationships with the biotite-sillimanite
fabric. Mineral inclusion suites in both garnet generations are consistent with their production as peritectic products of incongruent melting reactions, which consumed biotite. Sillimanite needles wrap around Grt1, but are overgrown by Grt2. (b) An aggregate of garnet crystals (Grt2) which overprint the biotite-sillimanite foliation. (c) Quartz and biotite symplectite in the matrix. (d) Development of polygonal grains in the quartzofeldspathic matrix. (e) Cuspate quartz (white arrow) along the grain boundaries of biotite and plagioclase in the matrix. (f) Quartz-filled melt pools (white arrow) around biotite grains. Intergrowth myrmekite. (g) Quartz-filled melt pools adjacent to garnet. (h) Films of quartz (white arrow) in garnet boundaries.
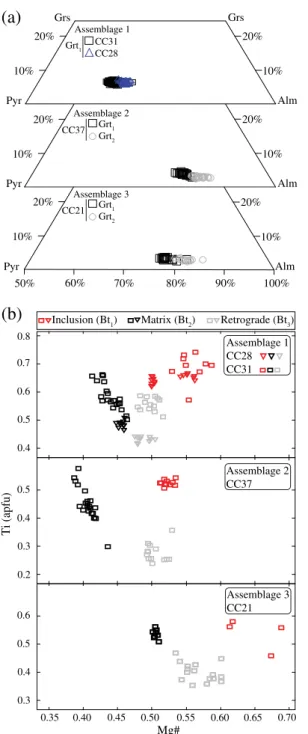
Both generations of garnet are almandine-rich with subordinate pyrope, and minor grossular and spessartine. Individual crystals do
not display any significant major element zonation (Figs. 6 and 7a, see
more details in Supplementary data–Table 1). The Grt1crystals have
XAlmand XPyranging of 0.70 to 0.79 and 0.15 to 0.23, respectively
(Figs. 6 and 7a). XGrsis higher in Grt1from assemblage 1 (XGrs=
0.04–0.06) than Grt1from assemblages 2 and 3 (XGrs~ 0.03) (Figs. 6
and 7a). Spessartine component in Grt1is similar in all assemblages
(XSpss= 0.02–0.03) and Mg# varies between 0.16 and 0.25. Grt2is
char-acterized by slightly different compositions to Grt1, which is indicated
by an increase in Fe-content (XAlm= 0.78–0.82) and decrease in
Mg-content (XPy = 0.12–0.17) (Fig. 7a). For Grt2, its Mg# varies
between 0.13 and 0.18. Spessartine and grossular contents are
homoge-neous in the Grt2crystals (XSpss~ 0.03 and XGrs~ 0.02).
As shown inFig. 7b, biotite displays variable composition depending
on its microstructural position. Biotite inclusions in Grt1present high Ti
(0.48–0.74) and Mg# (0.50–0.69) values compared to matrix biotite
(Ti = 0.39–0.63 and Mg# = 0.40–0.52). Retrograde biotite around
garnet is characterized by low Ti and intermediate Mg# values (Ti =
0.25–0.58 and Mg# = 0.48–0.59).
Matrix plagioclase is unzoned and displays XAnvalues of 0.22–0.33
(Supplementary data–Table 1). Plagioclase adjacent to garnet has the
same composition as the matrix crystals, whereas inclusions in garnet
have XAnvalues ranging from 0.25 to 0.29, and inclusions in sillimanite
have XAnof ~ 0.26. Matrix K-feldspar has XOrvalues of 0.71 to 0.92.
Spinel crystals have relatively high Zn-content with XGhnof 0.10–0.20.
5. Rare earth element composition of garnet
Rare earth element (REE) concentrations in garnet were measured by LA-ICP-MS (Supplementary data - Table 2, see methodology in Supplementary material) from the same three thin sections representing assemblages 1, 2 and 3 from which major element compositions were reported.
The Grt1crystals from all assemblages are enriched in HREE, with
ΣGd-Lu of 86–467 ppm. They have lower GdN/LuNratios in the rim
(0.21–2.91) than in the cores (0.08–0.42) (Fig. 8). If the small
number of samples studied can be considered to be representative, the garnet rims also display a larger negative Eu anomaly in
assemblages 2 and 3 (Eu/Eu* = 0.01–0.02) than the assemblage 1
Fig. 6.Compositional profile of representative poikiloblastic garnet (Grt1) analyzed in each mineral assemblage.
rocks (Eu/Eu* = 0.04–0.07) (Fig. 8). The Grt2crystals haveΣGd-Lu of
175–290 ppm that is within the range of Grt1. In assemblage 2, both
the cores and rims vary from slightly positive to slightly negative
HREE ratios (GdN/LuN= 0.69–1.60) (Fig. 8b). Grt2crystals from
assemblage 3 have slightly positive slope HREE patterns (GdN/
LuN = 0.51–0.71, Fig. 8c). Both samples show broadly similar
negative Eu anomalies (Eu/Eu* = 0.01) (Fig. 8b,c).
6.P–Tconditions
Phase equilibrium modeling was performed in the chemical system
NCKFMASHTO (Na2O-CaO-K2O-FeO-MgO-Al2O3-SiO2-H2O-TiO2-Fe2O3)
using Theriak-Domino software (De Capitani and Petrakakis, 2010), in
combination with the updated tc2td.exe converted Holland and
Powell (1998)database created by Tinkham. The modeling used the
a-x relationships ofWhite et al. (2007)for silicate melt, garnet and
bio-tite;White et al. (2002)for orthopyroxene and spinel;White et al.
(2000) for ilmenite; Coggon and Holland (2002) for white mica; andHolland and Powell (2003) for plagioclase and alkali feldspar. Pseudosections were calculated using the bulk composition from foliated
Grt-bearing (samples CC28 and CC31–assemblage 1) and Sil-Grt-bearing
granites (sample CC37–assemblage 2) (Table 2). Phase equilibrium
modeling could not be successfully conducted for the Spl-Sil-Grt-bearing samples (assemblage 3) because the available a-x models for spinel do not include Zn and the Zn content of the spinel in these samples is too
high to be ignored (7.20 wt.% - Supplementary data–Table 1). CCB
rocks record textural and mineral chemical evidence of partial melting (Figs. 4d,e and5c,e,f,g,h). In addition, the peritectic garnet produced by partial melting is well preserved, which necessitates substantial melt
loss prior to cooling (White and Powell, 2002). Consequently, the
pro-grade evolution of the CCB cannot be constrained by phase equilibrium
modeling in these melt-depleted bulk compositions (White and Powell,
2002). However, the unretrogressed nature of the rocks does allow for
detailed investigation peak metamorphic conditions recorded by assem-blage 1 and 2.
Appropriate values for water content were investigated on T-X
pseudosections and the bulk H2O values were chosen according to the
methodology ofWhite et al. (2001), such that the solidus was located
just below the lowest temperature of occurrence of the interpreted Assemblage 3
CC21 Assemblage 1 CC28 CC31
0.35 0.40 0.45 0.55
Mg#
0.50 0.60 0.65 0.70
0.3 0.4 0.5 0.6 0.2 0.3 0.4 0.5 0.4 0.5 0.6 0.7 0.8
Inclusion (Bt1) Matrix (Bt2) Retrograde (Bt3)
(b)
Assemblage 2 CC37
60% 70% 80% 90% 100%
Alm
50% Pyr
Alm Pyr
Alm Pyr
Grs Grs
10% 20%
10% 20% 10%
20%
10% 20%
10% 20%
10% 20% Assemblage 2
Grt1
Grt2
Assemblage 3 Assemblage 1
CC31 CC28
Grt1
CC37
Grt1
Grt2
CC21
(a)
Ti (apfu)
Fig. 7.Mineral chemistry for all mineral assemblages from CCB. (a) Grs-Alm-Py garnet
diagram. (b) Biotite compositions plotted on a Ti (apfu) v. Mg#.
0.001 0.01 0.1 1 10 100 1000 10000
0.001 0.01 0.1 1 10 100 1000 10000
La Ce Pr Nd Sm Eu Gd Tb Dy Ho Er Tm Yb Lu Rim Core Rim Core
Grt2
Rim Core Rim Core 0.001
0.01 0.1 1 10 100 1000 10000
La Ce Pr Nd Sm Eu Gd Tb Dy Ho Er Tm Yb Lu Rim Core Grt1
(a)
(b)
(c)
La Ce Pr Nd Sm Eu Gd Tb Dy Ho Er Tm Yb Lu CC31 - Assemblage 1
CC37 - Assemblage 2
CC21 - Assemblage 3
Grt1
Grt2 Grt1
Fig. 8.Chondrite-normalized (McDonough and Sun, 1995) REE patterns in garnet from
Carlos Chagas leucogranite. (a) Grt1from assemblage 1 are enriched in HREE, haveflat HREE patterns and negative Eu anomalies. (b) Grt1are richer in Gd-Dy than Grt2from assemblage 2. (c) Both garnet generations from assemblage 3 displayflat HREE patterns and pronounced negative Eu anomalies.
peak assemblage (CC28 = 0.22%, CC31 = 0.28% and CC37 = 0.12%). The
Fe2O3 content for all compositions were determined using P-X
pseudosections with Tfixed at 800 °C (CC28 and CC31) and 760 °C
(CC37). This is consistent with experimental studies which document that these are the approximate minimum temperatures for garnet
for-mation by absent-fluid melting reactions consuming biotite, quartz
and plagioclase, and biotite, sillimanite, quartz and plagioclase,
respec-tively (e.g.Castro et al., 1999; Patiño Douce and Harris, 1998; Patiño
Douce and Johnston, 1991; Pickering and Johnston, 1998; Stevens et al., 1997). The value chosen for Fe3+concentration in each bulk
com-position results in modeled Fe3+concentrations in ilmenite and garnet,
within thefield of the relevant peak assemblage, that are in agreement
with measured values in these minerals in the specific sample.
6.1. Assemblage 1
Five samples were modeled to evaluate theP–Tconditions of the
assemblage 1 (Pl + Kfs + Grt + Bt + Qz + Rt + Ilm + melt). The modeling of two representative samples is presented below (samples CC28 and CC31). The results from another three samples are presented in Supplementary material (Figure SM1), indicating that the assemblage
1 is stable between 770 and 900 °C and 9.5–13 kbar.
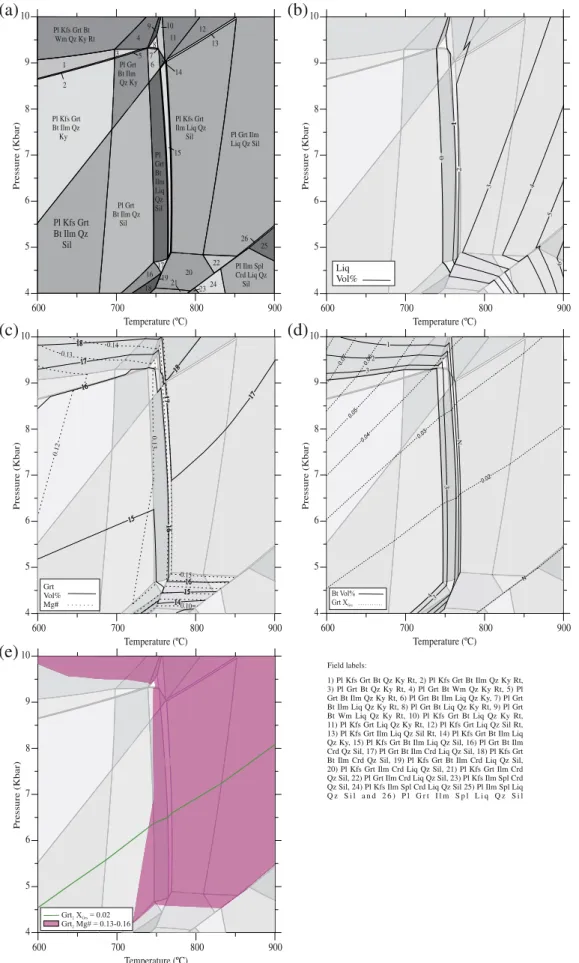
6.1.1. Sample CC28
In this sample, the assemblage 1 is stable between 780 and 860 °C
and 9.2–12.6 kbar (Fig. 9a), with a melt fractionb5 vol.% (Fig. 9b).
With-in thisfield, the amount of garnet (3–6 vol.%) and biotite (b3 vol.%)
(Fig. 9c,e) is consistent with the quantities estimated in thin section (~ 4% and ~ 2%, respectively). The modeling shows an increase in the mode of Grt, melt and rutile, coupled with a decrease in the mode of
Bt as temperature increases over the range defined by the peak
assem-blage (Fig. 9c,e). This is consistent with the occurrence offluid-absent
melting reactions consuming biotite.
Modeled garnet composition shows Mg# of 0.19–0.30, XGrsof 0.04–
0.10 and XAlmof 0.64–0.77 in the peak assemblagefield (Fig. 9c,d).
These values encompass those of measured in Grt1, showing Mg#, XGrs
and XAlmvalues of 0.20–0.22, 0.04–0.06 and 0.72–0.74, respectively
(Supplementary data - Table 1). Mg# values for the modeled biotite
range from 0.46 to 0.61 in the peakfield (Fig. 9e) and measured
values for biotite inclusions (Bt1) in garnet range from 0.50 to 0.56
(Supplementary data - Table 1). The use of XGrs, XAlm, Grt Mg# and Bt1
Mg# values help to more tightly constrain theP–Tconditions of the
peak assemblage to 790–820 °C and 9.5–10.5 kbar (Fig. 9f).
6.1.2. Sample CC31
The peak assemblage Pl + Kfs + Grt + Bt + Qz + Rt + Ilm + melt
occurs at P–T conditions between 800 and 870 °C and 8.9–13.4 kbar
(Fig. 10a). Within thisfield the maximum amount of melt isb6 vol.% (Fig. 10b). This is consistent with the mineral assemblage observed in the assemblage 1 rocks that commonly show ilmenite and rutile as
inclusions in Grt1and also associated pseudomorphed thinfilms of
melt along the garnet boundaries (Fig. 4d). In the peak assemblage
field, the garnet mode ranges from 8 to 13 vol.% (Fig. 10c), while biotite
isb5 vol.% (Fig. 10e). These modes are consistent with the garnet
and biotite proportions estimated in thin section (~ 12% and ~ 4.5%,
respectively) and outcrop (5–10% and 1–4%, respectively).
Modeled garnet and biotite compositions record Mg# of 0.23–0.35
(Fig. 10c) and 0.54–0.64 (Fig. 10e) in the assemblagefield, respectively.
The values of Mg# number measured in Grt1range from 0.21 to 0.25,
while the biotite inclusions in garnet have values of 0.55–0.59
(Supple-mentary data - Table 1). Within the peak assemblagefield, the garnet
and melt proportions increase with increasing temperature while
biotite proportion decreases (Fig. 10b,c,e), consistent with
biotite-breakdown via incongruent melting reactions. XGrsand XAlmvalues
are increased by increasing pressure and temperature, respectively.
Measured Grt1composition yield XGrsand XAlmvalues that range from
0.04–0.05 and 0.70–0.72, respectively (Fig. 10d).P–Tconditions of
equilibration are further constrained by compositional isopleths
of XGrs, XAlm, Grt Mg# and Bt1Mg# at 800–820 °C and 10–11 kbar
(Fig. 10f).
6.2. Assemblage 2
Small domains of the garnet and sillimanite-bearing assemblage in the thin section CC37 are potentially useful to constrain the peak metamorphic conditions of the second metamorphic event. Rastered electron beam analyses of these areas were used to constrain the new bulk composition relevant to formation of the second generation of
garnet. An average of the compositions of ten ~ 0.1 cm2size areas
dominated by this assemblage is presented inTable 2. Using this bulk
composition, the assemblage Pl + Kfs + Grt + Bt + Ilm + Qz +
Sil + melt is stable between 755 and 770 °C and 4.8–9.0 kbar
(Fig. 11a). In thisfield the amount of melt is below 3 vol.% (Fig. 11b);
garnet between 16 and 17 vol.% and biotite below 2 vol.% (Fig. 11c,d).
This is consistent with the mineral proportions estimated in this area
of the thin section (garnet: ~17 vol.% and biotite:b1 vol.%). The lower
pressure limit of the assemblage is bounded by the stability of cordierite
at 5 kbar (Fig. 11a).
In the peak assemblagefield, the modeled Mg# number and XGrsfor
garnet are 0.14–0.15 and 0.01–0.04 (Fig. 11c,d), respectively. The values
measured in Grt2are Mg # = 0.13–0.16 and XGrs~ 0.02 (Supplementary
data - Table 1). The use of Grt Mg# and XGrsisopleths allow the estimate
ofPTconditions of equilibration to be further constrained to
approxi-mately 770 °C and 6.6 kbar (Fig. 11e).
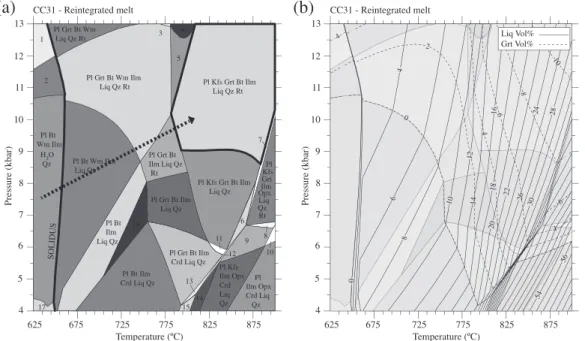
6.3. Melt production
As mentioned above, the excellent preservation of the garnet
crystals within the metamorphosed CCB rocks necessitates significant
melt loss prior to the cooling (White and Powell, 2002). To constrain
the amount of melt produced in the CCB during the metamorphic events, we performed melt reintegration on samples CC31 and CC37
following the methodology ofWhite et al. (2004).
The pseudosection modeling of the melt-reintegrated bulk composi-tion (CC31) indicates that muscovite is stable over a substantial PT range in the protolith. During prograde metamorphism the rock underwent muscovite breakdown at ~ 650 °C producing 8 vol.% of
melt, followed by biotite melting at 780–800 °C (Fig. 12a), with the
Table 2
Bulk composition used for metamorphic modeling and normalized to 100%. H2O and Fe2O3content.
Samples SiO2 Al2O3 TiO2 FeO Fe2O3 MgO CaO Na2O K2O H2O Total
CC28 74.57 12.78 0.38 2.69 0.03 0.59 1.08 2.16 5.50 0.22 100.00
CC31 66.81 15.82 1.06 5.33 0.15 1.32 2.00 2.82 4.40 0.29 100.00
CC37 60.69 24.44 0.22 9.03 0.00 0.90 1.47 2.51 0.61 0.12 100.00
Fig. 9.P–Tpseudosection calculated using the bulk composition from sample CC28 (assemblage 1). (a)P–Tfields of peak assemblage Pl-Kfs-Grt-Bt-Ilm-Qz-Rt-Liq (bold line). (b) Plots of
melt vol.%. (c) Plots of Grt Mg# and Grt vol.%. (d) Plots of XGrsand XAlm. (e) Plots of Bt Mg# and Bt vol.%. (f)P–Tconditions of equilibrium based on the use of overlapping ranges of phase composition and abundance.
5 15 6 11 12 13 14 10 9 8 7 Temperature (ºC) Pressure (kbar) Field labels:
1 - Pl Kfs Grt Wm Liq Qz Rt, 2 - Pl Kfs Grt Bt Liq Ky Qz Rt, 3 - Pl Kfs Grt Bt Liq Qz Rt, 4 - Pl Kfs Grt Bt Wm Ilm Liq Qz Rt, 5 - Pl Kfs Grt Bt Ilm Liq Qz Ky Rt, 6 - Pl Kfs Grt Bt Ilm Liq Qz Ky, 7 - Pl Kfs Grt Bt Ilm Liq Qz Sil Rt, 8 - Pl Kfs Grt Bt Wm Ilm Qz Ky Rt, 9 - Pl Kfs Grt Bt Wm Ilm Qz Ky, 10 - Pl Kfs Grt Bt Ilm Cdr Liq Qz and 11 - Pl Kfs Grt Bt Ilm Opx Liq Qz
Pl Kfs Grt Bt Ilm Qz Sil Pl Kfs Grt Bt Ilm Qz Ky
Pl Kfs Grt Liq Qz Rt Pl Kfs Grt Liq Qz Ky Rt
Pl Kfs Grt Bt Ilm Liq Qz Rt
Pl Kfs Grt Bt Ilm Liq Qz
Pl Kfs Grt Ilm Liq Qz Rt
Pl Kfs Grt Ilm Liq Qz
Pl Kfs Grt Ilm Opx Liq Qz Pl Kfs Grt Bt Ilm Liq Qz Sil Pl Kfs Grt Bt
Wm Ilm Qz Rt Pl Kfs Grt Bt
Wm Qz Rt
Pl Kfs Grt Bt Wm Liq Qz Rt
1 3 2 4 5 6 7 8 9 10 11 5 15 6 11 12 13 14 10 9 8 7 Temperature (ºC) Pressure (kbar) 5 15 6 11 12 13 14 10 9 8 7 Temperature (ºC) Pressure (kbar) 0 1 2 3 4 5 7 8 9 10 6 Liq Vol.% 5 15 6 11 12 13 14 10 9 8 7 Temperature (ºC) Pressure (kbar) 0.02 0.08 0.06 0.04 0.10 0.12 0.22 0.20 0.18 5 15 6 11 12 13 14 10 9 8 7 Temperature (ºC) Pressure (kbar) 2 3 4 5 6 0.18 0.14 0.16 0.20 0.26 0.24 0.22 0.28 0.30 Grt Mg# Vol.% 5
700 750 800 850 900
700 750 800 850 900 700 750 800 850 900
700 750 800 850 900
700 750 800 850 900
5
700 750 800 850 900 15
Pl Kfs Grt Bt Wm Ilm Qz Rt
Pl Kfs Grt Ilm Liq Qz Rt
Pl Kfs Grt Bt Ilm Liq Qz Rt
Pl Kfs Grt Bt Ilm Qz Sil Pl Kfs Grt Bt Ilm Qz Ky
Pl Kfs Grt Bt Ilm Qz Ky Rt Pl Kfs Grt Bt Wm Qz Rt
6 11 12 13 14 10 9 8 7 Temperature (ºC) Pressure (kbar)
Pl Kfs Grt Bt Ilm Liq Qz
Pl Kfs Grt Ilm Liq Qz
Pl Kfs Grt Ilm Opx Liq Qz Pl Kfs Grt Bt Ilm Liq Qz Sil
Pl Kfs Grt Ilm Liq Qz Ky Rt
Pl Kfs Grt Bt Ilm Liq Qz Ky Rt
Pl Kfs Grt Ilm Opx Cdr Liq Qz 2 1 3 4 5 6 7 8 9 10 Field labels:
1 - Pl Kfs Grt Bt Wm Liq Qz Rt, 2 - Kfs Grt Bt Wm Ilm Liq Qz Rt, 3 - Kfs Grt Bt Wm Ilm Liq Qz Ky Rt, 4 - Pl Kfs Grt Bt Ilm Liq Qz Ky, 5 - Pl Kfs Grt Bt Ilm Liq Qz Sil Rt, 6 - Pl Kfs Grt Bt Ilm Cdr Qz Sil, 7 - Pl Kfs Grt Bt Ilm Cdr Qz, 8 - Pl Kfs Grt Bt Ilm Cdr Liq Qz, 9 - Pl Kfs Grt Bt Ilm Opx Liq Qz and 10 - Pl Kfs Grt Bt Ilm Opx Cdr Liq Qz
5
700 750 800 850 900 15 6 11 12 13 14 10 9 8 7 Temperature (ºC) Pressure (kbar) 12 11 10 9 8 7 6 5 4 3 2 1 0 Liq Vol.% 5
700 750 800 850 900 15 6 11 12 13 14 10 9 8 7 Temperature (ºC) Pressure (kbar) 5
700 750 800 850 900 15 6 11 12 13 14 10 9 8 7 Temperature (ºC) Pressure (kbar) 0.47 0.65 0.53 0.63 0.61 0.59 0.57 3 2 4 5 6 7 7 6 5 4 3 2 1 0 Bt Mg# Vol.% 5
700 750 800 850 900 15 6 11 12 13 14 10 9 8 7 Temperature (ºC) Pressure (kbar) 0.19 0.21 0.23 0.25 0.27 0.31 0.33 0.35 0.29 0.27 6 7 8 9 10 11 12 13 13 8 7 9 Grt Mg# Vol.% 5
addition of 26 vol.% of melt (Fig. 12b). Under the peak metamorphic
conditions (bold line inFig. 12a), peritectic phases (garnet and rutile)
and melt are produced byfluid-absent melting reactions (Bt + Pl +
Qz = Grt + Rt ± Kfs + melt). The pseudosection modeling predicts
that 12–34 vol.% of melt was produced as the rock progressed to the
peak conditions through partial melting reactions consuming biotite. Applying the same approach to sample CC37, muscovite and sillimanite were present just below the wet solidus in the pre-melting
assemblage (Pl + Bt + Wm + Qz + Sil + H2O) at 650 ± 20 °C and
5 ± 1 kbar (Fig. 12a). During prograde metamorphism, garnet and
melt were produced by incongruent melting of biotite and sillimanite via reaction Bt + Sil + Qz + Pl = Grt + melt, as indicated by increase
in mode of garnet and melt (Fig. 12b). The modeling indicates that
16–30 vol.% of melt was produced on the evolution to peak
metamor-phism conditions via absent-fluid melting reactions.
7. LA-ICP-MS monazite geochronology
To better constrain the timing of the two partial melting episodes that have affected the CCB, we selected a separate thin section representing each of the three assemblages from the CCB for in situ LA-ICP-MS dating of monazite. Monazite grains in the samples
com-monly occur as: a) inclusions in Grt1crystals; b) adjacent to garnet
boundaries; c) within the quartzo-feldspathic matrix; d) rarely as
inclu-sions within Grt2crystals. The results of all monazite analyses are
pre-sented in Supplementary data (Table 3) and the analytical methods are described in Supplementary material. Spot analyses that were more than 5% discordant were discarded in the calculation of weighted
mean206Pb/238U ages. A summary with the monazite ages is presented
inTable 3.
7.1. Sample CC31–assemblage 1
Monazite grains are euhedral to subhedral, elongated and
subrounded, and are 70–190μm in diameter. Backscattered electron
(BSE) imaging displays unzoned internal structure to weakly zoned
grains (Fig. 13a).
Two spot analyses of monazite included in a Grt1core have Th/U
values of 83–85 and show a mean206Pb/238U age of 617 ± 12 Ma
(95% conf., MSWD = 0.54). Six additional spot analyses on monazite
in-cluded in Grt1, which have Th/U values of 40–134, show a mean
206Pb/238U age of 560 ± 9 Ma (95% conf., MSWD = 1.8). One spot
anal-ysis in a monazite crystal that occur along microcracks in the Grt1core
yields a younger206Pb/238U age of 519 ± 14 Ma (Th/U = 20). This age
is within error of the age of monazite included in the rim of Grt1crystals
(206Pb/238U = 521 ± 14 Ma, Th/U = 27), which also displays fractures.
Matrix monazite spot analyses range from 612 to 485 Ma. Two spot
analyses in the core of matrix grains, with Th/U values of 60–61, have a
mean206Pb/238U age of 562 ± 11 Ma (95% conf., MSWD = 0.68) and
other spots show a concordant age of 612 ± 17 Ma and a Th/U value of 98. Four spot analyses in the rims of matrix grains, with Th/U values
between 36 and 43, display a mean206Pb/238U age of 492 ± 16 Ma
(95% conf., MSWD = 2.2).
7.2. Sample CC37–assemblage 2
Monazite occurs as euhedral to subhedral, elongated, subrounded to
oval-shaped grains of 50–90μm of diameter. BSE imaging revealed that
most grains are unzoned and a few crystals display afine brighter rim
(Fig. 13b).
Four spot analyses in monazite included within Grt1core, with Th/U
values of 9–18, generate a mean206Pb/238U age of 557 ± 7 Ma (95%
conf., MSWD = 1.03). Two spot analyses on monazite included within
the rim of Grt1crystals show206Pb/238U ages of 569 ± 14 and 528 ±
14 (Th/U = 13 and 15, respectively). Eight spot analyses from matrix monazite, with Th/U values between 8 and 21, produced a mean
206
Pb/238U age of 558 ± 10 Ma (95% conf., MSWD = 2.5). One spot
analysis presents younger206Pb/238U age of 484 ± 13 Ma, with Th/U
value of 8.
7.3. Sample CC21–assemblage 3
Monazite occurs in many grain shapes that vary from euhedral/
subhedral, rounded/subrounded to oval, ranging from 30 to 120μm
in size. BSE images display unzoned grains as well as complex, patchy
zonation in some examples (Fig. 13c).
Two spot analyses on monazite cores within the cores of Grt1
crys-tals show206Pb/238U ages of 566 ± 16 and 552 ± 15, with Th/U values
of 81 and 24, respectively. Two spot analysis in monazite rims that occur
along microcracks in the Grt1core display younger ages of 535 ± 14
(Th/U = 42) and 516 ± 14 Ma (Th/U = 15). One spot analysis on a
monazite included in a Grt2core shows age of 515 ± 14 Ma and Th/U
value of 10.
Eight spot analyses on matrix monazite, with Th/U values between
18 and 117, display a mean206Pb/238U age of 562 ± 5 Ma (95% conf.,
MSWD = 1.11). Two spot analyses on matrix monazite have Th/U
values of 5–25 and show a mean206Pb/238U age of 485 ± 9 Ma (95%
conf., MSWD = 0.098). One spot analysis shows an intermediate
206Pb/238U age of 527 ± 14 Ma (95% of concordance, Th/U = 20).
8. LA-ICP-MS zircon geochronology
U–Pb zircon dating can be used in combination with monazite
geochronology to constrain the metamorphic history from CCB. The samples CC31 and CC21 were chosen for in situ LA-ICP-MS dating of zir-con due to the common presence of zirzir-con within and in close proximity to garnet. In addition a zircon separate was extracted from sample CC37 to investigate possible inheritance and constrain the timing of crystalliza-tion and metamorphism. The results of all zircon analyses are reported in Supplementary Data (Table 4) and the analytical methods are described in Supplementary material. Spot analyses that were more than 5%
discor-dant were excluded from the calculation of the mean206Pb/238U ages. A
summary with the zircon ages is presented inTable 3.
8.1. Sample CC31–assemblage 1
This sample contains 80–400μm, prismatic, subhedral/euhedral
to subrounded shaped zircon grains. Cathodoluminescence (CL) imaging displays different internal structures such as concentric and convolute zoning and some grains show isometric intergrowth (Fig. 14a).
Zircon grains included within a Grt1core display convolute zoning
(Fig. 14a), typical of high-grade metamorphic zircon (e.g.,Vavra et al.,
1999). Two spot analyses, with Th/U values of 1.3–1.5, show a mean
206Pb/238U age of 563 ± 9 Ma (95% conf., MSWD = 0.094). Two spot
analyses on zircon included in the rim of the same garnet crystal have
Th/U values of 0.2–1.3 and yielded a mean206Pb/238U age of 543 ±
9 Ma (95% conf., MSWD = 0.21).
We distinguished three different types of zircon in the matrix. The
first variety displays magmatic oscillatory zoning in CL and is
character-ized by a high Th/U ratio (0.88–1.29). Four spot analyses in these
domains generated a mean206Pb/238U age of 577 ± 6 Ma (95% conf.,
MSWD = 0.105). The second type is characterized by structureless or
convolute zoning under CL imaging and low to high Th/U ratios (0.01–
Fig. 10.P–Tpseudosection calculated using the bulk composition from sample CC31 (assemblage 1). (a)P–Tfields of peak assemblage Pl-Kfs-Grt-Bt-Ilm-Qz-Rt-Liq (bold line). (b) Plot of
melt vol.%. (c) Plot of Grt Mg# and Grt vol.%. (d) Plot of XGrsand XAlm. (e) Plot of Bt Mg# and Bt vol.%. (f)P–Tconditions of equilibration estimated based on overlapping ranges of phase composition and abundance.
1) Pl Kfs Grt Bt Qz Ky Rt, 2) Pl Kfs Grt Bt Ilm Qz Ky Rt, 3) Pl Grt Bt Qz Ky Rt, 4) Pl Grt Bt Wm Qz Ky Rt, 5) Pl Grt Bt Ilm Qz Ky Rt, 6) Pl Grt Bt Ilm Liq Qz Ky, 7) Pl Grt Bt Ilm Liq Qz Ky Rt, 8) Pl Grt Bt Liq Qz Ky Rt, 9) Pl Grt Bt Wm Liq Qz Ky Rt, 10) Pl Kfs Grt Bt Liq Qz Ky Rt, 11) Pl Kfs Grt Liq Qz Ky Rt, 12) Pl Kfs Grt Liq Qz Sil Rt, 13) Pl Kfs Grt Ilm Liq Qz Sil Rt, 14) Pl Kfs Grt Bt Ilm Liq Qz Ky, 15) Pl Kfs Grt Bt Ilm Liq Qz Sil, 16) Pl Grt Bt Ilm Crd Qz Sil, 17) Pl Grt Bt Ilm Crd Liq Qz Sil, 18) Pl Kfs Grt Bt Ilm Crd Qz Sil, 19) Pl Kfs Grt Bt Ilm Crd Liq Qz Sil, 20) Pl Kfs Grt Ilm Crd Liq Qz Sil, 21) Pl Kfs Grt Ilm Crd Qz Sil, 22) Pl Grt Ilm Crd Liq Qz Sil, 23) Pl Kfs Ilm Spl Crd Qz Sil, 24) Pl Kfs Ilm Spl Crd Liq Qz Sil 25) Pl Ilm Spl Liq Q z S i l a n d 2 6 ) P l G r t I l m S p l L i q Q z S i l
Pl Kfs Grt Bt Ilm Qz Sil
Pl Kfs Grt Bt Ilm Qz Ky
Pl Grt Bt Ilm Qz Sil
Pl Grt Ilm Liq Qz Sil Pl Kfs Grt
Ilm Liq Qz Sil
600 700 800 900
Temperature (ºC) 4
5 6 7 8 9 10
Pressure (Kbar)
1
2 Pl Kfs Grt Bt
Wm Qz Ky Rt
Pl Grt Bt Ilm Liq Qz Sil Pl Grt Bt Ilm Qz Ky 4
3 5
6 7 8
9 10 12
11 13
14
15
16 17
18
19 20
21
22 Pl Ilm Spl
Crd Liq Qz Sil
2324
25 26
600 700 800 900
Temperature (ºC) 4
5 6 7 8 9 10
Pressure (Kbar)
16 17 18
18
1
7 17
15 16
16 15 14 0.14
0.13
0.13
0.15
0.10 0.12
Grt Vol% Mg#
600 700 800 900
Temperature (ºC) 4
5 6 7 8 9 10
Pressure (Kbar)
600 700 800 900
Temperature (ºC) 4
5 6 7 8 9 10
Pressure (Kbar)
1
0
3 4
5
6
2
Liq Vol%
600 700 800 900
Temperature (ºC) 4
5 6 7 8 9 10
Pressure (Kbar)
3 2
1
3
3
N
4
Field labels:
(a)
(c)
(e)
(b)
(d)
Fig. 11.P–Tpseudosection calculated with bulk composition from sample CC37 (assemblage 2). (a) P–Tfields of peak assemblage Pl-Kfs-Grt-Bt-Ilm-Qz-Sil-Liq (bold line). (b) Plots of melt
2.51). Ten spot analyses yield a mean206Pb/238U age of 562 ± 4 Ma (95%
conf., MSWD = 0.64). The last variety presents brighter cores andfine
darker rims in CL imaging, moderate to high Th/U ratios (1.06–1.53) and
it occurs together with ilmenite, adjacent to the poikiloblastic garnet
crys-tals. Five spot analyses in brighter domains produced a mean206Pb/238U
age of 528 ± 5 Ma (95% conf., MSWD = 0.37).
8.2. Sample CC37–assemblage 2
This sample yielded 50 to 280μm, prismatic, subhedral/euhedral to
subrounded zircon grains. CL imaging displays strongly luminescent or oscillatory-zoned to irregular zoning cores truncated by darker
struc-tureless overgrowths and convoluted zoning (Fig. 14c).
625 675 725 775 825 10 9 9 8 7 6 5 4 Pressure (kbar) Temperature (ºC) CC37 - Reintegrated melt
Pl Kfs Grt Ilm Liq Qz Sil
Pl Grt Bt Liq Qz Sil Pl Grt
Bt Wm Ilm H2O
Qz Pl Kfs Grt Bt Ilm Liq Qz Sil Pl Kfs Grt Bt Liq Qz Sil Pl Grt Bt
Wm Ilm Liq Qz
Wm Ilm Pl Grt Bt
Liq Qz Ky
Melt-reintegrated bulk composition: SiO2 = 57.69; TiO2 = 0.20; Al2O3 = 22.88; Fe2O3 = 0.00; FeO = 8.39; MgO = 0.83; CaO = 1.42; Na2O = 4.06; K2O = 3.06;
H2O = 1.45. Field labels: 1 - Pl Grt Bt Wm Ilm Liq Qz Rt; 2 - Pl Grt Bt Wm Liq Qz Rt; 3 - Pl Grt Wm Liq Qz Rt; 4 - Pl Grt Wm Liq Qz Ky Rt; 5 - Pl Grt Bt Wm
Liq Qz Ky Rt; 6 - Pl Kfs Grt Bt Wm Liq Qz Ky Rt; 7 - Pl Kfs Grt Bt Liq Qz Ky Rt; 8 - Pl Kfs Grt Liq Qz Ky Rt; 9 - Pl Kfs Grt Liq Qz Sil Rt; 10 - Pl Kfs Grt Ilm Liq Qz Sil Rt; 11 - Pl Kfs Grt Ilm Liq Qz Ky Rt; 12 - Pl Kfs Grt Ilm Liq Qz Ky; 13 - Pl Kfs Grt Bt Ilm Liq Qz Ky; 14 - Pl Kfs Grt Bt Wm Ilm Liq Qz Ky; 15 - Pl
Grt Bt Wm Liq Qz Ky; 16 - Pl Grt Bt Wm Ilm H2O Qz Ky;17 - Pl Grt Bt Wm H2O Qz Ky; 18 - Pl Grt Bt Wm H2O Qz Sil; 19 - Pl Bt Wm Liq Qz Sil; 20 - Pl Kfs
Grt Bt Crd Liq Qz Sil; 21 - Pl Kfs Grt Bt Crd Ilm Liq Qz Sil; 22 - Pl Kfs Grt Ilm Crd Liq Qz Sil; 23 - Pl Kfs Grt Ilm Crd Liq Sil; 24 - Pl Kfs Grt Ilm Spl Crd Liq Sil; 25 - Pl Kfs Grt Ilm Spl Liq Sil; 26 - Pl Kfs Grt Ilm Spl Crd Liq Qz; 27 - Pl Kfs Grt Ilm Spl Crd Liq; 28 - Pl Grt Ilm Spl Crd Liq; 29 - Pl Grt Ilm Spl Crd Liq Qz.
1 2 3 4
5 7
6 8 9
10 11
12 13 14
Pl Kfs Grt Ilm Liq Sil
Pl Bt Wm H2O
Qz Sil 15 16 17 18 Pl Grt Bt Wm Liq Qz Sil 19 20 21 22 Pl Bt Liq 23 24 25 26 2728 29 SOLIDUS Qz Sil
Melt-reintegrated bulk composition: SiO2 = 65.10; TiO2 = 1.02; Al2O3 = 15.38; Fe2O3 = 0.10; FeO = 5.18; MgO = 1.28; CaO = 1.67; Na2O = 3.68; K2O = 5.13;
H2O = 1.44. Field labels: 1 - Pl Grt Bt Wm H2O Qz Rt; 2 - Pl Grt Bt Wm Ilm H2O Qz Rt; 3 - Pl Grt Bt Wm Liq Qz Rt; 4 - Pl Kfs Grt Bt Wm Liq Qz Rt; 5 - Pl
Kfs Grt Bt Wm Ilm Liq Qz Rt; 6 - Pl Kfs Grt Bt Ilm Opx Liq Qz; 7 - Pl Kfs Grt Bt Ilm Opx Liq Qz Rt; 8 - Pl Kfs Grt Ilm Opx Liq Qz; 9 - Pl Kfs Grt Ilm Opx Crd Liq Qz; 10 - Pl Ilm Opx Crd Liq Qz; 11 - Pl Kfs Grt Bt Ilm Crd Liq Qz; 12 - Pl Grt Bt Ilm Crd Liq Qz; 13 - Pl Grt Bt Ilm Opx Crd Liq Qz; 14 - Pl Kfs Bt
Ilm Opx Crd Liq Qz; 15 - Pl Bt Ilm Opx Crd Liq Qz; 16 - Pl Bt Ilm Liq Qz Rt; 17 - Pl Bt Wm H2O Qz
9 41
625 675 725 775 825 875 Temperature (ºC) 10 9 8 7 6 5 4 Pressure (kbar) 11 12 13
Pl Bt Wm Ilm Liq Qz
Pl Grt Bt Wm Ilm Liq Qz Rt Pl Grt Bt Wm Liq Qz Rt 1
2
Pl Bt Wm Ilm H2O Qz
3 4
5
Pl Kfs Grt Bt Ilm Liq Qz Rt
Pl Kfs Grt Bt Ilm Liq Qz Pl Grt Bt Ilm Liq Qz
Pl Grt Bt Ilm Crd Liq Qz Pl Bt Ilm
Crd Liq Qz Pl Grt Bt Ilm Liq Qz Rt Pl Bt Ilm Liq Qz 6 7 Pl Kfs Grt Ilm Opx Liq Qz Rt 8 9 Pl Kfs Ilm Opx Crd Liq Qz Ilm Opx Crd Liq Qz Pl 10 11 12 13 14 15 16 17
CC31 - Reintegrated melt
9 41
625 675 725 775 825 875 Temperature (ºC) 10 9 8 7 6 5 4 Pressure (kbar) 11 12 13
CC31 - Reintegrated melt
SOLIDUS 0 4 6 8 10 12 14
16 24 28
20 18 22 26 30 56 54 2 0 4 4 6 8 10 6 4 Liq Vol% Grt Vol%
(a)
(b)
(c)
625 675 725 775 825 Temperature (ºC) 10 9 9 8 7 6 5 4 Pressure (kbar)
CC37 - Reintegrated melt
0 2 22 24 26 28 30 32 34 36 38 40 42 54 4 6 8 10 12 14 16 18 20 0 4 12 14 14 0 2 4 6 8 12 6 Liq Vol% Grt Vol%
(d)
Fig. 12.Melt-reintegratedP–Tpseudosection for samples CC31 (a,b) and CC37 (c,d) following the method ofWhite et al. (2004). (a) The arrow shows the prograde path from the
subsolidus assemblage (Pl-Bt-Wm-Ilm-H2O-Qz) towards peak metamorphism indicated by bold line (Pl-Kfs-Grt-Bt-Ilm-Qz-Rt-Liq). (b) Plots of Melt vol.% and Grt vol.%. (c) The arrow indicates the prograde path from the subsolidus assemblage (Pl-Bt-Wm-H2O-Qz-Sil) towards peak metamorphism assemblage (Pl-Kfs-Grt-Bt-Ilm-Qz-Sil-Liq) indicated by bold line. (d) Plots of Melt vol.% and Grt vol.%.
Ten spot analyses on CL-defined inherited cores (strongly
lumines-cent cores) have variable Th/U values of 0.03–0.49 and yield a mean
206Pb/238U age of 607 ± 4 Ma (95% conf., MSWD = 0.90). One spot
has an older inherited206Pb/238U age of 706 ± 15 Ma and a Th/U ratio
of 0.10. Based on the Th/U ratio obtained in fourteen analyses from the brighter zircon cores with oscillatory to irregular zoning, two Table 3
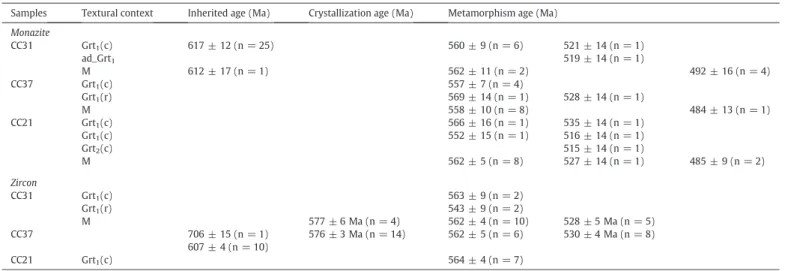
Summary of geochronological data showing inherited, crystallization and metamorphism ages for the Carlos Chagas batholith.
Samples Textural context Inherited age (Ma) Crystallization age (Ma) Metamorphism age (Ma)
Monazite
CC31 Grt1(c) 617 ± 12 (n = 25) 560 ± 9 (n = 6) 521 ± 14 (n = 1)
ad_Grt1 519 ± 14 (n = 1)
M 612 ± 17 (n = 1) 562 ± 11 (n = 2) 492 ± 16 (n = 4)
CC37 Grt1(c) 557 ± 7 (n = 4)
Grt1(r) 569 ± 14 (n = 1) 528 ± 14 (n = 1)
M 558 ± 10 (n = 8) 484 ± 13 (n = 1)
CC21 Grt1(c) 566 ± 16 (n = 1) 535 ± 14 (n = 1)
Grt1(c) 552 ± 15 (n = 1) 516 ± 14 (n = 1)
Grt2(c) 515 ± 14 (n = 1)
M 562 ± 5 (n = 8) 527 ± 14 (n = 1) 485 ± 9 (n = 2)
Zircon
CC31 Grt1(c) 563 ± 9 (n = 2)
Grt1(r) 543 ± 9 (n = 2)
M 577 ± 6 Ma (n = 4) 562 ± 4 (n = 10) 528 ± 5 Ma (n = 5)
CC37 706 ± 15 (n = 1) 576 ± 3 Ma (n = 14) 562 ± 5 (n = 6) 530 ± 4 Ma (n = 8)
607 ± 4 (n = 10)
CC21 Grt1(c) 564 ± 4 (n = 7)
Textural context of the monazite and zircon: Grt1(c), monazite/zircon grain included in poikiloblastic garnet core; Grt1(r), monazite/zircon grain included in poikiloblastic garnet rim; Grt2(c), monazite grain included in smaller garnet core; ad_Grt1, monazite grain adjacent or touching poikiloblastic garnet rim; M, monazite/zircon grain in the matrix. n = number of analyses.
(a)
(b)
(c)
Fig. 13.Histogram of monazite age data using the mean206Pb/238U age and representative BSE images for monazite grains analyzed in this study. The microstructure position of monazite
analyzed in each sample is indicated by white rectangles. (a) Histogram of inherited and metamorphic monazite grains obtained from sample CC31 (assemblage 1). BSE images display unzoned internal structure to weakly zoned grains. (b) Histogram of metamorphic monazite included in Grt1and matrix from sample CC37 (assemblage 2). Some grains show darker core surrounded byfine brighter rim in BSE images (c) Histogram showing metamorphic monazite age obtained in the matrix and Grt1and Grt2crystals from sample CC21 (assemblage 3). Matrix monazite displays patchy zoning via BSE images. Scale bar is equal to 200μm for the textural position of analyzed grains.
different populations were distinguished: low (0.02–0.06) and high
Th/U (0.28–0.92) ratios. However, both populations are age equivalent
within analytical uncertainties and provide a mean206Pb/238U age of
576 ± 3 Ma (95% conf., MSWD = 0.35). Six out of fourteen spot analyses performed on the darker and structureless zircon grains, with Th/U
values between 0.02 and 0.14, yielded a mean206Pb/238U age of 562 ±
5 Ma (95% conf., MSWD = 1.15). Eight additional analyses on the
struc-tureless zircon grains also have low Th/U ratio (0.02–0.16) and show a
mean206Pb/238U age of 530 ± 4 Ma (95% conf., MSWD = 0.38).
8.3. Sample CC21–assemblage 3
Zircon grains are prismatic, subhedral to euhedral, ranging from 25
to 150μm. CL images reveal recrystallization features typical of granulite
facies zircon, such as convoluted zoning and darker cores truncated by
irregular zoning (Fig. 14b). Seven spot analyses from zircon within
Grt1core, with Th/U values between 0.03 and 0.39, yield a mean
206Pb/238U age of 564 ± 4 Ma (95% conf., MSWD = 1.01).
9. Discussion and conclusions
This work has uncovered two previously unrecognized anatectic events that have affected the entire Carlos Chagas batholith. This
polymetamorphic anatectic history has not been identified by previous
regional geological investigations due to the fact that the ubiquitous megacrystic K-feldspar crystals that characterize the CCB were not
involved in the melting processes which, in both events, primarily consumed biotite, quartz and plagioclase in the matrix interstitial to
the megacrysts. The reason for this is that biotitefluid-absent melting
reactions are close to degeneracy with regard to K-feldspar and either produce or consume only small amounts of K-feldspar, depending
on the specifics of pressure of melting and bulk composition (e.g.
Carrington and Watt, 1995). In the CCB this results in anatectic events that are not obvious without detailed textural and quantitative mineral chemical analysis. The evidence for anatexis of the CCB, the timing of
anatexis and the P–T paths relevant to the anatectic events are discussed
below.
9.1. U–Pb ages of monazite and zircon from the Carlos Chagas batholith
The ages of 577 ± 6 Ma (CC31) and 576 ± 3 Ma (CC37) obtained from oscillatory-zoned or irregular zoned cores of zircon, with variable
Th/U ratios (0.02–1.29), are interpreted as best representing the
crystalli-zation age of the batholith (Fig. 14a,b;Table 3). This is in agreement with
previous studies which have demonstrated that the syn-collisional gran-ites in the Araçuaí orogen were emplaced between 585 and 545 Ma, with
the dominant magmatic age being ca. 575 Ma (Gradim et al., 2014;
Pedrosa-Soares et al., 2011; Richter et al., 2016; Roncato, 2009; Silva et al., 2002, 2005; Vauchez et al., 2007).
U–Pb ages of some monazite cores found within Grt1and in the
ma-trix (CC31) give ages of 617 ± 12 Ma and 612 ± 17 Ma (Fig. 13a;
Table 3), respectively. These grains can be interpreted as inherited
(a)
(b)
(c)
Fig. 14.Histogram and representative cathodoluminescence images of zircons from CCB. The microstructure position of zircon analyzed in each sample is indicated by white rectangles.
(a) Histogram displaying206Pb/238U age of zircon included in Grt1and matrix from sample CC31 (assemblage 1). Zircon show convoluted zonation typical of high-grade metamorphism. (b) Histogram showing main206Pb/238U age of inherited, magmatic and metamorphic zircons from sample CC37 (assemblage 2). Zircon comprising strongly luminescent inherited core and irregular zoning magmatic core truncated by darker rim. (c) Histogram showing main206Pb/238U age of zircon included in Grt1from sample CC21 (assemblage 3). Zircon displays irregular zoning. Scale bar is equal to 200μm for the textural position of analyzed grains.